

Key Insights
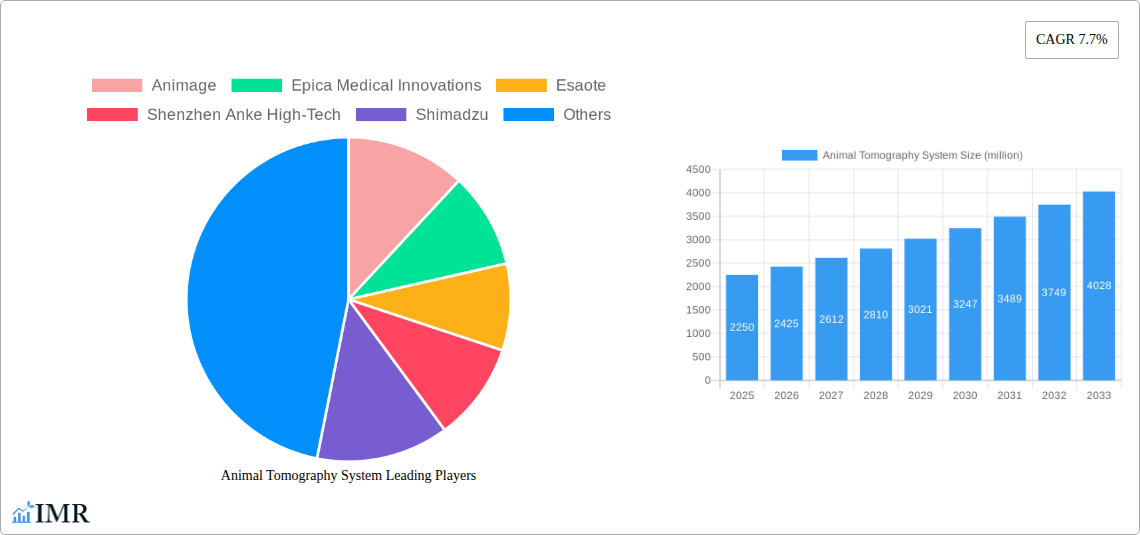
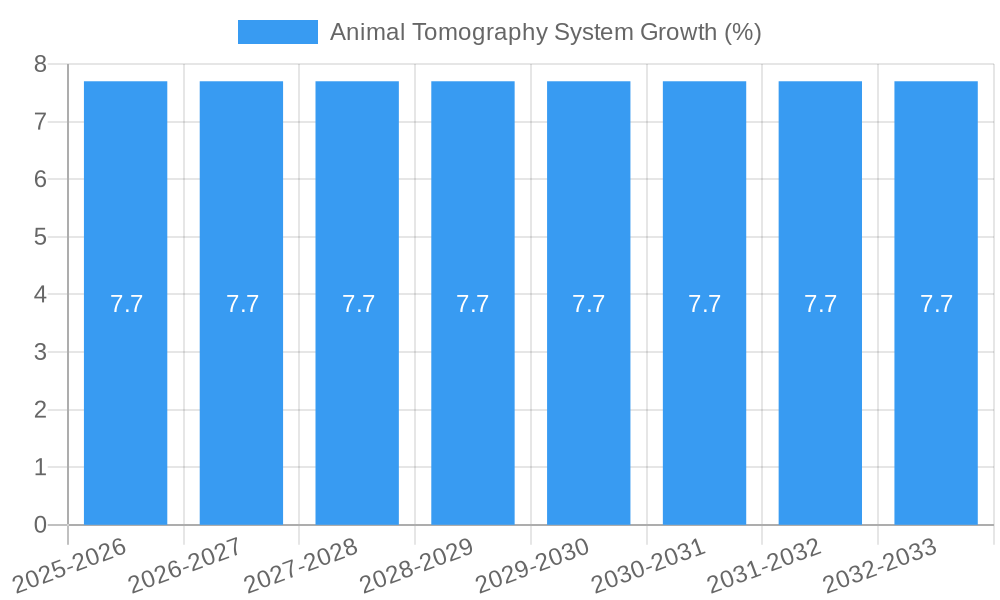
The global animal tomography system market, valued at approximately $1941 million in 2019, is experiencing robust growth, projected to maintain a Compound Annual Growth Rate (CAGR) of 7.7% from 2019 to 2033. This expansion is driven by several key factors. The increasing prevalence of animal diseases requiring precise diagnostic imaging is a major catalyst. Veterinary professionals are increasingly adopting advanced imaging technologies like tomography for earlier and more accurate diagnoses, leading to improved treatment outcomes and enhanced animal welfare. Furthermore, technological advancements resulting in smaller, more portable, and cost-effective systems are broadening accessibility, particularly in smaller veterinary clinics and rural areas. The rising pet ownership globally, coupled with increased disposable incomes in many countries, further fuels the market's growth trajectory. Improved image quality, faster scan times, and advanced software features for image analysis are also contributing factors. However, high initial investment costs for acquiring and maintaining these sophisticated systems, along with the need for specialized veterinary technicians proficient in operating and interpreting the imagery, can pose challenges to market penetration, especially in developing regions.
Despite these restraints, the market presents significant opportunities. Growth is expected to be particularly strong in emerging economies experiencing rapid growth in their veterinary care sectors. The development of innovative imaging techniques, such as multi-detector computed tomography (MDCT) offering superior resolution and speed, will continue to shape the market landscape. The emergence of telemedicine platforms that integrate imaging data could also play a crucial role in fostering wider adoption. The competition among key players like Animage, Epica Medical Innovations, Esaote, and others is further driving innovation and potentially lowering costs over time, making advanced animal tomography accessible to a broader spectrum of veterinary practices. This creates a dynamic market poised for continued and significant expansion in the coming years.
Animal Tomography System Market Report: 2019-2033
This comprehensive report provides an in-depth analysis of the Animal Tomography System market, encompassing market dynamics, growth trends, regional analysis, product landscape, key players, and future outlook. The study period covers 2019-2033, with 2025 as the base and estimated year, and a forecast period of 2025-2033. This report is crucial for veterinary professionals, investors, and industry stakeholders seeking a thorough understanding of this rapidly evolving market. The report segments the market by technology type (e.g., CT, PET) and animal type (e.g., equine, canine, feline), providing granular insights into various market segments. The parent market is the veterinary imaging equipment market, and the child market is the specialized animal diagnostic imaging market. The market size is predicted to reach xx million units by 2033.
Animal Tomography System Market Dynamics & Structure
The Animal Tomography System market is characterized by moderate concentration, with key players like Animage, Epica Medical Innovations, Esaote, and Shimadzu holding significant market share, estimated at xx% collectively in 2025. Technological innovation, particularly in image resolution and speed, is a major driver. Regulatory frameworks vary across geographies, influencing market access and adoption rates. Competitive substitutes include traditional X-ray and ultrasound systems. The end-user demographic includes veterinary clinics, hospitals, and research institutions, with a growing preference for advanced imaging solutions. M&A activity has been relatively low in recent years, with only xx deals recorded between 2019 and 2024, primarily focused on smaller companies. Innovation barriers include high development costs and regulatory approvals.
- Market Concentration: Moderately concentrated, with top 5 players holding xx% market share in 2025.
- Technological Innovation: Key driver, focused on improved image quality, speed, and reduced radiation dose.
- Regulatory Frameworks: Vary significantly across regions, impacting market entry and adoption.
- Competitive Substitutes: Traditional X-ray and ultrasound systems present competition.
- End-User Demographics: Veterinary clinics, hospitals, and research institutions are key end-users.
- M&A Activity: Relatively low, with xx deals recorded between 2019 and 2024.
Animal Tomography System Growth Trends & Insights
The Animal Tomography System market experienced a CAGR of xx% during the historical period (2019-2024) and is projected to grow at a CAGR of xx% during the forecast period (2025-2033). This growth is driven by increasing pet ownership, rising veterinary healthcare expenditure, and advancements in imaging technology. Market penetration remains relatively low compared to human healthcare, presenting significant growth opportunities. Technological disruptions, such as AI-powered image analysis, are enhancing diagnostic accuracy and efficiency, boosting adoption rates. Consumer behavior is shifting towards more advanced diagnostic tools, particularly in specialized veterinary care. Market size is estimated at xx million units in 2025 and is projected to reach xx million units by 2033.
Dominant Regions, Countries, or Segments in Animal Tomography System
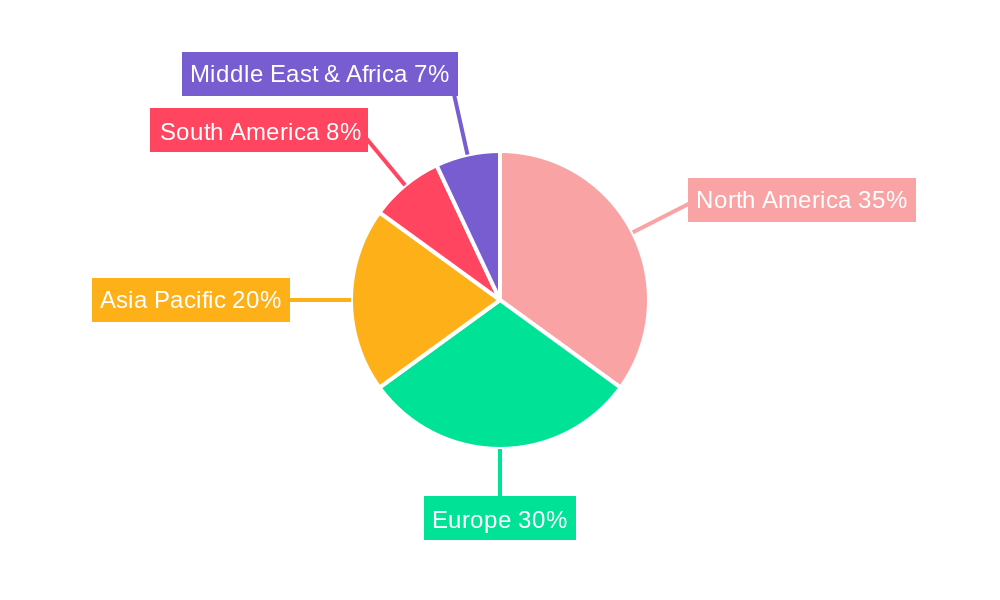
North America currently dominates the Animal Tomography System market, accounting for xx% of global revenue in 2025. This dominance is attributed to high veterinary healthcare spending, advanced healthcare infrastructure, and a significant number of specialized veterinary clinics. Europe follows closely, holding xx% market share. Key drivers in these regions include strong regulatory frameworks, technological advancements, and increasing pet insurance coverage. The Asia-Pacific region exhibits significant growth potential, driven by rising pet ownership and expanding veterinary healthcare infrastructure.
- North America: High veterinary spending, advanced infrastructure, and high pet ownership drive market leadership.
- Europe: Strong regulatory frameworks and technological advancements fuel market growth.
- Asia-Pacific: Rising pet ownership and expanding veterinary infrastructure present significant growth potential.
Animal Tomography System Product Landscape
The Animal Tomography System market offers a range of products with varying specifications, including CT scanners with enhanced resolution capabilities and specialized software for image analysis. Advancements in detector technology and image processing algorithms enable faster scan times and improved diagnostic accuracy. Unique selling propositions include compact designs suitable for smaller veterinary clinics, user-friendly interfaces, and advanced image analysis tools.
Key Drivers, Barriers & Challenges in Animal Tomography System
Key Drivers: Increasing pet ownership, rising veterinary healthcare expenditure, technological advancements (AI-powered image analysis), and growing demand for advanced diagnostic tools.
Challenges: High initial investment costs, limited reimbursement coverage in some regions, and the need for specialized training to operate the systems. Supply chain disruptions, particularly concerning specialized components, can also affect market growth. The impact of these disruptions on the overall market value is estimated to be around xx million units in 2025.
Emerging Opportunities in Animal Tomography System
Emerging opportunities include expansion into untapped markets, such as developing economies with growing veterinary sectors; development of specialized systems for specific animal species; integration of AI and machine learning for improved diagnostic accuracy and efficiency; and the development of portable and mobile tomography systems to provide wider accessibility.
Growth Accelerators in the Animal Tomography System Industry
Technological innovation, strategic partnerships between imaging equipment manufacturers and veterinary clinics, and market expansion into developing economies will significantly accelerate market growth in the long term. Further development of user-friendly interfaces and integration with existing veterinary practice management systems will further stimulate adoption.
Key Players Shaping the Animal Tomography System Market
- Animage
- Epica Medical Innovations
- Esaote
- Shenzhen Anke High-Tech
- Shimadzu
- Time Medical Systems
- MinFound Medical Systems
- MYVET
- NewTom
- GNI ApS
- Hallmarq Veterinary Imaging
- ICRco
Notable Milestones in Animal Tomography System Sector
- 2021: Animage launched a new CT scanner with improved image quality.
- 2022: Esaote partnered with a veterinary hospital chain to expand its market reach.
- 2023: Shimadzu received regulatory approval for a new PET scanner in a key market.
- 2024: A significant merger occurred between two smaller companies in the animal tomography market, resulting in xx million units increase in market value.
In-Depth Animal Tomography System Market Outlook
The Animal Tomography System market is poised for substantial growth, driven by technological advancements, increasing veterinary healthcare spending, and expanding market penetration. Strategic partnerships, focused product development, and expansion into new geographic markets will be critical for sustained long-term growth. The future market potential is significant, with opportunities for innovation in areas such as AI-powered image analysis and portable systems.
Animal Tomography System Segmentation
-
1. Application
- 1.1. Large Animals
- 1.2. Small Animals
-
2. Type
- 2.1. MRI System
- 2.2. X-Ray System
- 2.3. CBCT System
Animal Tomography System Segmentation By Geography
-
1. North America
- 1.1. United States
- 1.2. Canada
- 1.3. Mexico
-
2. South America
- 2.1. Brazil
- 2.2. Argentina
- 2.3. Rest of South America
-
3. Europe
- 3.1. United Kingdom
- 3.2. Germany
- 3.3. France
- 3.4. Italy
- 3.5. Spain
- 3.6. Russia
- 3.7. Benelux
- 3.8. Nordics
- 3.9. Rest of Europe
-
4. Middle East & Africa
- 4.1. Turkey
- 4.2. Israel
- 4.3. GCC
- 4.4. North Africa
- 4.5. South Africa
- 4.6. Rest of Middle East & Africa
-
5. Asia Pacific
- 5.1. China
- 5.2. India
- 5.3. Japan
- 5.4. South Korea
- 5.5. ASEAN
- 5.6. Oceania
- 5.7. Rest of Asia Pacific
Animal Tomography System REPORT HIGHLIGHTS
| Aspects | Details |
|---|---|
| Study Period | 2019-2033 |
| Base Year | 2024 |
| Estimated Year | 2025 |
| Forecast Period | 2025-2033 |
| Historical Period | 2019-2024 |
| Growth Rate | CAGR of 7.7% from 2019-2033 |
| Segmentation |
|
Table of Contents
- 1. Introduction
- 1.1. Research Scope
- 1.2. Market Segmentation
- 1.3. Research Methodology
- 1.4. Definitions and Assumptions
- 2. Executive Summary
- 2.1. Introduction
- 3. Market Dynamics
- 3.1. Introduction
- 3.2. Market Drivers
- 3.3. Market Restrains
- 3.4. Market Trends
- 4. Market Factor Analysis
- 4.1. Porters Five Forces
- 4.2. Supply/Value Chain
- 4.3. PESTEL analysis
- 4.4. Market Entropy
- 4.5. Patent/Trademark Analysis
- 5. Global Animal Tomography System Analysis, Insights and Forecast, 2019-2031
- 5.1. Market Analysis, Insights and Forecast - by Application
- 5.1.1. Large Animals
- 5.1.2. Small Animals
- 5.2. Market Analysis, Insights and Forecast - by Type
- 5.2.1. MRI System
- 5.2.2. X-Ray System
- 5.2.3. CBCT System
- 5.3. Market Analysis, Insights and Forecast - by Region
- 5.3.1. North America
- 5.3.2. South America
- 5.3.3. Europe
- 5.3.4. Middle East & Africa
- 5.3.5. Asia Pacific
- 5.1. Market Analysis, Insights and Forecast - by Application
- 6. North America Animal Tomography System Analysis, Insights and Forecast, 2019-2031
- 6.1. Market Analysis, Insights and Forecast - by Application
- 6.1.1. Large Animals
- 6.1.2. Small Animals
- 6.2. Market Analysis, Insights and Forecast - by Type
- 6.2.1. MRI System
- 6.2.2. X-Ray System
- 6.2.3. CBCT System
- 6.1. Market Analysis, Insights and Forecast - by Application
- 7. South America Animal Tomography System Analysis, Insights and Forecast, 2019-2031
- 7.1. Market Analysis, Insights and Forecast - by Application
- 7.1.1. Large Animals
- 7.1.2. Small Animals
- 7.2. Market Analysis, Insights and Forecast - by Type
- 7.2.1. MRI System
- 7.2.2. X-Ray System
- 7.2.3. CBCT System
- 7.1. Market Analysis, Insights and Forecast - by Application
- 8. Europe Animal Tomography System Analysis, Insights and Forecast, 2019-2031
- 8.1. Market Analysis, Insights and Forecast - by Application
- 8.1.1. Large Animals
- 8.1.2. Small Animals
- 8.2. Market Analysis, Insights and Forecast - by Type
- 8.2.1. MRI System
- 8.2.2. X-Ray System
- 8.2.3. CBCT System
- 8.1. Market Analysis, Insights and Forecast - by Application
- 9. Middle East & Africa Animal Tomography System Analysis, Insights and Forecast, 2019-2031
- 9.1. Market Analysis, Insights and Forecast - by Application
- 9.1.1. Large Animals
- 9.1.2. Small Animals
- 9.2. Market Analysis, Insights and Forecast - by Type
- 9.2.1. MRI System
- 9.2.2. X-Ray System
- 9.2.3. CBCT System
- 9.1. Market Analysis, Insights and Forecast - by Application
- 10. Asia Pacific Animal Tomography System Analysis, Insights and Forecast, 2019-2031
- 10.1. Market Analysis, Insights and Forecast - by Application
- 10.1.1. Large Animals
- 10.1.2. Small Animals
- 10.2. Market Analysis, Insights and Forecast - by Type
- 10.2.1. MRI System
- 10.2.2. X-Ray System
- 10.2.3. CBCT System
- 10.1. Market Analysis, Insights and Forecast - by Application
- 11. Competitive Analysis
- 11.1. Global Market Share Analysis 2024
- 11.2. Company Profiles
- 11.2.1 Animage
- 11.2.1.1. Overview
- 11.2.1.2. Products
- 11.2.1.3. SWOT Analysis
- 11.2.1.4. Recent Developments
- 11.2.1.5. Financials (Based on Availability)
- 11.2.2 Epica Medical Innovations
- 11.2.2.1. Overview
- 11.2.2.2. Products
- 11.2.2.3. SWOT Analysis
- 11.2.2.4. Recent Developments
- 11.2.2.5. Financials (Based on Availability)
- 11.2.3 Esaote
- 11.2.3.1. Overview
- 11.2.3.2. Products
- 11.2.3.3. SWOT Analysis
- 11.2.3.4. Recent Developments
- 11.2.3.5. Financials (Based on Availability)
- 11.2.4 Shenzhen Anke High-Tech
- 11.2.4.1. Overview
- 11.2.4.2. Products
- 11.2.4.3. SWOT Analysis
- 11.2.4.4. Recent Developments
- 11.2.4.5. Financials (Based on Availability)
- 11.2.5 Shimadzu
- 11.2.5.1. Overview
- 11.2.5.2. Products
- 11.2.5.3. SWOT Analysis
- 11.2.5.4. Recent Developments
- 11.2.5.5. Financials (Based on Availability)
- 11.2.6 Time Medical Systems
- 11.2.6.1. Overview
- 11.2.6.2. Products
- 11.2.6.3. SWOT Analysis
- 11.2.6.4. Recent Developments
- 11.2.6.5. Financials (Based on Availability)
- 11.2.7 MinFound Medical Systems
- 11.2.7.1. Overview
- 11.2.7.2. Products
- 11.2.7.3. SWOT Analysis
- 11.2.7.4. Recent Developments
- 11.2.7.5. Financials (Based on Availability)
- 11.2.8 MYVET
- 11.2.8.1. Overview
- 11.2.8.2. Products
- 11.2.8.3. SWOT Analysis
- 11.2.8.4. Recent Developments
- 11.2.8.5. Financials (Based on Availability)
- 11.2.9 NewTom
- 11.2.9.1. Overview
- 11.2.9.2. Products
- 11.2.9.3. SWOT Analysis
- 11.2.9.4. Recent Developments
- 11.2.9.5. Financials (Based on Availability)
- 11.2.10 GNI ApS
- 11.2.10.1. Overview
- 11.2.10.2. Products
- 11.2.10.3. SWOT Analysis
- 11.2.10.4. Recent Developments
- 11.2.10.5. Financials (Based on Availability)
- 11.2.11 Hallmarq Veterinary Imaging
- 11.2.11.1. Overview
- 11.2.11.2. Products
- 11.2.11.3. SWOT Analysis
- 11.2.11.4. Recent Developments
- 11.2.11.5. Financials (Based on Availability)
- 11.2.12 ICRco
- 11.2.12.1. Overview
- 11.2.12.2. Products
- 11.2.12.3. SWOT Analysis
- 11.2.12.4. Recent Developments
- 11.2.12.5. Financials (Based on Availability)
- 11.2.1 Animage
List of Figures
- Figure 1: Global Animal Tomography System Revenue Breakdown (million, %) by Region 2024 & 2032
- Figure 2: North America Animal Tomography System Revenue (million), by Application 2024 & 2032
- Figure 3: North America Animal Tomography System Revenue Share (%), by Application 2024 & 2032
- Figure 4: North America Animal Tomography System Revenue (million), by Type 2024 & 2032
- Figure 5: North America Animal Tomography System Revenue Share (%), by Type 2024 & 2032
- Figure 6: North America Animal Tomography System Revenue (million), by Country 2024 & 2032
- Figure 7: North America Animal Tomography System Revenue Share (%), by Country 2024 & 2032
- Figure 8: South America Animal Tomography System Revenue (million), by Application 2024 & 2032
- Figure 9: South America Animal Tomography System Revenue Share (%), by Application 2024 & 2032
- Figure 10: South America Animal Tomography System Revenue (million), by Type 2024 & 2032
- Figure 11: South America Animal Tomography System Revenue Share (%), by Type 2024 & 2032
- Figure 12: South America Animal Tomography System Revenue (million), by Country 2024 & 2032
- Figure 13: South America Animal Tomography System Revenue Share (%), by Country 2024 & 2032
- Figure 14: Europe Animal Tomography System Revenue (million), by Application 2024 & 2032
- Figure 15: Europe Animal Tomography System Revenue Share (%), by Application 2024 & 2032
- Figure 16: Europe Animal Tomography System Revenue (million), by Type 2024 & 2032
- Figure 17: Europe Animal Tomography System Revenue Share (%), by Type 2024 & 2032
- Figure 18: Europe Animal Tomography System Revenue (million), by Country 2024 & 2032
- Figure 19: Europe Animal Tomography System Revenue Share (%), by Country 2024 & 2032
- Figure 20: Middle East & Africa Animal Tomography System Revenue (million), by Application 2024 & 2032
- Figure 21: Middle East & Africa Animal Tomography System Revenue Share (%), by Application 2024 & 2032
- Figure 22: Middle East & Africa Animal Tomography System Revenue (million), by Type 2024 & 2032
- Figure 23: Middle East & Africa Animal Tomography System Revenue Share (%), by Type 2024 & 2032
- Figure 24: Middle East & Africa Animal Tomography System Revenue (million), by Country 2024 & 2032
- Figure 25: Middle East & Africa Animal Tomography System Revenue Share (%), by Country 2024 & 2032
- Figure 26: Asia Pacific Animal Tomography System Revenue (million), by Application 2024 & 2032
- Figure 27: Asia Pacific Animal Tomography System Revenue Share (%), by Application 2024 & 2032
- Figure 28: Asia Pacific Animal Tomography System Revenue (million), by Type 2024 & 2032
- Figure 29: Asia Pacific Animal Tomography System Revenue Share (%), by Type 2024 & 2032
- Figure 30: Asia Pacific Animal Tomography System Revenue (million), by Country 2024 & 2032
- Figure 31: Asia Pacific Animal Tomography System Revenue Share (%), by Country 2024 & 2032
List of Tables
- Table 1: Global Animal Tomography System Revenue million Forecast, by Region 2019 & 2032
- Table 2: Global Animal Tomography System Revenue million Forecast, by Application 2019 & 2032
- Table 3: Global Animal Tomography System Revenue million Forecast, by Type 2019 & 2032
- Table 4: Global Animal Tomography System Revenue million Forecast, by Region 2019 & 2032
- Table 5: Global Animal Tomography System Revenue million Forecast, by Application 2019 & 2032
- Table 6: Global Animal Tomography System Revenue million Forecast, by Type 2019 & 2032
- Table 7: Global Animal Tomography System Revenue million Forecast, by Country 2019 & 2032
- Table 8: United States Animal Tomography System Revenue (million) Forecast, by Application 2019 & 2032
- Table 9: Canada Animal Tomography System Revenue (million) Forecast, by Application 2019 & 2032
- Table 10: Mexico Animal Tomography System Revenue (million) Forecast, by Application 2019 & 2032
- Table 11: Global Animal Tomography System Revenue million Forecast, by Application 2019 & 2032
- Table 12: Global Animal Tomography System Revenue million Forecast, by Type 2019 & 2032
- Table 13: Global Animal Tomography System Revenue million Forecast, by Country 2019 & 2032
- Table 14: Brazil Animal Tomography System Revenue (million) Forecast, by Application 2019 & 2032
- Table 15: Argentina Animal Tomography System Revenue (million) Forecast, by Application 2019 & 2032
- Table 16: Rest of South America Animal Tomography System Revenue (million) Forecast, by Application 2019 & 2032
- Table 17: Global Animal Tomography System Revenue million Forecast, by Application 2019 & 2032
- Table 18: Global Animal Tomography System Revenue million Forecast, by Type 2019 & 2032
- Table 19: Global Animal Tomography System Revenue million Forecast, by Country 2019 & 2032
- Table 20: United Kingdom Animal Tomography System Revenue (million) Forecast, by Application 2019 & 2032
- Table 21: Germany Animal Tomography System Revenue (million) Forecast, by Application 2019 & 2032
- Table 22: France Animal Tomography System Revenue (million) Forecast, by Application 2019 & 2032
- Table 23: Italy Animal Tomography System Revenue (million) Forecast, by Application 2019 & 2032
- Table 24: Spain Animal Tomography System Revenue (million) Forecast, by Application 2019 & 2032
- Table 25: Russia Animal Tomography System Revenue (million) Forecast, by Application 2019 & 2032
- Table 26: Benelux Animal Tomography System Revenue (million) Forecast, by Application 2019 & 2032
- Table 27: Nordics Animal Tomography System Revenue (million) Forecast, by Application 2019 & 2032
- Table 28: Rest of Europe Animal Tomography System Revenue (million) Forecast, by Application 2019 & 2032
- Table 29: Global Animal Tomography System Revenue million Forecast, by Application 2019 & 2032
- Table 30: Global Animal Tomography System Revenue million Forecast, by Type 2019 & 2032
- Table 31: Global Animal Tomography System Revenue million Forecast, by Country 2019 & 2032
- Table 32: Turkey Animal Tomography System Revenue (million) Forecast, by Application 2019 & 2032
- Table 33: Israel Animal Tomography System Revenue (million) Forecast, by Application 2019 & 2032
- Table 34: GCC Animal Tomography System Revenue (million) Forecast, by Application 2019 & 2032
- Table 35: North Africa Animal Tomography System Revenue (million) Forecast, by Application 2019 & 2032
- Table 36: South Africa Animal Tomography System Revenue (million) Forecast, by Application 2019 & 2032
- Table 37: Rest of Middle East & Africa Animal Tomography System Revenue (million) Forecast, by Application 2019 & 2032
- Table 38: Global Animal Tomography System Revenue million Forecast, by Application 2019 & 2032
- Table 39: Global Animal Tomography System Revenue million Forecast, by Type 2019 & 2032
- Table 40: Global Animal Tomography System Revenue million Forecast, by Country 2019 & 2032
- Table 41: China Animal Tomography System Revenue (million) Forecast, by Application 2019 & 2032
- Table 42: India Animal Tomography System Revenue (million) Forecast, by Application 2019 & 2032
- Table 43: Japan Animal Tomography System Revenue (million) Forecast, by Application 2019 & 2032
- Table 44: South Korea Animal Tomography System Revenue (million) Forecast, by Application 2019 & 2032
- Table 45: ASEAN Animal Tomography System Revenue (million) Forecast, by Application 2019 & 2032
- Table 46: Oceania Animal Tomography System Revenue (million) Forecast, by Application 2019 & 2032
- Table 47: Rest of Asia Pacific Animal Tomography System Revenue (million) Forecast, by Application 2019 & 2032
Frequently Asked Questions
1. What is the projected Compound Annual Growth Rate (CAGR) of the Animal Tomography System?
The projected CAGR is approximately 7.7%.
2. Which companies are prominent players in the Animal Tomography System?
Key companies in the market include Animage, Epica Medical Innovations, Esaote, Shenzhen Anke High-Tech, Shimadzu, Time Medical Systems, MinFound Medical Systems, MYVET, NewTom, GNI ApS, Hallmarq Veterinary Imaging, ICRco.
3. What are the main segments of the Animal Tomography System?
The market segments include Application, Type.
4. Can you provide details about the market size?
The market size is estimated to be USD 1941 million as of 2022.
5. What are some drivers contributing to market growth?
N/A
6. What are the notable trends driving market growth?
N/A
7. Are there any restraints impacting market growth?
N/A
8. Can you provide examples of recent developments in the market?
N/A
9. What pricing options are available for accessing the report?
Pricing options include single-user, multi-user, and enterprise licenses priced at USD 2900.00, USD 4350.00, and USD 5800.00 respectively.
10. Is the market size provided in terms of value or volume?
The market size is provided in terms of value, measured in million.
11. Are there any specific market keywords associated with the report?
Yes, the market keyword associated with the report is "Animal Tomography System," which aids in identifying and referencing the specific market segment covered.
12. How do I determine which pricing option suits my needs best?
The pricing options vary based on user requirements and access needs. Individual users may opt for single-user licenses, while businesses requiring broader access may choose multi-user or enterprise licenses for cost-effective access to the report.
13. Are there any additional resources or data provided in the Animal Tomography System report?
While the report offers comprehensive insights, it's advisable to review the specific contents or supplementary materials provided to ascertain if additional resources or data are available.
14. How can I stay updated on further developments or reports in the Animal Tomography System?
To stay informed about further developments, trends, and reports in the Animal Tomography System, consider subscribing to industry newsletters, following relevant companies and organizations, or regularly checking reputable industry news sources and publications.
Methodology
Step 1 - Identification of Relevant Samples Size from Population Database


Step 2 - Approaches for Defining Global Market Size (Value, Volume* & Price*)

Note*: In applicable scenarios
Step 3 - Data Sources
Primary Research
- Web Analytics
- Survey Reports
- Research Institute
- Latest Research Reports
- Opinion Leaders
Secondary Research
- Annual Reports
- White Paper
- Latest Press Release
- Industry Association
- Paid Database
- Investor Presentations

Step 4 - Data Triangulation
Involves using different sources of information in order to increase the validity of a study
These sources are likely to be stakeholders in a program - participants, other researchers, program staff, other community members, and so on.
Then we put all data in single framework & apply various statistical tools to find out the dynamic on the market.
During the analysis stage, feedback from the stakeholder groups would be compared to determine areas of agreement as well as areas of divergence
