

Key Insights
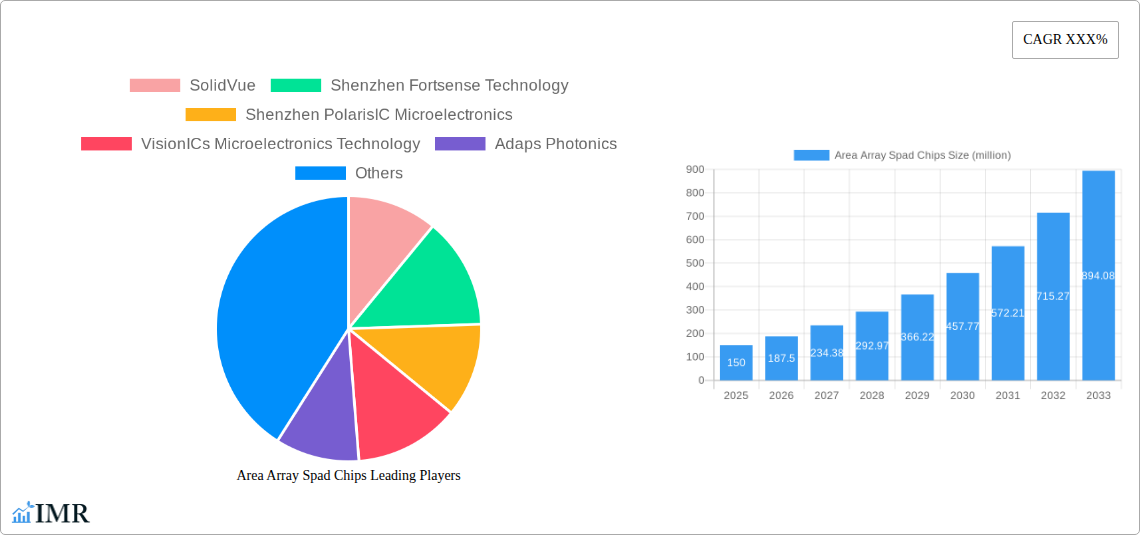
The Area Array SPAD (Single-Photon Avalanche Diode) chip market is experiencing robust growth, driven by increasing demand across diverse sectors. The market's expansion is fueled primarily by advancements in automotive LiDAR (Light Detection and Ranging) systems, where high-resolution 3D imaging is crucial for autonomous driving capabilities. Furthermore, the rising adoption of SPAD technology in medical imaging, particularly in fluorescence lifetime imaging microscopy (FLIM) and time-of-flight (ToF) applications, contributes significantly to market growth. Other emerging applications, including augmented reality (AR) and virtual reality (VR) devices, are also pushing the demand for higher-performance and more compact SPAD chips. The market is characterized by a competitive landscape with key players such as SolidVue, Shenzhen Fortsense Technology, and others focusing on innovation in chip design and manufacturing processes to meet these increasing demands. This leads to a continuous improvement in SPAD chip performance parameters like sensitivity, resolution, and integration density, driving down costs and further expanding market accessibility.
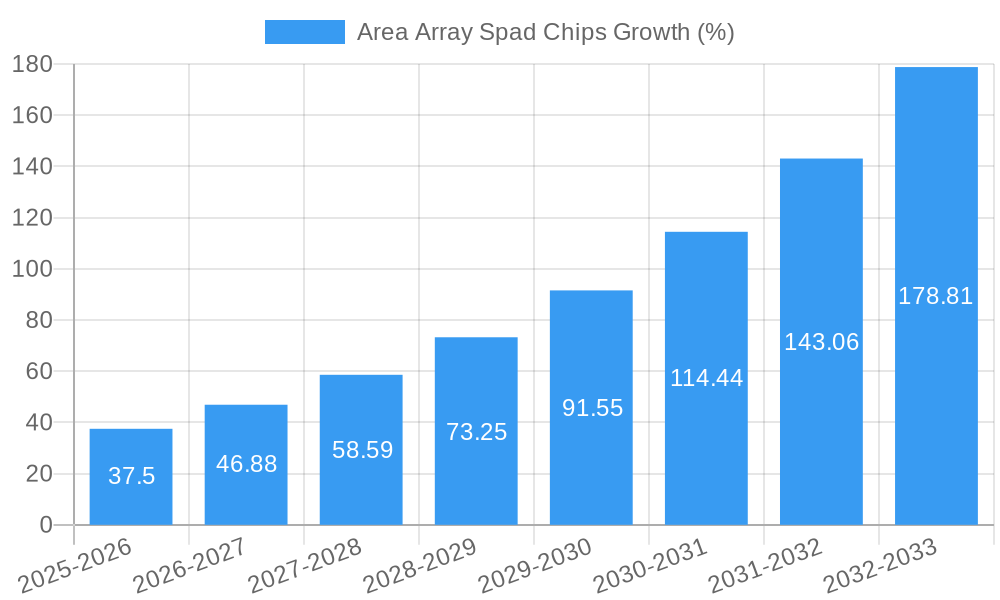
We project a Compound Annual Growth Rate (CAGR) of 25% for the Area Array SPAD chip market between 2025 and 2033, indicating substantial market expansion. This growth is anticipated despite certain restraints, such as the relatively high cost of manufacturing these sophisticated chips and the need for specialized expertise in their integration within end-products. However, ongoing technological advancements are continually addressing these challenges, leading to a reduction in manufacturing costs and simplifying integration procedures. This positive trend, coupled with increasing venture capital investments in the sector, assures continued market growth in the coming years. The market is segmented by application (LiDAR, medical imaging, AR/VR, etc.), chip type, and region, each exhibiting unique growth trajectories influenced by factors specific to their respective sectors. This segmented analysis is crucial for businesses aiming to strategically enter or grow within this rapidly expanding market.
Area Array Spad Chips Market Report: 2019-2033
This comprehensive report provides an in-depth analysis of the Area Array Spad Chips market, encompassing market dynamics, growth trends, regional segmentation, product landscape, key players, and future outlook. The study period covers 2019-2033, with 2025 as the base year and estimated year. The forecast period spans 2025-2033, and the historical period covers 2019-2024. This report is crucial for businesses operating within the broader photonics and semiconductor industries, specifically those involved in the design, manufacturing, and application of advanced imaging and sensing technologies.
Area Array Spad Chips Market Dynamics & Structure
The Area Array Spad Chips market is experiencing significant growth driven by technological advancements, increasing demand from diverse applications, and strategic mergers and acquisitions (M&A). Market concentration is currently moderate, with several key players vying for market share. However, consolidation is expected as larger companies acquire smaller, specialized firms. Innovation within this sector is rapid, fueled by the need for higher sensitivity, faster response times, and smaller form factors. Regulatory frameworks, particularly those related to safety and data privacy in applications like automotive LiDAR and medical imaging, are increasingly shaping market dynamics. Competitive substitutes include traditional photodetectors, but Spad technology offers superior performance advantages in specific niches. End-users span diverse sectors including automotive, healthcare, industrial automation, and consumer electronics. M&A activity has been brisk in recent years, with an estimated xx million USD worth of deals concluded during the historical period (2019-2024), reflecting increasing industry consolidation.
- Market Concentration: Moderate, trending towards consolidation.
- Technological Innovation: Focus on improved sensitivity, resolution, and integration.
- Regulatory Landscape: Increasingly stringent regulations impacting various applications.
- Competitive Substitutes: Traditional photodetectors, but Spad offers superior performance.
- End-User Demographics: Automotive, Healthcare, Industrial Automation, Consumer Electronics are key segments.
- M&A Activity: xx million USD in deals (2019-2024), indicating industry consolidation.
Area Array Spad Chips Growth Trends & Insights
The Area Array Spad Chips market exhibits a robust Compound Annual Growth Rate (CAGR) of xx% during the forecast period (2025-2033), driven by several factors. Market size is projected to reach xx million units by 2033 from xx million units in 2025. This growth is fueled by rising adoption rates across various applications, particularly in automotive LiDAR systems for autonomous driving and advanced driver-assistance systems (ADAS). Technological disruptions, such as the development of higher-performance Spad arrays with improved signal processing capabilities, are accelerating market expansion. Consumer behavior shifts toward increased demand for safer and more efficient vehicles and advanced medical imaging technologies are further bolstering market growth. Market penetration is currently relatively low, but is expected to increase significantly in the coming years, driven by decreasing costs and technological improvements.
Dominant Regions, Countries, or Segments in Area Array Spad Chips
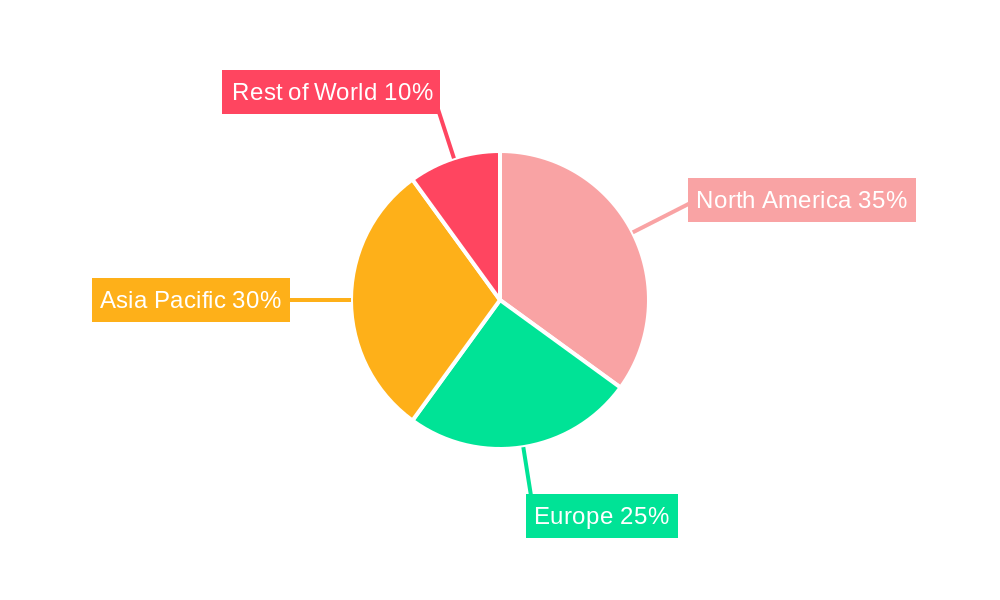
The North American region currently dominates the Area Array Spad Chips market, holding a market share of approximately xx%, followed by Asia-Pacific at xx%. This dominance is primarily attributed to substantial investments in R&D, strong presence of major technology companies, and early adoption of Spad technology in various sectors. However, the Asia-Pacific region is poised for significant growth, driven by expanding industrial automation and increasing government initiatives promoting technological advancements in the automotive and healthcare sectors. Europe is expected to witness steady growth, driven by the development of sophisticated imaging and sensing technologies.
- North America: High market share driven by strong R&D and early adoption.
- Asia-Pacific: Fastest-growing region due to expanding industrial automation and government initiatives.
- Europe: Steady growth, driven by technological advancements in key sectors.
Area Array Spad Chips Product Landscape
Area Array Spad chips are characterized by advancements in pixel density, sensitivity, and integration with signal processing circuits. These improvements enable higher resolution imaging, faster data acquisition rates, and reduced power consumption. Unique selling propositions include superior performance in low-light conditions, single-photon sensitivity, and compact form factors. Key applications include time-of-flight (ToF) ranging, LiDAR, fluorescence lifetime imaging microscopy (FLIM), and other advanced imaging applications. Technological advancements focus on enhancing chip integration, reducing cost, and improving performance metrics like dynamic range and temporal resolution.
Key Drivers, Barriers & Challenges in Area Array Spad Chips
Key Drivers: The key drivers for market growth include the increasing demand for advanced imaging and sensing technologies in various sectors such as automotive, healthcare, and industrial automation. Moreover, continuous technological advancements leading to higher sensitivity, faster response times, and lower cost are bolstering market growth. Government initiatives and funding for research and development also play a crucial role in driving innovation.
Key Challenges: High manufacturing costs, complex integration processes, and supply chain disruptions pose significant challenges to market growth. Furthermore, regulatory hurdles related to safety and data privacy in certain applications can impede market penetration. Intense competition from established players and emerging technologies also constitutes a considerable challenge.
Emerging Opportunities in Area Array Spad Chips
Emerging opportunities include penetration into untapped markets such as consumer electronics (e.g., improved smartphone cameras) and environmental monitoring. Innovative applications like high-speed 3D imaging, enhanced security systems, and advanced spectroscopy are also promising areas of growth. The development of new packaging technologies and integration with other components, such as micro-optics, presents significant opportunities for expanding market reach and improving device performance.
Growth Accelerators in the Area Array Spad Chips Industry
Technological breakthroughs, such as the development of high-performance Spad arrays with improved signal processing capabilities, are set to drive long-term growth. Strategic partnerships between chip manufacturers, system integrators, and end-users will further fuel market expansion. Market expansion strategies, such as focusing on emerging applications and geographical regions, will also contribute to growth.
Key Players Shaping the Area Array Spad Chips Market
- SolidVue
- Shenzhen Fortsense Technology
- Shenzhen PolarisIC Microelectronics
- VisionICs Microelectronics Technology
- Adaps Photonics
- Sophoton
- Hangzhou Microparity
Notable Milestones in Area Array Spad Chips Sector
- 2021, Q3: SolidVue announces a new generation of high-resolution Spad arrays.
- 2022, Q1: Shenzhen Fortsense Technology partners with a major automotive OEM for LiDAR integration.
- 2023, Q2: A significant M&A deal involving two leading Spad manufacturers reshapes market dynamics.
In-Depth Area Array Spad Chips Market Outlook
The Area Array Spad Chips market is poised for continued strong growth, driven by technological advancements and increasing demand across various sectors. Strategic opportunities exist in developing specialized chips for niche applications, exploring new market segments, and establishing strategic partnerships to accelerate market penetration. The integration of Spad technology with other complementary technologies will be a key driver of future growth and innovation.
Area Array Spad Chips Segmentation
-
1. Application
- 1.1. 3D Ranging
- 1.2. Automotive Electronics
- 1.3. Medical Imaging
- 1.4. Others
-
2. Type
- 2.1. Large Area Array
- 2.2. Mini Area Array
Area Array Spad Chips Segmentation By Geography
-
1. North America
- 1.1. United States
- 1.2. Canada
- 1.3. Mexico
-
2. South America
- 2.1. Brazil
- 2.2. Argentina
- 2.3. Rest of South America
-
3. Europe
- 3.1. United Kingdom
- 3.2. Germany
- 3.3. France
- 3.4. Italy
- 3.5. Spain
- 3.6. Russia
- 3.7. Benelux
- 3.8. Nordics
- 3.9. Rest of Europe
-
4. Middle East & Africa
- 4.1. Turkey
- 4.2. Israel
- 4.3. GCC
- 4.4. North Africa
- 4.5. South Africa
- 4.6. Rest of Middle East & Africa
-
5. Asia Pacific
- 5.1. China
- 5.2. India
- 5.3. Japan
- 5.4. South Korea
- 5.5. ASEAN
- 5.6. Oceania
- 5.7. Rest of Asia Pacific
Area Array Spad Chips REPORT HIGHLIGHTS
| Aspects | Details |
|---|---|
| Study Period | 2019-2033 |
| Base Year | 2024 |
| Estimated Year | 2025 |
| Forecast Period | 2025-2033 |
| Historical Period | 2019-2024 |
| Growth Rate | CAGR of XXX% from 2019-2033 |
| Segmentation |
|
Table of Contents
- 1. Introduction
- 1.1. Research Scope
- 1.2. Market Segmentation
- 1.3. Research Methodology
- 1.4. Definitions and Assumptions
- 2. Executive Summary
- 2.1. Introduction
- 3. Market Dynamics
- 3.1. Introduction
- 3.2. Market Drivers
- 3.3. Market Restrains
- 3.4. Market Trends
- 4. Market Factor Analysis
- 4.1. Porters Five Forces
- 4.2. Supply/Value Chain
- 4.3. PESTEL analysis
- 4.4. Market Entropy
- 4.5. Patent/Trademark Analysis
- 5. Global Area Array Spad Chips Analysis, Insights and Forecast, 2019-2031
- 5.1. Market Analysis, Insights and Forecast - by Application
- 5.1.1. 3D Ranging
- 5.1.2. Automotive Electronics
- 5.1.3. Medical Imaging
- 5.1.4. Others
- 5.2. Market Analysis, Insights and Forecast - by Type
- 5.2.1. Large Area Array
- 5.2.2. Mini Area Array
- 5.3. Market Analysis, Insights and Forecast - by Region
- 5.3.1. North America
- 5.3.2. South America
- 5.3.3. Europe
- 5.3.4. Middle East & Africa
- 5.3.5. Asia Pacific
- 5.1. Market Analysis, Insights and Forecast - by Application
- 6. North America Area Array Spad Chips Analysis, Insights and Forecast, 2019-2031
- 6.1. Market Analysis, Insights and Forecast - by Application
- 6.1.1. 3D Ranging
- 6.1.2. Automotive Electronics
- 6.1.3. Medical Imaging
- 6.1.4. Others
- 6.2. Market Analysis, Insights and Forecast - by Type
- 6.2.1. Large Area Array
- 6.2.2. Mini Area Array
- 6.1. Market Analysis, Insights and Forecast - by Application
- 7. South America Area Array Spad Chips Analysis, Insights and Forecast, 2019-2031
- 7.1. Market Analysis, Insights and Forecast - by Application
- 7.1.1. 3D Ranging
- 7.1.2. Automotive Electronics
- 7.1.3. Medical Imaging
- 7.1.4. Others
- 7.2. Market Analysis, Insights and Forecast - by Type
- 7.2.1. Large Area Array
- 7.2.2. Mini Area Array
- 7.1. Market Analysis, Insights and Forecast - by Application
- 8. Europe Area Array Spad Chips Analysis, Insights and Forecast, 2019-2031
- 8.1. Market Analysis, Insights and Forecast - by Application
- 8.1.1. 3D Ranging
- 8.1.2. Automotive Electronics
- 8.1.3. Medical Imaging
- 8.1.4. Others
- 8.2. Market Analysis, Insights and Forecast - by Type
- 8.2.1. Large Area Array
- 8.2.2. Mini Area Array
- 8.1. Market Analysis, Insights and Forecast - by Application
- 9. Middle East & Africa Area Array Spad Chips Analysis, Insights and Forecast, 2019-2031
- 9.1. Market Analysis, Insights and Forecast - by Application
- 9.1.1. 3D Ranging
- 9.1.2. Automotive Electronics
- 9.1.3. Medical Imaging
- 9.1.4. Others
- 9.2. Market Analysis, Insights and Forecast - by Type
- 9.2.1. Large Area Array
- 9.2.2. Mini Area Array
- 9.1. Market Analysis, Insights and Forecast - by Application
- 10. Asia Pacific Area Array Spad Chips Analysis, Insights and Forecast, 2019-2031
- 10.1. Market Analysis, Insights and Forecast - by Application
- 10.1.1. 3D Ranging
- 10.1.2. Automotive Electronics
- 10.1.3. Medical Imaging
- 10.1.4. Others
- 10.2. Market Analysis, Insights and Forecast - by Type
- 10.2.1. Large Area Array
- 10.2.2. Mini Area Array
- 10.1. Market Analysis, Insights and Forecast - by Application
- 11. Competitive Analysis
- 11.1. Global Market Share Analysis 2024
- 11.2. Company Profiles
- 11.2.1 SolidVue
- 11.2.1.1. Overview
- 11.2.1.2. Products
- 11.2.1.3. SWOT Analysis
- 11.2.1.4. Recent Developments
- 11.2.1.5. Financials (Based on Availability)
- 11.2.2 Shenzhen Fortsense Technology
- 11.2.2.1. Overview
- 11.2.2.2. Products
- 11.2.2.3. SWOT Analysis
- 11.2.2.4. Recent Developments
- 11.2.2.5. Financials (Based on Availability)
- 11.2.3 Shenzhen PolarisIC Microelectronics
- 11.2.3.1. Overview
- 11.2.3.2. Products
- 11.2.3.3. SWOT Analysis
- 11.2.3.4. Recent Developments
- 11.2.3.5. Financials (Based on Availability)
- 11.2.4 VisionICs Microelectronics Technology
- 11.2.4.1. Overview
- 11.2.4.2. Products
- 11.2.4.3. SWOT Analysis
- 11.2.4.4. Recent Developments
- 11.2.4.5. Financials (Based on Availability)
- 11.2.5 Adaps Photonics
- 11.2.5.1. Overview
- 11.2.5.2. Products
- 11.2.5.3. SWOT Analysis
- 11.2.5.4. Recent Developments
- 11.2.5.5. Financials (Based on Availability)
- 11.2.6 Sophoton
- 11.2.6.1. Overview
- 11.2.6.2. Products
- 11.2.6.3. SWOT Analysis
- 11.2.6.4. Recent Developments
- 11.2.6.5. Financials (Based on Availability)
- 11.2.7 Hangzhou Microparity
- 11.2.7.1. Overview
- 11.2.7.2. Products
- 11.2.7.3. SWOT Analysis
- 11.2.7.4. Recent Developments
- 11.2.7.5. Financials (Based on Availability)
- 11.2.1 SolidVue
List of Figures
- Figure 1: Global Area Array Spad Chips Revenue Breakdown (million, %) by Region 2024 & 2032
- Figure 2: Global Area Array Spad Chips Volume Breakdown (K, %) by Region 2024 & 2032
- Figure 3: North America Area Array Spad Chips Revenue (million), by Application 2024 & 2032
- Figure 4: North America Area Array Spad Chips Volume (K), by Application 2024 & 2032
- Figure 5: North America Area Array Spad Chips Revenue Share (%), by Application 2024 & 2032
- Figure 6: North America Area Array Spad Chips Volume Share (%), by Application 2024 & 2032
- Figure 7: North America Area Array Spad Chips Revenue (million), by Type 2024 & 2032
- Figure 8: North America Area Array Spad Chips Volume (K), by Type 2024 & 2032
- Figure 9: North America Area Array Spad Chips Revenue Share (%), by Type 2024 & 2032
- Figure 10: North America Area Array Spad Chips Volume Share (%), by Type 2024 & 2032
- Figure 11: North America Area Array Spad Chips Revenue (million), by Country 2024 & 2032
- Figure 12: North America Area Array Spad Chips Volume (K), by Country 2024 & 2032
- Figure 13: North America Area Array Spad Chips Revenue Share (%), by Country 2024 & 2032
- Figure 14: North America Area Array Spad Chips Volume Share (%), by Country 2024 & 2032
- Figure 15: South America Area Array Spad Chips Revenue (million), by Application 2024 & 2032
- Figure 16: South America Area Array Spad Chips Volume (K), by Application 2024 & 2032
- Figure 17: South America Area Array Spad Chips Revenue Share (%), by Application 2024 & 2032
- Figure 18: South America Area Array Spad Chips Volume Share (%), by Application 2024 & 2032
- Figure 19: South America Area Array Spad Chips Revenue (million), by Type 2024 & 2032
- Figure 20: South America Area Array Spad Chips Volume (K), by Type 2024 & 2032
- Figure 21: South America Area Array Spad Chips Revenue Share (%), by Type 2024 & 2032
- Figure 22: South America Area Array Spad Chips Volume Share (%), by Type 2024 & 2032
- Figure 23: South America Area Array Spad Chips Revenue (million), by Country 2024 & 2032
- Figure 24: South America Area Array Spad Chips Volume (K), by Country 2024 & 2032
- Figure 25: South America Area Array Spad Chips Revenue Share (%), by Country 2024 & 2032
- Figure 26: South America Area Array Spad Chips Volume Share (%), by Country 2024 & 2032
- Figure 27: Europe Area Array Spad Chips Revenue (million), by Application 2024 & 2032
- Figure 28: Europe Area Array Spad Chips Volume (K), by Application 2024 & 2032
- Figure 29: Europe Area Array Spad Chips Revenue Share (%), by Application 2024 & 2032
- Figure 30: Europe Area Array Spad Chips Volume Share (%), by Application 2024 & 2032
- Figure 31: Europe Area Array Spad Chips Revenue (million), by Type 2024 & 2032
- Figure 32: Europe Area Array Spad Chips Volume (K), by Type 2024 & 2032
- Figure 33: Europe Area Array Spad Chips Revenue Share (%), by Type 2024 & 2032
- Figure 34: Europe Area Array Spad Chips Volume Share (%), by Type 2024 & 2032
- Figure 35: Europe Area Array Spad Chips Revenue (million), by Country 2024 & 2032
- Figure 36: Europe Area Array Spad Chips Volume (K), by Country 2024 & 2032
- Figure 37: Europe Area Array Spad Chips Revenue Share (%), by Country 2024 & 2032
- Figure 38: Europe Area Array Spad Chips Volume Share (%), by Country 2024 & 2032
- Figure 39: Middle East & Africa Area Array Spad Chips Revenue (million), by Application 2024 & 2032
- Figure 40: Middle East & Africa Area Array Spad Chips Volume (K), by Application 2024 & 2032
- Figure 41: Middle East & Africa Area Array Spad Chips Revenue Share (%), by Application 2024 & 2032
- Figure 42: Middle East & Africa Area Array Spad Chips Volume Share (%), by Application 2024 & 2032
- Figure 43: Middle East & Africa Area Array Spad Chips Revenue (million), by Type 2024 & 2032
- Figure 44: Middle East & Africa Area Array Spad Chips Volume (K), by Type 2024 & 2032
- Figure 45: Middle East & Africa Area Array Spad Chips Revenue Share (%), by Type 2024 & 2032
- Figure 46: Middle East & Africa Area Array Spad Chips Volume Share (%), by Type 2024 & 2032
- Figure 47: Middle East & Africa Area Array Spad Chips Revenue (million), by Country 2024 & 2032
- Figure 48: Middle East & Africa Area Array Spad Chips Volume (K), by Country 2024 & 2032
- Figure 49: Middle East & Africa Area Array Spad Chips Revenue Share (%), by Country 2024 & 2032
- Figure 50: Middle East & Africa Area Array Spad Chips Volume Share (%), by Country 2024 & 2032
- Figure 51: Asia Pacific Area Array Spad Chips Revenue (million), by Application 2024 & 2032
- Figure 52: Asia Pacific Area Array Spad Chips Volume (K), by Application 2024 & 2032
- Figure 53: Asia Pacific Area Array Spad Chips Revenue Share (%), by Application 2024 & 2032
- Figure 54: Asia Pacific Area Array Spad Chips Volume Share (%), by Application 2024 & 2032
- Figure 55: Asia Pacific Area Array Spad Chips Revenue (million), by Type 2024 & 2032
- Figure 56: Asia Pacific Area Array Spad Chips Volume (K), by Type 2024 & 2032
- Figure 57: Asia Pacific Area Array Spad Chips Revenue Share (%), by Type 2024 & 2032
- Figure 58: Asia Pacific Area Array Spad Chips Volume Share (%), by Type 2024 & 2032
- Figure 59: Asia Pacific Area Array Spad Chips Revenue (million), by Country 2024 & 2032
- Figure 60: Asia Pacific Area Array Spad Chips Volume (K), by Country 2024 & 2032
- Figure 61: Asia Pacific Area Array Spad Chips Revenue Share (%), by Country 2024 & 2032
- Figure 62: Asia Pacific Area Array Spad Chips Volume Share (%), by Country 2024 & 2032
List of Tables
- Table 1: Global Area Array Spad Chips Revenue million Forecast, by Region 2019 & 2032
- Table 2: Global Area Array Spad Chips Volume K Forecast, by Region 2019 & 2032
- Table 3: Global Area Array Spad Chips Revenue million Forecast, by Application 2019 & 2032
- Table 4: Global Area Array Spad Chips Volume K Forecast, by Application 2019 & 2032
- Table 5: Global Area Array Spad Chips Revenue million Forecast, by Type 2019 & 2032
- Table 6: Global Area Array Spad Chips Volume K Forecast, by Type 2019 & 2032
- Table 7: Global Area Array Spad Chips Revenue million Forecast, by Region 2019 & 2032
- Table 8: Global Area Array Spad Chips Volume K Forecast, by Region 2019 & 2032
- Table 9: Global Area Array Spad Chips Revenue million Forecast, by Application 2019 & 2032
- Table 10: Global Area Array Spad Chips Volume K Forecast, by Application 2019 & 2032
- Table 11: Global Area Array Spad Chips Revenue million Forecast, by Type 2019 & 2032
- Table 12: Global Area Array Spad Chips Volume K Forecast, by Type 2019 & 2032
- Table 13: Global Area Array Spad Chips Revenue million Forecast, by Country 2019 & 2032
- Table 14: Global Area Array Spad Chips Volume K Forecast, by Country 2019 & 2032
- Table 15: United States Area Array Spad Chips Revenue (million) Forecast, by Application 2019 & 2032
- Table 16: United States Area Array Spad Chips Volume (K) Forecast, by Application 2019 & 2032
- Table 17: Canada Area Array Spad Chips Revenue (million) Forecast, by Application 2019 & 2032
- Table 18: Canada Area Array Spad Chips Volume (K) Forecast, by Application 2019 & 2032
- Table 19: Mexico Area Array Spad Chips Revenue (million) Forecast, by Application 2019 & 2032
- Table 20: Mexico Area Array Spad Chips Volume (K) Forecast, by Application 2019 & 2032
- Table 21: Global Area Array Spad Chips Revenue million Forecast, by Application 2019 & 2032
- Table 22: Global Area Array Spad Chips Volume K Forecast, by Application 2019 & 2032
- Table 23: Global Area Array Spad Chips Revenue million Forecast, by Type 2019 & 2032
- Table 24: Global Area Array Spad Chips Volume K Forecast, by Type 2019 & 2032
- Table 25: Global Area Array Spad Chips Revenue million Forecast, by Country 2019 & 2032
- Table 26: Global Area Array Spad Chips Volume K Forecast, by Country 2019 & 2032
- Table 27: Brazil Area Array Spad Chips Revenue (million) Forecast, by Application 2019 & 2032
- Table 28: Brazil Area Array Spad Chips Volume (K) Forecast, by Application 2019 & 2032
- Table 29: Argentina Area Array Spad Chips Revenue (million) Forecast, by Application 2019 & 2032
- Table 30: Argentina Area Array Spad Chips Volume (K) Forecast, by Application 2019 & 2032
- Table 31: Rest of South America Area Array Spad Chips Revenue (million) Forecast, by Application 2019 & 2032
- Table 32: Rest of South America Area Array Spad Chips Volume (K) Forecast, by Application 2019 & 2032
- Table 33: Global Area Array Spad Chips Revenue million Forecast, by Application 2019 & 2032
- Table 34: Global Area Array Spad Chips Volume K Forecast, by Application 2019 & 2032
- Table 35: Global Area Array Spad Chips Revenue million Forecast, by Type 2019 & 2032
- Table 36: Global Area Array Spad Chips Volume K Forecast, by Type 2019 & 2032
- Table 37: Global Area Array Spad Chips Revenue million Forecast, by Country 2019 & 2032
- Table 38: Global Area Array Spad Chips Volume K Forecast, by Country 2019 & 2032
- Table 39: United Kingdom Area Array Spad Chips Revenue (million) Forecast, by Application 2019 & 2032
- Table 40: United Kingdom Area Array Spad Chips Volume (K) Forecast, by Application 2019 & 2032
- Table 41: Germany Area Array Spad Chips Revenue (million) Forecast, by Application 2019 & 2032
- Table 42: Germany Area Array Spad Chips Volume (K) Forecast, by Application 2019 & 2032
- Table 43: France Area Array Spad Chips Revenue (million) Forecast, by Application 2019 & 2032
- Table 44: France Area Array Spad Chips Volume (K) Forecast, by Application 2019 & 2032
- Table 45: Italy Area Array Spad Chips Revenue (million) Forecast, by Application 2019 & 2032
- Table 46: Italy Area Array Spad Chips Volume (K) Forecast, by Application 2019 & 2032
- Table 47: Spain Area Array Spad Chips Revenue (million) Forecast, by Application 2019 & 2032
- Table 48: Spain Area Array Spad Chips Volume (K) Forecast, by Application 2019 & 2032
- Table 49: Russia Area Array Spad Chips Revenue (million) Forecast, by Application 2019 & 2032
- Table 50: Russia Area Array Spad Chips Volume (K) Forecast, by Application 2019 & 2032
- Table 51: Benelux Area Array Spad Chips Revenue (million) Forecast, by Application 2019 & 2032
- Table 52: Benelux Area Array Spad Chips Volume (K) Forecast, by Application 2019 & 2032
- Table 53: Nordics Area Array Spad Chips Revenue (million) Forecast, by Application 2019 & 2032
- Table 54: Nordics Area Array Spad Chips Volume (K) Forecast, by Application 2019 & 2032
- Table 55: Rest of Europe Area Array Spad Chips Revenue (million) Forecast, by Application 2019 & 2032
- Table 56: Rest of Europe Area Array Spad Chips Volume (K) Forecast, by Application 2019 & 2032
- Table 57: Global Area Array Spad Chips Revenue million Forecast, by Application 2019 & 2032
- Table 58: Global Area Array Spad Chips Volume K Forecast, by Application 2019 & 2032
- Table 59: Global Area Array Spad Chips Revenue million Forecast, by Type 2019 & 2032
- Table 60: Global Area Array Spad Chips Volume K Forecast, by Type 2019 & 2032
- Table 61: Global Area Array Spad Chips Revenue million Forecast, by Country 2019 & 2032
- Table 62: Global Area Array Spad Chips Volume K Forecast, by Country 2019 & 2032
- Table 63: Turkey Area Array Spad Chips Revenue (million) Forecast, by Application 2019 & 2032
- Table 64: Turkey Area Array Spad Chips Volume (K) Forecast, by Application 2019 & 2032
- Table 65: Israel Area Array Spad Chips Revenue (million) Forecast, by Application 2019 & 2032
- Table 66: Israel Area Array Spad Chips Volume (K) Forecast, by Application 2019 & 2032
- Table 67: GCC Area Array Spad Chips Revenue (million) Forecast, by Application 2019 & 2032
- Table 68: GCC Area Array Spad Chips Volume (K) Forecast, by Application 2019 & 2032
- Table 69: North Africa Area Array Spad Chips Revenue (million) Forecast, by Application 2019 & 2032
- Table 70: North Africa Area Array Spad Chips Volume (K) Forecast, by Application 2019 & 2032
- Table 71: South Africa Area Array Spad Chips Revenue (million) Forecast, by Application 2019 & 2032
- Table 72: South Africa Area Array Spad Chips Volume (K) Forecast, by Application 2019 & 2032
- Table 73: Rest of Middle East & Africa Area Array Spad Chips Revenue (million) Forecast, by Application 2019 & 2032
- Table 74: Rest of Middle East & Africa Area Array Spad Chips Volume (K) Forecast, by Application 2019 & 2032
- Table 75: Global Area Array Spad Chips Revenue million Forecast, by Application 2019 & 2032
- Table 76: Global Area Array Spad Chips Volume K Forecast, by Application 2019 & 2032
- Table 77: Global Area Array Spad Chips Revenue million Forecast, by Type 2019 & 2032
- Table 78: Global Area Array Spad Chips Volume K Forecast, by Type 2019 & 2032
- Table 79: Global Area Array Spad Chips Revenue million Forecast, by Country 2019 & 2032
- Table 80: Global Area Array Spad Chips Volume K Forecast, by Country 2019 & 2032
- Table 81: China Area Array Spad Chips Revenue (million) Forecast, by Application 2019 & 2032
- Table 82: China Area Array Spad Chips Volume (K) Forecast, by Application 2019 & 2032
- Table 83: India Area Array Spad Chips Revenue (million) Forecast, by Application 2019 & 2032
- Table 84: India Area Array Spad Chips Volume (K) Forecast, by Application 2019 & 2032
- Table 85: Japan Area Array Spad Chips Revenue (million) Forecast, by Application 2019 & 2032
- Table 86: Japan Area Array Spad Chips Volume (K) Forecast, by Application 2019 & 2032
- Table 87: South Korea Area Array Spad Chips Revenue (million) Forecast, by Application 2019 & 2032
- Table 88: South Korea Area Array Spad Chips Volume (K) Forecast, by Application 2019 & 2032
- Table 89: ASEAN Area Array Spad Chips Revenue (million) Forecast, by Application 2019 & 2032
- Table 90: ASEAN Area Array Spad Chips Volume (K) Forecast, by Application 2019 & 2032
- Table 91: Oceania Area Array Spad Chips Revenue (million) Forecast, by Application 2019 & 2032
- Table 92: Oceania Area Array Spad Chips Volume (K) Forecast, by Application 2019 & 2032
- Table 93: Rest of Asia Pacific Area Array Spad Chips Revenue (million) Forecast, by Application 2019 & 2032
- Table 94: Rest of Asia Pacific Area Array Spad Chips Volume (K) Forecast, by Application 2019 & 2032
Frequently Asked Questions
1. What is the projected Compound Annual Growth Rate (CAGR) of the Area Array Spad Chips?
The projected CAGR is approximately XXX%.
2. Which companies are prominent players in the Area Array Spad Chips?
Key companies in the market include SolidVue, Shenzhen Fortsense Technology, Shenzhen PolarisIC Microelectronics, VisionICs Microelectronics Technology, Adaps Photonics, Sophoton, Hangzhou Microparity.
3. What are the main segments of the Area Array Spad Chips?
The market segments include Application, Type.
4. Can you provide details about the market size?
The market size is estimated to be USD XXX million as of 2022.
5. What are some drivers contributing to market growth?
N/A
6. What are the notable trends driving market growth?
N/A
7. Are there any restraints impacting market growth?
N/A
8. Can you provide examples of recent developments in the market?
N/A
9. What pricing options are available for accessing the report?
Pricing options include single-user, multi-user, and enterprise licenses priced at USD 3950.00, USD 5925.00, and USD 7900.00 respectively.
10. Is the market size provided in terms of value or volume?
The market size is provided in terms of value, measured in million and volume, measured in K.
11. Are there any specific market keywords associated with the report?
Yes, the market keyword associated with the report is "Area Array Spad Chips," which aids in identifying and referencing the specific market segment covered.
12. How do I determine which pricing option suits my needs best?
The pricing options vary based on user requirements and access needs. Individual users may opt for single-user licenses, while businesses requiring broader access may choose multi-user or enterprise licenses for cost-effective access to the report.
13. Are there any additional resources or data provided in the Area Array Spad Chips report?
While the report offers comprehensive insights, it's advisable to review the specific contents or supplementary materials provided to ascertain if additional resources or data are available.
14. How can I stay updated on further developments or reports in the Area Array Spad Chips?
To stay informed about further developments, trends, and reports in the Area Array Spad Chips, consider subscribing to industry newsletters, following relevant companies and organizations, or regularly checking reputable industry news sources and publications.
Methodology
Step 1 - Identification of Relevant Samples Size from Population Database


Step 2 - Approaches for Defining Global Market Size (Value, Volume* & Price*)

Note*: In applicable scenarios
Step 3 - Data Sources
Primary Research
- Web Analytics
- Survey Reports
- Research Institute
- Latest Research Reports
- Opinion Leaders
Secondary Research
- Annual Reports
- White Paper
- Latest Press Release
- Industry Association
- Paid Database
- Investor Presentations

Step 4 - Data Triangulation
Involves using different sources of information in order to increase the validity of a study
These sources are likely to be stakeholders in a program - participants, other researchers, program staff, other community members, and so on.
Then we put all data in single framework & apply various statistical tools to find out the dynamic on the market.
During the analysis stage, feedback from the stakeholder groups would be compared to determine areas of agreement as well as areas of divergence
