

Key Insights
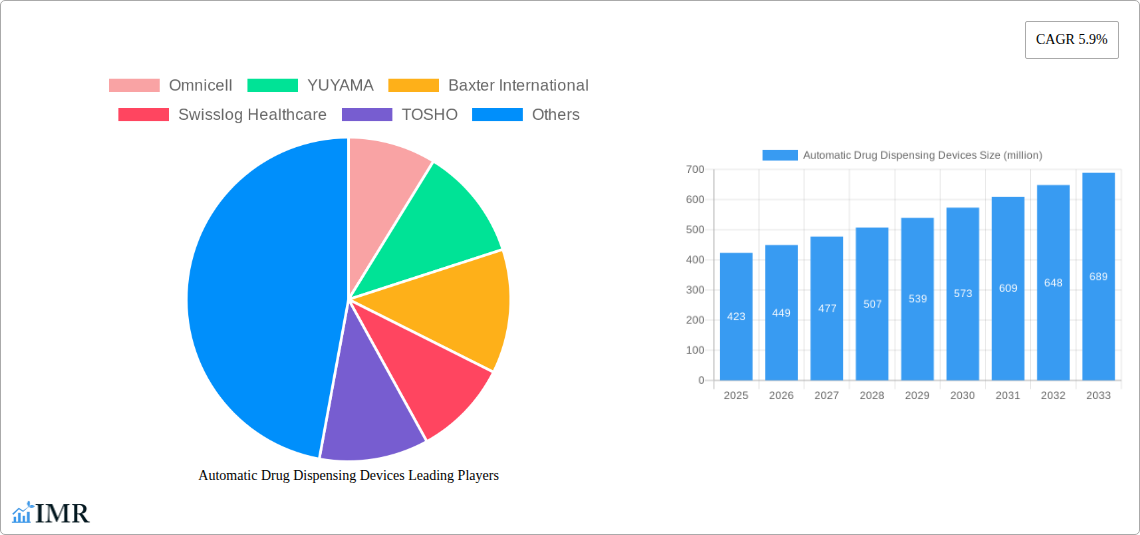
The global market for Automatic Drug Dispensing Devices (ADDDs) is experiencing robust growth, projected to reach \$423 million in 2025 and maintain a Compound Annual Growth Rate (CAGR) of 5.9% from 2025 to 2033. This expansion is driven by several key factors. The increasing prevalence of chronic diseases necessitates efficient medication management, fueling demand for ADDDs in hospitals, pharmacies, and long-term care facilities. Furthermore, the rising adoption of electronic health records (EHRs) and the integration of ADDDs into these systems enhances medication safety and reduces medication errors, a significant driver of market growth. Automation streamlines workflows, improves operational efficiency, and reduces labor costs, making ADDDs an attractive investment for healthcare providers. Technological advancements, such as the incorporation of artificial intelligence (AI) for inventory management and medication reconciliation, further contribute to the market's expansion. Regulatory support encouraging the adoption of technologically advanced medication dispensing systems also plays a crucial role.
The competitive landscape is characterized by a mix of established global players like Omnicell, Baxter International, and Swisslog Healthcare, alongside several regional manufacturers in Asia, notably those based in China. Competition is primarily driven by innovation in technology, service offerings, and pricing strategies. While market entry barriers are relatively high due to regulatory compliance and technological expertise, the continuous influx of innovative solutions and increasing demand creates opportunities for both established players and new entrants. Future growth is likely to be influenced by factors such as healthcare spending, technological breakthroughs in ADDD technology, and the evolving regulatory environment across different regions. The market is segmented by device type (e.g., automated dispensing cabinets, carousel systems), end-user (hospitals, pharmacies), and geography, offering targeted growth opportunities for players focusing on niche segments.
Automatic Drug Dispensing Devices Market Report: 2019-2033
This comprehensive report provides an in-depth analysis of the global Automatic Drug Dispensing Devices market, encompassing market dynamics, growth trends, regional performance, competitive landscape, and future outlook. The study period covers 2019-2033, with 2025 as the base and estimated year. The report is crucial for pharmaceutical companies, healthcare providers, investors, and technology developers seeking to understand and capitalize on this rapidly evolving market. The parent market is the healthcare technology sector, and the child market is automated pharmacy systems.
Estimated Market Size (Million Units): xx (2025)
Projected Market Size (Million Units): xx (2033)
Automatic Drug Dispensing Devices Market Dynamics & Structure
This section analyzes the market's competitive intensity, technological advancements, regulatory landscape, substitute products, end-user demographics, and mergers & acquisitions (M&A) activities. The market is characterized by a mix of established players and emerging companies, leading to a moderately concentrated structure. Technological innovation is a key driver, with continuous advancements in automation, robotics, and software integration improving efficiency and safety. Stringent regulatory frameworks influence product development and market access.
- Market Concentration: Moderately concentrated, with top 5 players holding approximately xx% market share (2025).
- Technological Innovation: Focus on AI-driven medication management, improved inventory control, and enhanced security features.
- Regulatory Framework: Stringent FDA and other global regulatory approvals impacting market entry and product lifecycle.
- Competitive Substitutes: Manual dispensing systems, but with declining market share due to automation benefits.
- End-User Demographics: Primarily hospitals, pharmacies, and long-term care facilities. Growth is driven by increasing demand in ambulatory care settings.
- M&A Trends: xx M&A deals recorded between 2019-2024, indicating consolidation and expansion strategies among key players.
Automatic Drug Dispensing Devices Growth Trends & Insights
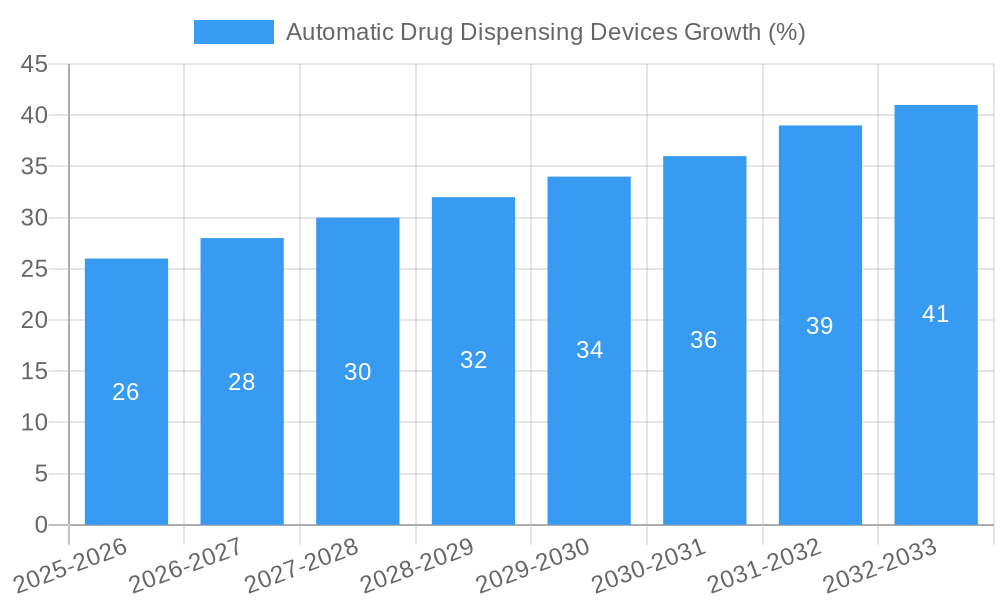
The Automatic Drug Dispensing Devices market exhibits robust growth, driven by factors such as increasing healthcare expenditure, rising prevalence of chronic diseases, growing demand for improved medication management, and technological advancements. The market witnessed a CAGR of xx% during the historical period (2019-2024) and is projected to maintain a CAGR of xx% during the forecast period (2025-2033). Market penetration is currently at xx% in developed regions and is expected to significantly increase in emerging markets. Technological disruptions, such as the integration of IoT and AI, are further accelerating market growth. Shifts in consumer behavior, including preference for convenience and accuracy, are also contributing factors.
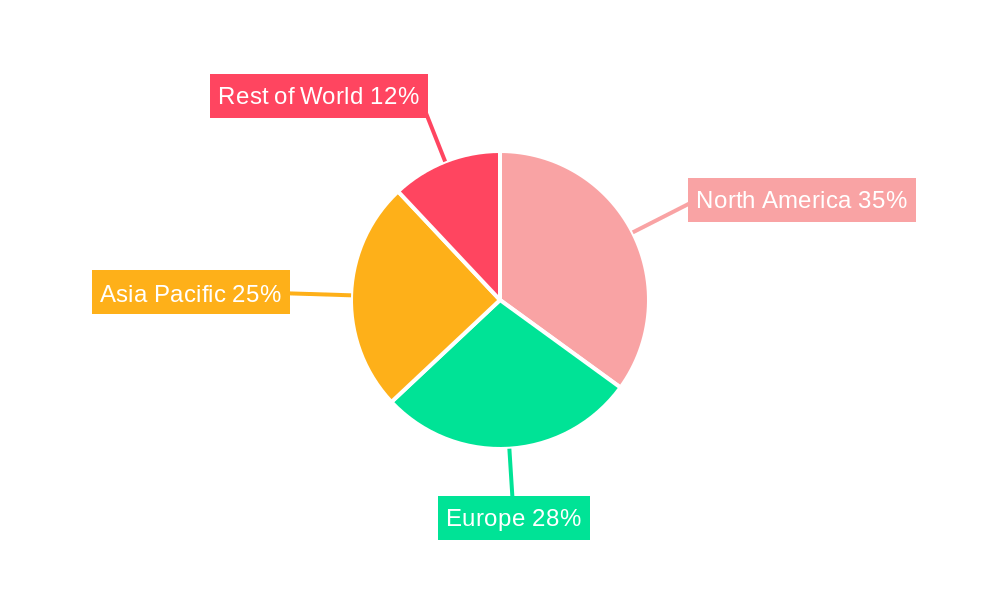
Dominant Regions, Countries, or Segments in Automatic Drug Dispensing Devices
North America currently holds the largest market share, driven by high adoption rates in hospitals and pharmacies, coupled with strong technological advancements and favorable regulatory environments. Europe follows as a significant market, while Asia-Pacific is experiencing rapid growth due to increasing healthcare infrastructure investments and a rising demand for efficient medication management.
- Key Drivers in North America: High healthcare spending, stringent regulatory compliance, and technological innovation.
- Key Drivers in Europe: Increasing prevalence of chronic diseases, growing demand for improved patient safety, and government initiatives to improve healthcare efficiency.
- Key Drivers in Asia-Pacific: Expanding healthcare infrastructure, rising disposable incomes, and increasing awareness of the benefits of automated dispensing.
Automatic Drug Dispensing Devices Product Landscape
The product landscape encompasses various types of automatic drug dispensing devices, ranging from automated dispensing cabinets (ADCs) to carousel systems and robotic dispensing systems. These devices offer features such as improved medication accuracy, reduced medication errors, enhanced inventory management, and streamlined workflow processes. Key innovations include integration with electronic health records (EHRs), barcode scanning, and real-time inventory tracking. Unique selling propositions often include ease of use, enhanced security features, and reduced labor costs.
Key Drivers, Barriers & Challenges in Automatic Drug Dispensing Devices
Key Drivers: Increasing demand for improved medication safety and efficiency, rising healthcare expenditures, technological advancements, and stringent regulatory requirements. Government initiatives promoting the adoption of advanced healthcare technologies are further accelerating market growth.
Challenges & Restraints: High initial investment costs, complexity of integration with existing healthcare IT systems, and concerns regarding data security and patient privacy. Supply chain disruptions and competition from alternative dispensing methods can also pose challenges. The impact of these restraints is estimated to reduce market growth by approximately xx% annually.
Emerging Opportunities in Automatic Drug Dispensing Devices
Emerging opportunities include the integration of artificial intelligence (AI) and machine learning (ML) for predictive inventory management and personalized medication dispensing. Expansion into untapped markets, such as smaller pharmacies and ambulatory care settings, presents significant growth potential. The development of customized solutions tailored to specific healthcare needs and the integration of telehealth platforms are also creating new market opportunities.
Growth Accelerators in the Automatic Drug Dispensing Devices Industry
Strategic partnerships between technology providers and healthcare institutions are key growth catalysts. Technological breakthroughs, such as the development of more efficient and user-friendly devices, will further drive market growth. Expansion into emerging markets and the adoption of innovative business models, such as subscription services, will also contribute to market expansion.
Key Players Shaping the Automatic Drug Dispensing Devices Market
- Omnicell
- YUYAMA
- Baxter International
- Swisslog Healthcare
- TOSHO
- ScriptPro
- ARxIUM
- Willach
- RIVA
- COMECER
- Health Robotics
- APOTECA
- Aesynt
- IHS
- Suzhou INT-G Medical
- Shenzhen Bowei Medical
- Weibang Technology
- Chongqing Kangjiasen Medical
- Shenzhen Times Chuangyue Technology
- Shanghai General Healthy Information
- DIH Technology
- Beijing Red Maple Smart Control Technologies
- Huakang Chengxin Medical
- Shenzhen Ruichizhiyuan Technology
- Med-line Pharmaceutical
Notable Milestones in Automatic Drug Dispensing Devices Sector
- 2020: Omnicell launches its next-generation ADC with AI-powered features.
- 2021: Baxter International acquires a smaller ADC manufacturer, expanding its market share.
- 2022: Swisslog Healthcare secures a major contract with a large hospital system.
- 2023: Several new FDA approvals for innovative ADC technologies.
- 2024: Increased focus on integration of ADCs with EHR systems.
In-Depth Automatic Drug Dispensing Devices Market Outlook
The future of the Automatic Drug Dispensing Devices market is bright, driven by continuous technological advancements, growing demand for efficient medication management, and increasing adoption in various healthcare settings. Strategic partnerships and market expansion into emerging economies will further contribute to sustained growth. Opportunities exist for companies that can provide innovative, cost-effective, and user-friendly solutions addressing the evolving needs of healthcare providers and patients.
Automatic Drug Dispensing Devices Segmentation
-
1. Application
- 1.1. Outpatient Pharmacy
- 1.2. Inpatient Pharmacy
- 1.3. Retail Pharmacy
- 1.4. Others
-
2. Type
- 2.1. Automatic Dispensing Machine
- 2.2. Dispensing Robot
- 2.3. Others
Automatic Drug Dispensing Devices Segmentation By Geography
-
1. North America
- 1.1. United States
- 1.2. Canada
- 1.3. Mexico
-
2. South America
- 2.1. Brazil
- 2.2. Argentina
- 2.3. Rest of South America
-
3. Europe
- 3.1. United Kingdom
- 3.2. Germany
- 3.3. France
- 3.4. Italy
- 3.5. Spain
- 3.6. Russia
- 3.7. Benelux
- 3.8. Nordics
- 3.9. Rest of Europe
-
4. Middle East & Africa
- 4.1. Turkey
- 4.2. Israel
- 4.3. GCC
- 4.4. North Africa
- 4.5. South Africa
- 4.6. Rest of Middle East & Africa
-
5. Asia Pacific
- 5.1. China
- 5.2. India
- 5.3. Japan
- 5.4. South Korea
- 5.5. ASEAN
- 5.6. Oceania
- 5.7. Rest of Asia Pacific
Automatic Drug Dispensing Devices REPORT HIGHLIGHTS
| Aspects | Details |
|---|---|
| Study Period | 2019-2033 |
| Base Year | 2024 |
| Estimated Year | 2025 |
| Forecast Period | 2025-2033 |
| Historical Period | 2019-2024 |
| Growth Rate | CAGR of 5.9% from 2019-2033 |
| Segmentation |
|
Table of Contents
- 1. Introduction
- 1.1. Research Scope
- 1.2. Market Segmentation
- 1.3. Research Methodology
- 1.4. Definitions and Assumptions
- 2. Executive Summary
- 2.1. Introduction
- 3. Market Dynamics
- 3.1. Introduction
- 3.2. Market Drivers
- 3.3. Market Restrains
- 3.4. Market Trends
- 4. Market Factor Analysis
- 4.1. Porters Five Forces
- 4.2. Supply/Value Chain
- 4.3. PESTEL analysis
- 4.4. Market Entropy
- 4.5. Patent/Trademark Analysis
- 5. Global Automatic Drug Dispensing Devices Analysis, Insights and Forecast, 2019-2031
- 5.1. Market Analysis, Insights and Forecast - by Application
- 5.1.1. Outpatient Pharmacy
- 5.1.2. Inpatient Pharmacy
- 5.1.3. Retail Pharmacy
- 5.1.4. Others
- 5.2. Market Analysis, Insights and Forecast - by Type
- 5.2.1. Automatic Dispensing Machine
- 5.2.2. Dispensing Robot
- 5.2.3. Others
- 5.3. Market Analysis, Insights and Forecast - by Region
- 5.3.1. North America
- 5.3.2. South America
- 5.3.3. Europe
- 5.3.4. Middle East & Africa
- 5.3.5. Asia Pacific
- 5.1. Market Analysis, Insights and Forecast - by Application
- 6. North America Automatic Drug Dispensing Devices Analysis, Insights and Forecast, 2019-2031
- 6.1. Market Analysis, Insights and Forecast - by Application
- 6.1.1. Outpatient Pharmacy
- 6.1.2. Inpatient Pharmacy
- 6.1.3. Retail Pharmacy
- 6.1.4. Others
- 6.2. Market Analysis, Insights and Forecast - by Type
- 6.2.1. Automatic Dispensing Machine
- 6.2.2. Dispensing Robot
- 6.2.3. Others
- 6.1. Market Analysis, Insights and Forecast - by Application
- 7. South America Automatic Drug Dispensing Devices Analysis, Insights and Forecast, 2019-2031
- 7.1. Market Analysis, Insights and Forecast - by Application
- 7.1.1. Outpatient Pharmacy
- 7.1.2. Inpatient Pharmacy
- 7.1.3. Retail Pharmacy
- 7.1.4. Others
- 7.2. Market Analysis, Insights and Forecast - by Type
- 7.2.1. Automatic Dispensing Machine
- 7.2.2. Dispensing Robot
- 7.2.3. Others
- 7.1. Market Analysis, Insights and Forecast - by Application
- 8. Europe Automatic Drug Dispensing Devices Analysis, Insights and Forecast, 2019-2031
- 8.1. Market Analysis, Insights and Forecast - by Application
- 8.1.1. Outpatient Pharmacy
- 8.1.2. Inpatient Pharmacy
- 8.1.3. Retail Pharmacy
- 8.1.4. Others
- 8.2. Market Analysis, Insights and Forecast - by Type
- 8.2.1. Automatic Dispensing Machine
- 8.2.2. Dispensing Robot
- 8.2.3. Others
- 8.1. Market Analysis, Insights and Forecast - by Application
- 9. Middle East & Africa Automatic Drug Dispensing Devices Analysis, Insights and Forecast, 2019-2031
- 9.1. Market Analysis, Insights and Forecast - by Application
- 9.1.1. Outpatient Pharmacy
- 9.1.2. Inpatient Pharmacy
- 9.1.3. Retail Pharmacy
- 9.1.4. Others
- 9.2. Market Analysis, Insights and Forecast - by Type
- 9.2.1. Automatic Dispensing Machine
- 9.2.2. Dispensing Robot
- 9.2.3. Others
- 9.1. Market Analysis, Insights and Forecast - by Application
- 10. Asia Pacific Automatic Drug Dispensing Devices Analysis, Insights and Forecast, 2019-2031
- 10.1. Market Analysis, Insights and Forecast - by Application
- 10.1.1. Outpatient Pharmacy
- 10.1.2. Inpatient Pharmacy
- 10.1.3. Retail Pharmacy
- 10.1.4. Others
- 10.2. Market Analysis, Insights and Forecast - by Type
- 10.2.1. Automatic Dispensing Machine
- 10.2.2. Dispensing Robot
- 10.2.3. Others
- 10.1. Market Analysis, Insights and Forecast - by Application
- 11. Competitive Analysis
- 11.1. Global Market Share Analysis 2024
- 11.2. Company Profiles
- 11.2.1 Omnicell
- 11.2.1.1. Overview
- 11.2.1.2. Products
- 11.2.1.3. SWOT Analysis
- 11.2.1.4. Recent Developments
- 11.2.1.5. Financials (Based on Availability)
- 11.2.2 YUYAMA
- 11.2.2.1. Overview
- 11.2.2.2. Products
- 11.2.2.3. SWOT Analysis
- 11.2.2.4. Recent Developments
- 11.2.2.5. Financials (Based on Availability)
- 11.2.3 Baxter International
- 11.2.3.1. Overview
- 11.2.3.2. Products
- 11.2.3.3. SWOT Analysis
- 11.2.3.4. Recent Developments
- 11.2.3.5. Financials (Based on Availability)
- 11.2.4 Swisslog Healthcare
- 11.2.4.1. Overview
- 11.2.4.2. Products
- 11.2.4.3. SWOT Analysis
- 11.2.4.4. Recent Developments
- 11.2.4.5. Financials (Based on Availability)
- 11.2.5 TOSHO
- 11.2.5.1. Overview
- 11.2.5.2. Products
- 11.2.5.3. SWOT Analysis
- 11.2.5.4. Recent Developments
- 11.2.5.5. Financials (Based on Availability)
- 11.2.6 ScriptPro
- 11.2.6.1. Overview
- 11.2.6.2. Products
- 11.2.6.3. SWOT Analysis
- 11.2.6.4. Recent Developments
- 11.2.6.5. Financials (Based on Availability)
- 11.2.7 ARxIUM
- 11.2.7.1. Overview
- 11.2.7.2. Products
- 11.2.7.3. SWOT Analysis
- 11.2.7.4. Recent Developments
- 11.2.7.5. Financials (Based on Availability)
- 11.2.8 Willach
- 11.2.8.1. Overview
- 11.2.8.2. Products
- 11.2.8.3. SWOT Analysis
- 11.2.8.4. Recent Developments
- 11.2.8.5. Financials (Based on Availability)
- 11.2.9 RIVA
- 11.2.9.1. Overview
- 11.2.9.2. Products
- 11.2.9.3. SWOT Analysis
- 11.2.9.4. Recent Developments
- 11.2.9.5. Financials (Based on Availability)
- 11.2.10 COMECER
- 11.2.10.1. Overview
- 11.2.10.2. Products
- 11.2.10.3. SWOT Analysis
- 11.2.10.4. Recent Developments
- 11.2.10.5. Financials (Based on Availability)
- 11.2.11 Health Robotics
- 11.2.11.1. Overview
- 11.2.11.2. Products
- 11.2.11.3. SWOT Analysis
- 11.2.11.4. Recent Developments
- 11.2.11.5. Financials (Based on Availability)
- 11.2.12 APOTECA
- 11.2.12.1. Overview
- 11.2.12.2. Products
- 11.2.12.3. SWOT Analysis
- 11.2.12.4. Recent Developments
- 11.2.12.5. Financials (Based on Availability)
- 11.2.13 Aesynt
- 11.2.13.1. Overview
- 11.2.13.2. Products
- 11.2.13.3. SWOT Analysis
- 11.2.13.4. Recent Developments
- 11.2.13.5. Financials (Based on Availability)
- 11.2.14 IHS
- 11.2.14.1. Overview
- 11.2.14.2. Products
- 11.2.14.3. SWOT Analysis
- 11.2.14.4. Recent Developments
- 11.2.14.5. Financials (Based on Availability)
- 11.2.15 Suzhou INT-G Medical
- 11.2.15.1. Overview
- 11.2.15.2. Products
- 11.2.15.3. SWOT Analysis
- 11.2.15.4. Recent Developments
- 11.2.15.5. Financials (Based on Availability)
- 11.2.16 Shenzhen Bowei Medical
- 11.2.16.1. Overview
- 11.2.16.2. Products
- 11.2.16.3. SWOT Analysis
- 11.2.16.4. Recent Developments
- 11.2.16.5. Financials (Based on Availability)
- 11.2.17 Weibang Technology
- 11.2.17.1. Overview
- 11.2.17.2. Products
- 11.2.17.3. SWOT Analysis
- 11.2.17.4. Recent Developments
- 11.2.17.5. Financials (Based on Availability)
- 11.2.18 Chongqing Kangjiasen Medical
- 11.2.18.1. Overview
- 11.2.18.2. Products
- 11.2.18.3. SWOT Analysis
- 11.2.18.4. Recent Developments
- 11.2.18.5. Financials (Based on Availability)
- 11.2.19 Shenzhen Times Chuangyue Technology
- 11.2.19.1. Overview
- 11.2.19.2. Products
- 11.2.19.3. SWOT Analysis
- 11.2.19.4. Recent Developments
- 11.2.19.5. Financials (Based on Availability)
- 11.2.20 Shanghai General Healthy Information
- 11.2.20.1. Overview
- 11.2.20.2. Products
- 11.2.20.3. SWOT Analysis
- 11.2.20.4. Recent Developments
- 11.2.20.5. Financials (Based on Availability)
- 11.2.21 DIH Technology
- 11.2.21.1. Overview
- 11.2.21.2. Products
- 11.2.21.3. SWOT Analysis
- 11.2.21.4. Recent Developments
- 11.2.21.5. Financials (Based on Availability)
- 11.2.22 Beijing Red Maple Smart Control Technologies
- 11.2.22.1. Overview
- 11.2.22.2. Products
- 11.2.22.3. SWOT Analysis
- 11.2.22.4. Recent Developments
- 11.2.22.5. Financials (Based on Availability)
- 11.2.23 Huakang Chengxin Medical
- 11.2.23.1. Overview
- 11.2.23.2. Products
- 11.2.23.3. SWOT Analysis
- 11.2.23.4. Recent Developments
- 11.2.23.5. Financials (Based on Availability)
- 11.2.24 Shenzhen Ruichizhiyuan Technology
- 11.2.24.1. Overview
- 11.2.24.2. Products
- 11.2.24.3. SWOT Analysis
- 11.2.24.4. Recent Developments
- 11.2.24.5. Financials (Based on Availability)
- 11.2.25 Med-line Pharmaceutical
- 11.2.25.1. Overview
- 11.2.25.2. Products
- 11.2.25.3. SWOT Analysis
- 11.2.25.4. Recent Developments
- 11.2.25.5. Financials (Based on Availability)
- 11.2.1 Omnicell
List of Figures
- Figure 1: Global Automatic Drug Dispensing Devices Revenue Breakdown (million, %) by Region 2024 & 2032
- Figure 2: North America Automatic Drug Dispensing Devices Revenue (million), by Application 2024 & 2032
- Figure 3: North America Automatic Drug Dispensing Devices Revenue Share (%), by Application 2024 & 2032
- Figure 4: North America Automatic Drug Dispensing Devices Revenue (million), by Type 2024 & 2032
- Figure 5: North America Automatic Drug Dispensing Devices Revenue Share (%), by Type 2024 & 2032
- Figure 6: North America Automatic Drug Dispensing Devices Revenue (million), by Country 2024 & 2032
- Figure 7: North America Automatic Drug Dispensing Devices Revenue Share (%), by Country 2024 & 2032
- Figure 8: South America Automatic Drug Dispensing Devices Revenue (million), by Application 2024 & 2032
- Figure 9: South America Automatic Drug Dispensing Devices Revenue Share (%), by Application 2024 & 2032
- Figure 10: South America Automatic Drug Dispensing Devices Revenue (million), by Type 2024 & 2032
- Figure 11: South America Automatic Drug Dispensing Devices Revenue Share (%), by Type 2024 & 2032
- Figure 12: South America Automatic Drug Dispensing Devices Revenue (million), by Country 2024 & 2032
- Figure 13: South America Automatic Drug Dispensing Devices Revenue Share (%), by Country 2024 & 2032
- Figure 14: Europe Automatic Drug Dispensing Devices Revenue (million), by Application 2024 & 2032
- Figure 15: Europe Automatic Drug Dispensing Devices Revenue Share (%), by Application 2024 & 2032
- Figure 16: Europe Automatic Drug Dispensing Devices Revenue (million), by Type 2024 & 2032
- Figure 17: Europe Automatic Drug Dispensing Devices Revenue Share (%), by Type 2024 & 2032
- Figure 18: Europe Automatic Drug Dispensing Devices Revenue (million), by Country 2024 & 2032
- Figure 19: Europe Automatic Drug Dispensing Devices Revenue Share (%), by Country 2024 & 2032
- Figure 20: Middle East & Africa Automatic Drug Dispensing Devices Revenue (million), by Application 2024 & 2032
- Figure 21: Middle East & Africa Automatic Drug Dispensing Devices Revenue Share (%), by Application 2024 & 2032
- Figure 22: Middle East & Africa Automatic Drug Dispensing Devices Revenue (million), by Type 2024 & 2032
- Figure 23: Middle East & Africa Automatic Drug Dispensing Devices Revenue Share (%), by Type 2024 & 2032
- Figure 24: Middle East & Africa Automatic Drug Dispensing Devices Revenue (million), by Country 2024 & 2032
- Figure 25: Middle East & Africa Automatic Drug Dispensing Devices Revenue Share (%), by Country 2024 & 2032
- Figure 26: Asia Pacific Automatic Drug Dispensing Devices Revenue (million), by Application 2024 & 2032
- Figure 27: Asia Pacific Automatic Drug Dispensing Devices Revenue Share (%), by Application 2024 & 2032
- Figure 28: Asia Pacific Automatic Drug Dispensing Devices Revenue (million), by Type 2024 & 2032
- Figure 29: Asia Pacific Automatic Drug Dispensing Devices Revenue Share (%), by Type 2024 & 2032
- Figure 30: Asia Pacific Automatic Drug Dispensing Devices Revenue (million), by Country 2024 & 2032
- Figure 31: Asia Pacific Automatic Drug Dispensing Devices Revenue Share (%), by Country 2024 & 2032
List of Tables
- Table 1: Global Automatic Drug Dispensing Devices Revenue million Forecast, by Region 2019 & 2032
- Table 2: Global Automatic Drug Dispensing Devices Revenue million Forecast, by Application 2019 & 2032
- Table 3: Global Automatic Drug Dispensing Devices Revenue million Forecast, by Type 2019 & 2032
- Table 4: Global Automatic Drug Dispensing Devices Revenue million Forecast, by Region 2019 & 2032
- Table 5: Global Automatic Drug Dispensing Devices Revenue million Forecast, by Application 2019 & 2032
- Table 6: Global Automatic Drug Dispensing Devices Revenue million Forecast, by Type 2019 & 2032
- Table 7: Global Automatic Drug Dispensing Devices Revenue million Forecast, by Country 2019 & 2032
- Table 8: United States Automatic Drug Dispensing Devices Revenue (million) Forecast, by Application 2019 & 2032
- Table 9: Canada Automatic Drug Dispensing Devices Revenue (million) Forecast, by Application 2019 & 2032
- Table 10: Mexico Automatic Drug Dispensing Devices Revenue (million) Forecast, by Application 2019 & 2032
- Table 11: Global Automatic Drug Dispensing Devices Revenue million Forecast, by Application 2019 & 2032
- Table 12: Global Automatic Drug Dispensing Devices Revenue million Forecast, by Type 2019 & 2032
- Table 13: Global Automatic Drug Dispensing Devices Revenue million Forecast, by Country 2019 & 2032
- Table 14: Brazil Automatic Drug Dispensing Devices Revenue (million) Forecast, by Application 2019 & 2032
- Table 15: Argentina Automatic Drug Dispensing Devices Revenue (million) Forecast, by Application 2019 & 2032
- Table 16: Rest of South America Automatic Drug Dispensing Devices Revenue (million) Forecast, by Application 2019 & 2032
- Table 17: Global Automatic Drug Dispensing Devices Revenue million Forecast, by Application 2019 & 2032
- Table 18: Global Automatic Drug Dispensing Devices Revenue million Forecast, by Type 2019 & 2032
- Table 19: Global Automatic Drug Dispensing Devices Revenue million Forecast, by Country 2019 & 2032
- Table 20: United Kingdom Automatic Drug Dispensing Devices Revenue (million) Forecast, by Application 2019 & 2032
- Table 21: Germany Automatic Drug Dispensing Devices Revenue (million) Forecast, by Application 2019 & 2032
- Table 22: France Automatic Drug Dispensing Devices Revenue (million) Forecast, by Application 2019 & 2032
- Table 23: Italy Automatic Drug Dispensing Devices Revenue (million) Forecast, by Application 2019 & 2032
- Table 24: Spain Automatic Drug Dispensing Devices Revenue (million) Forecast, by Application 2019 & 2032
- Table 25: Russia Automatic Drug Dispensing Devices Revenue (million) Forecast, by Application 2019 & 2032
- Table 26: Benelux Automatic Drug Dispensing Devices Revenue (million) Forecast, by Application 2019 & 2032
- Table 27: Nordics Automatic Drug Dispensing Devices Revenue (million) Forecast, by Application 2019 & 2032
- Table 28: Rest of Europe Automatic Drug Dispensing Devices Revenue (million) Forecast, by Application 2019 & 2032
- Table 29: Global Automatic Drug Dispensing Devices Revenue million Forecast, by Application 2019 & 2032
- Table 30: Global Automatic Drug Dispensing Devices Revenue million Forecast, by Type 2019 & 2032
- Table 31: Global Automatic Drug Dispensing Devices Revenue million Forecast, by Country 2019 & 2032
- Table 32: Turkey Automatic Drug Dispensing Devices Revenue (million) Forecast, by Application 2019 & 2032
- Table 33: Israel Automatic Drug Dispensing Devices Revenue (million) Forecast, by Application 2019 & 2032
- Table 34: GCC Automatic Drug Dispensing Devices Revenue (million) Forecast, by Application 2019 & 2032
- Table 35: North Africa Automatic Drug Dispensing Devices Revenue (million) Forecast, by Application 2019 & 2032
- Table 36: South Africa Automatic Drug Dispensing Devices Revenue (million) Forecast, by Application 2019 & 2032
- Table 37: Rest of Middle East & Africa Automatic Drug Dispensing Devices Revenue (million) Forecast, by Application 2019 & 2032
- Table 38: Global Automatic Drug Dispensing Devices Revenue million Forecast, by Application 2019 & 2032
- Table 39: Global Automatic Drug Dispensing Devices Revenue million Forecast, by Type 2019 & 2032
- Table 40: Global Automatic Drug Dispensing Devices Revenue million Forecast, by Country 2019 & 2032
- Table 41: China Automatic Drug Dispensing Devices Revenue (million) Forecast, by Application 2019 & 2032
- Table 42: India Automatic Drug Dispensing Devices Revenue (million) Forecast, by Application 2019 & 2032
- Table 43: Japan Automatic Drug Dispensing Devices Revenue (million) Forecast, by Application 2019 & 2032
- Table 44: South Korea Automatic Drug Dispensing Devices Revenue (million) Forecast, by Application 2019 & 2032
- Table 45: ASEAN Automatic Drug Dispensing Devices Revenue (million) Forecast, by Application 2019 & 2032
- Table 46: Oceania Automatic Drug Dispensing Devices Revenue (million) Forecast, by Application 2019 & 2032
- Table 47: Rest of Asia Pacific Automatic Drug Dispensing Devices Revenue (million) Forecast, by Application 2019 & 2032
Frequently Asked Questions
1. What is the projected Compound Annual Growth Rate (CAGR) of the Automatic Drug Dispensing Devices?
The projected CAGR is approximately 5.9%.
2. Which companies are prominent players in the Automatic Drug Dispensing Devices?
Key companies in the market include Omnicell, YUYAMA, Baxter International, Swisslog Healthcare, TOSHO, ScriptPro, ARxIUM, Willach, RIVA, COMECER, Health Robotics, APOTECA, Aesynt, IHS, Suzhou INT-G Medical, Shenzhen Bowei Medical, Weibang Technology, Chongqing Kangjiasen Medical, Shenzhen Times Chuangyue Technology, Shanghai General Healthy Information, DIH Technology, Beijing Red Maple Smart Control Technologies, Huakang Chengxin Medical, Shenzhen Ruichizhiyuan Technology, Med-line Pharmaceutical.
3. What are the main segments of the Automatic Drug Dispensing Devices?
The market segments include Application, Type.
4. Can you provide details about the market size?
The market size is estimated to be USD 423 million as of 2022.
5. What are some drivers contributing to market growth?
N/A
6. What are the notable trends driving market growth?
N/A
7. Are there any restraints impacting market growth?
N/A
8. Can you provide examples of recent developments in the market?
N/A
9. What pricing options are available for accessing the report?
Pricing options include single-user, multi-user, and enterprise licenses priced at USD 2900.00, USD 4350.00, and USD 5800.00 respectively.
10. Is the market size provided in terms of value or volume?
The market size is provided in terms of value, measured in million.
11. Are there any specific market keywords associated with the report?
Yes, the market keyword associated with the report is "Automatic Drug Dispensing Devices," which aids in identifying and referencing the specific market segment covered.
12. How do I determine which pricing option suits my needs best?
The pricing options vary based on user requirements and access needs. Individual users may opt for single-user licenses, while businesses requiring broader access may choose multi-user or enterprise licenses for cost-effective access to the report.
13. Are there any additional resources or data provided in the Automatic Drug Dispensing Devices report?
While the report offers comprehensive insights, it's advisable to review the specific contents or supplementary materials provided to ascertain if additional resources or data are available.
14. How can I stay updated on further developments or reports in the Automatic Drug Dispensing Devices?
To stay informed about further developments, trends, and reports in the Automatic Drug Dispensing Devices, consider subscribing to industry newsletters, following relevant companies and organizations, or regularly checking reputable industry news sources and publications.
Methodology
Step 1 - Identification of Relevant Samples Size from Population Database


Step 2 - Approaches for Defining Global Market Size (Value, Volume* & Price*)

Note*: In applicable scenarios
Step 3 - Data Sources
Primary Research
- Web Analytics
- Survey Reports
- Research Institute
- Latest Research Reports
- Opinion Leaders
Secondary Research
- Annual Reports
- White Paper
- Latest Press Release
- Industry Association
- Paid Database
- Investor Presentations

Step 4 - Data Triangulation
Involves using different sources of information in order to increase the validity of a study
These sources are likely to be stakeholders in a program - participants, other researchers, program staff, other community members, and so on.
Then we put all data in single framework & apply various statistical tools to find out the dynamic on the market.
During the analysis stage, feedback from the stakeholder groups would be compared to determine areas of agreement as well as areas of divergence
