

Key Insights
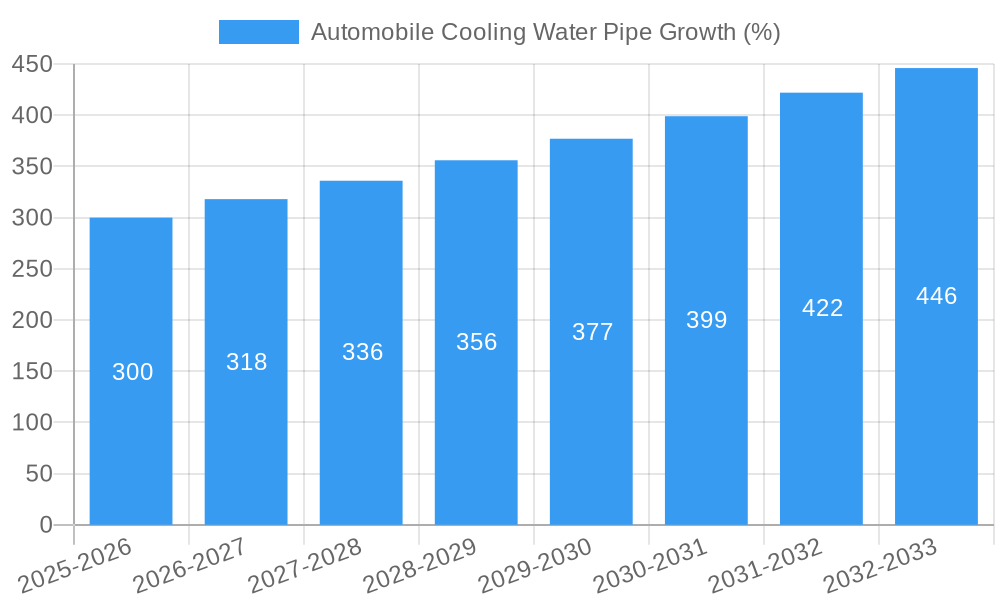
The global automobile cooling water pipe market is experiencing robust growth, driven by the increasing demand for vehicles globally and the stringent emission regulations promoting efficient engine cooling systems. The market size in 2025 is estimated at $5 billion, based on industry analysis and considering consistent growth trends observed in related automotive components. A Compound Annual Growth Rate (CAGR) of 6% is projected from 2025 to 2033, indicating a significant expansion in market value over the forecast period. This growth is fueled by several key factors: the rising popularity of electric vehicles (EVs) and hybrid electric vehicles (HEVs), which require advanced cooling systems; increasing adoption of lightweight materials in automotive manufacturing to improve fuel efficiency; and technological advancements in pipe materials and manufacturing processes leading to enhanced durability and performance. Major players like Continental, ILPEA, and others are driving innovation, focusing on developing advanced materials like reinforced polymers and high-strength alloys to meet the demands of increasingly sophisticated cooling systems. However, challenges exist including fluctuations in raw material prices and the increasing complexity of vehicle cooling systems, which can affect production costs. Geographic segmentation reveals strong growth in Asia-Pacific, driven by expanding automotive production in regions like China and India, while North America and Europe maintain significant market shares due to established automotive industries and high vehicle ownership rates.
The market is segmented by material type (plastic, metal, composite), vehicle type (passenger cars, commercial vehicles), and region (North America, Europe, Asia-Pacific, Rest of the World). Competition is intense, with both established global players and regional manufacturers vying for market share. While established players benefit from brand recognition and technological expertise, regional manufacturers are leveraging cost advantages to compete effectively. The continued growth of the automobile industry, particularly in emerging markets, presents significant opportunities for market expansion. Furthermore, the integration of advanced technologies like thermal management systems and improved cooling efficiency strategies will further propel the market's trajectory in the coming years. Future growth is expected to be influenced by technological advancements in cooling systems, changing consumer preferences, and government policies aimed at improving fuel efficiency and reducing emissions.
Automobile Cooling Water Pipe Market Report: 2019-2033
This comprehensive report provides a detailed analysis of the global Automobile Cooling Water Pipe market, encompassing market dynamics, growth trends, regional analysis, competitive landscape, and future outlook. The study period covers 2019-2033, with a base year of 2025 and a forecast period of 2025-2033. This in-depth analysis is crucial for automotive manufacturers, component suppliers, investors, and industry professionals seeking to understand and capitalize on the opportunities within this vital sector of the automotive industry. The report projects a market size of xx million units by 2033.
Automobile Cooling Water Pipe Market Dynamics & Structure
The global automobile cooling water pipe market is characterized by a moderately concentrated landscape with key players vying for market share. Technological innovation, driven by the need for lightweighting, improved thermal efficiency, and enhanced durability, is a major driver. Stringent emission regulations globally are pushing the adoption of advanced materials and designs. The market also faces competition from alternative cooling technologies, but the widespread reliance on traditional internal combustion engines ensures continued demand. Mergers and acquisitions (M&A) activity remains moderate, with larger players strategically acquiring smaller specialized companies to expand their product portfolio and geographic reach.
- Market Concentration: Moderately concentrated, with top 5 players holding approximately xx% market share in 2025.
- Technological Innovation: Focus on lightweight materials (e.g., aluminum alloys, plastics), improved corrosion resistance, and optimized flow designs.
- Regulatory Landscape: Stringent emission standards driving demand for improved thermal management systems.
- Competitive Substitutes: Limited direct substitutes, but indirect competition from alternative cooling technologies (e.g., electric vehicles).
- End-User Demographics: Primarily driven by the automotive industry, with passenger vehicles accounting for the largest segment.
- M&A Trends: A modest number of acquisitions (xx deals) recorded between 2019 and 2024, primarily focused on expanding product lines and geographic reach.
Automobile Cooling Water Pipe Growth Trends & Insights
The automobile cooling water pipe market experienced steady growth during the historical period (2019-2024), fueled by the increasing production of passenger and commercial vehicles globally. This growth is expected to continue, albeit at a moderated pace, during the forecast period (2025-2033). The adoption rate of advanced cooling water pipes incorporating innovative materials and designs is gradually increasing, driven by the demand for improved fuel efficiency and reduced emissions. The market is witnessing a gradual shift towards lightweight materials to reduce vehicle weight and improve fuel economy. Technological disruptions are mainly focused on optimizing material properties and manufacturing processes.
- Market Size Evolution: The market size grew from xx million units in 2019 to xx million units in 2024, with a projected CAGR of xx% during the forecast period.
- Adoption Rates: Adoption of advanced materials and designs is gradually increasing, driven by regulatory pressures and technological advancements.
- Technological Disruptions: Focus on lightweighting, improved corrosion resistance, and enhanced manufacturing processes.
- Consumer Behavior Shifts: Increased awareness of fuel efficiency and environmental concerns driving demand for improved cooling systems.
Dominant Regions, Countries, or Segments in Automobile Cooling Water Pipe
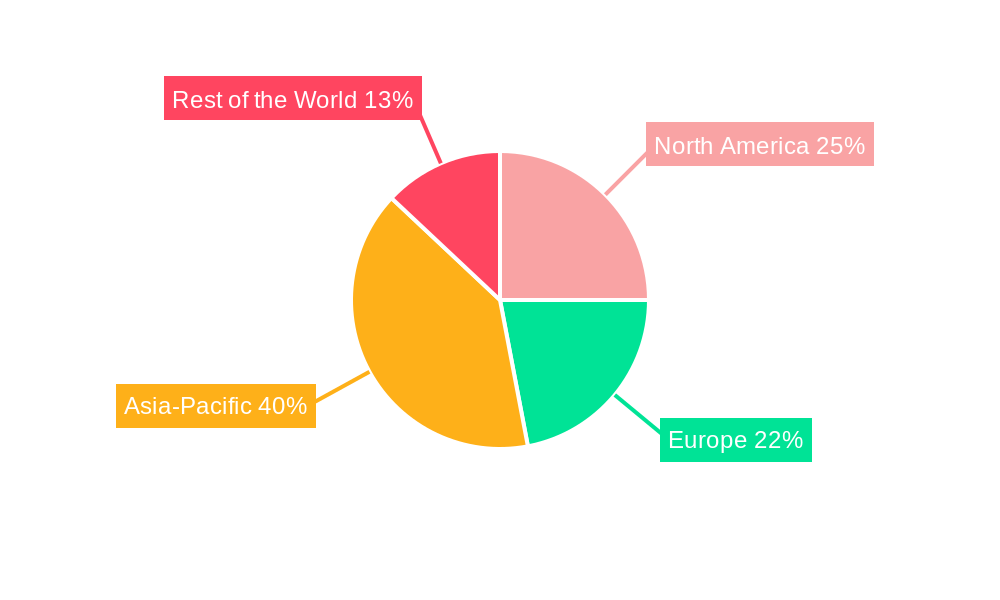
Asia-Pacific is the dominant region in the automobile cooling water pipe market, accounting for the largest market share (xx%) in 2025, driven primarily by the high production volumes of automobiles in China and India. This dominance is fueled by rapid economic growth, increasing vehicle ownership rates, and a burgeoning automotive manufacturing industry. North America and Europe also hold significant market shares, but their growth rates are expected to be slower than Asia-Pacific during the forecast period.
- Key Drivers in Asia-Pacific:
- Rapid economic growth and rising disposable incomes.
- High automobile production volumes.
- Favorable government policies supporting the automotive industry.
- Development of robust automotive supply chains.
- Dominance Factors: Large-scale automobile production in key economies like China and India, cost-effective manufacturing, and growing demand for vehicles.
- Growth Potential: Continued growth is expected due to ongoing investments in the automotive industry and increasing vehicle sales.
Automobile Cooling Water Pipe Product Landscape
The automobile cooling water pipe market offers a range of products, from standard steel pipes to advanced lightweight aluminum and plastic alternatives. These pipes are designed to meet varying performance requirements and vehicle specifications. Innovative designs focus on optimizing flow characteristics, enhancing durability, and improving corrosion resistance. Unique selling propositions often include lightweight design, improved thermal efficiency, and enhanced durability under harsh operating conditions. Technological advancements are focused on material science, manufacturing techniques, and design optimization.
Key Drivers, Barriers & Challenges in Automobile Cooling Water Pipe
Key Drivers: The primary drivers for market growth include rising vehicle production, stricter emission regulations mandating efficient cooling systems, increasing demand for lightweight vehicles, and the need for improved fuel efficiency. These factors are collectively pushing the demand for advanced cooling water pipes with enhanced material properties and optimized designs.
Key Challenges & Restraints: Supply chain disruptions, rising raw material costs, stringent quality standards, and intense competition from established and emerging players pose significant challenges to market growth. These challenges could impact production timelines and profitability if not managed effectively. Furthermore, stringent regulatory requirements for material composition and performance can increase manufacturing complexity and costs.
Emerging Opportunities in Automobile Cooling Water Pipe
Emerging opportunities lie in the development of advanced materials like high-strength plastics and composites, which offer significant weight reduction potential. The expansion into electric and hybrid vehicles presents a significant opportunity, as these vehicles often require customized cooling systems. Furthermore, exploring untapped markets in developing economies offers potential for future growth.
Growth Accelerators in the Automobile Cooling Water Pipe Industry
Technological breakthroughs in materials science and manufacturing processes are key growth accelerators. Strategic partnerships between component suppliers and automotive manufacturers can facilitate the adoption of innovative cooling technologies. Market expansion into developing economies presents a significant opportunity for long-term growth, driven by increasing vehicle ownership and production.
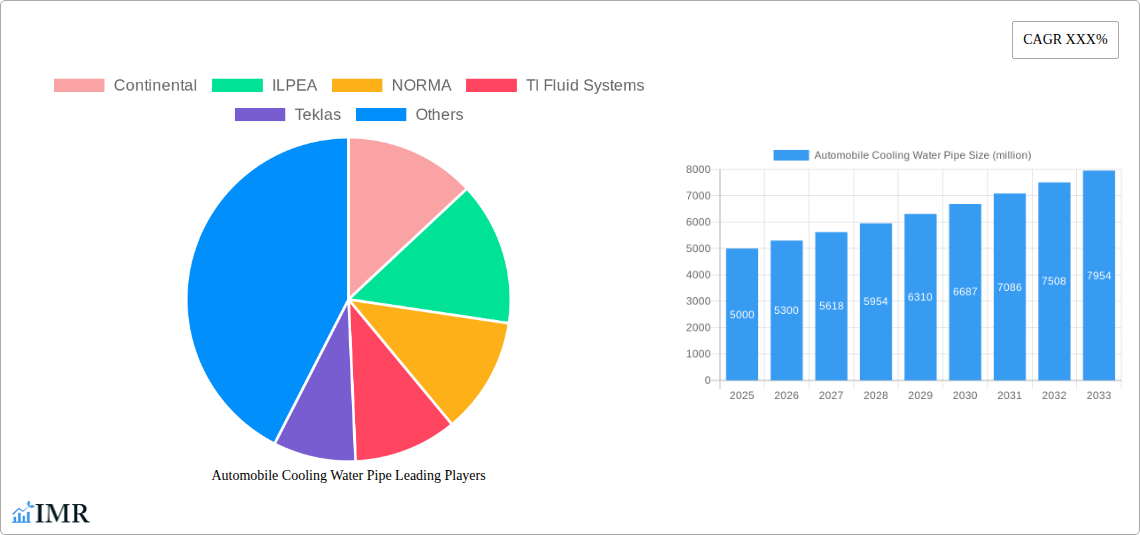
Key Players Shaping the Automobile Cooling Water Pipe Market
- Continental
- ILPEA
- NORMA
- Tl Fluid Systems
- Teklas
- Kayser
- PASS GmbH
- Fraenkisch
- VOSS Automotive
- ManuliHydraulics
- Pivot Automotive
- Chinaust
- Sulian Plastic
- Pengling Group
- Chuanhuan Technology
- Zhongding Group
- KUS
- Shanghai Sanda Automobile Parts
Notable Milestones in Automobile Cooling Water Pipe Sector
- 2021 Q3: VOSS Automotive launched a new lightweight aluminum cooling water pipe.
- 2022 Q1: Continental announced a strategic partnership with a leading automotive manufacturer for the development of next-generation cooling systems.
- 2023 Q2: A major merger between two key players resulted in a significant shift in market share. (Specific details xx)
In-Depth Automobile Cooling Water Pipe Market Outlook
The automobile cooling water pipe market is poised for continued growth, driven by technological advancements, increasing vehicle production, and stricter emission regulations. Strategic partnerships, investments in R&D, and expansion into new markets will be crucial for players to capitalize on the market's future potential. The focus on lightweighting, improved thermal management, and sustainability will shape the product landscape in the coming years.
Automobile Cooling Water Pipe Segmentation
-
1. Application
- 1.1. Commercial Vehicle
- 1.2. Passenger Car
-
2. Type
- 2.1. Metal
- 2.2. Rubber
- 2.3. Nylon
- 2.4. Others
Automobile Cooling Water Pipe Segmentation By Geography
-
1. North America
- 1.1. United States
- 1.2. Canada
- 1.3. Mexico
-
2. South America
- 2.1. Brazil
- 2.2. Argentina
- 2.3. Rest of South America
-
3. Europe
- 3.1. United Kingdom
- 3.2. Germany
- 3.3. France
- 3.4. Italy
- 3.5. Spain
- 3.6. Russia
- 3.7. Benelux
- 3.8. Nordics
- 3.9. Rest of Europe
-
4. Middle East & Africa
- 4.1. Turkey
- 4.2. Israel
- 4.3. GCC
- 4.4. North Africa
- 4.5. South Africa
- 4.6. Rest of Middle East & Africa
-
5. Asia Pacific
- 5.1. China
- 5.2. India
- 5.3. Japan
- 5.4. South Korea
- 5.5. ASEAN
- 5.6. Oceania
- 5.7. Rest of Asia Pacific
Automobile Cooling Water Pipe REPORT HIGHLIGHTS
| Aspects | Details |
|---|---|
| Study Period | 2019-2033 |
| Base Year | 2024 |
| Estimated Year | 2025 |
| Forecast Period | 2025-2033 |
| Historical Period | 2019-2024 |
| Growth Rate | CAGR of XXX% from 2019-2033 |
| Segmentation |
|
Table of Contents
- 1. Introduction
- 1.1. Research Scope
- 1.2. Market Segmentation
- 1.3. Research Methodology
- 1.4. Definitions and Assumptions
- 2. Executive Summary
- 2.1. Introduction
- 3. Market Dynamics
- 3.1. Introduction
- 3.2. Market Drivers
- 3.3. Market Restrains
- 3.4. Market Trends
- 4. Market Factor Analysis
- 4.1. Porters Five Forces
- 4.2. Supply/Value Chain
- 4.3. PESTEL analysis
- 4.4. Market Entropy
- 4.5. Patent/Trademark Analysis
- 5. Global Automobile Cooling Water Pipe Analysis, Insights and Forecast, 2019-2031
- 5.1. Market Analysis, Insights and Forecast - by Application
- 5.1.1. Commercial Vehicle
- 5.1.2. Passenger Car
- 5.2. Market Analysis, Insights and Forecast - by Type
- 5.2.1. Metal
- 5.2.2. Rubber
- 5.2.3. Nylon
- 5.2.4. Others
- 5.3. Market Analysis, Insights and Forecast - by Region
- 5.3.1. North America
- 5.3.2. South America
- 5.3.3. Europe
- 5.3.4. Middle East & Africa
- 5.3.5. Asia Pacific
- 5.1. Market Analysis, Insights and Forecast - by Application
- 6. North America Automobile Cooling Water Pipe Analysis, Insights and Forecast, 2019-2031
- 6.1. Market Analysis, Insights and Forecast - by Application
- 6.1.1. Commercial Vehicle
- 6.1.2. Passenger Car
- 6.2. Market Analysis, Insights and Forecast - by Type
- 6.2.1. Metal
- 6.2.2. Rubber
- 6.2.3. Nylon
- 6.2.4. Others
- 6.1. Market Analysis, Insights and Forecast - by Application
- 7. South America Automobile Cooling Water Pipe Analysis, Insights and Forecast, 2019-2031
- 7.1. Market Analysis, Insights and Forecast - by Application
- 7.1.1. Commercial Vehicle
- 7.1.2. Passenger Car
- 7.2. Market Analysis, Insights and Forecast - by Type
- 7.2.1. Metal
- 7.2.2. Rubber
- 7.2.3. Nylon
- 7.2.4. Others
- 7.1. Market Analysis, Insights and Forecast - by Application
- 8. Europe Automobile Cooling Water Pipe Analysis, Insights and Forecast, 2019-2031
- 8.1. Market Analysis, Insights and Forecast - by Application
- 8.1.1. Commercial Vehicle
- 8.1.2. Passenger Car
- 8.2. Market Analysis, Insights and Forecast - by Type
- 8.2.1. Metal
- 8.2.2. Rubber
- 8.2.3. Nylon
- 8.2.4. Others
- 8.1. Market Analysis, Insights and Forecast - by Application
- 9. Middle East & Africa Automobile Cooling Water Pipe Analysis, Insights and Forecast, 2019-2031
- 9.1. Market Analysis, Insights and Forecast - by Application
- 9.1.1. Commercial Vehicle
- 9.1.2. Passenger Car
- 9.2. Market Analysis, Insights and Forecast - by Type
- 9.2.1. Metal
- 9.2.2. Rubber
- 9.2.3. Nylon
- 9.2.4. Others
- 9.1. Market Analysis, Insights and Forecast - by Application
- 10. Asia Pacific Automobile Cooling Water Pipe Analysis, Insights and Forecast, 2019-2031
- 10.1. Market Analysis, Insights and Forecast - by Application
- 10.1.1. Commercial Vehicle
- 10.1.2. Passenger Car
- 10.2. Market Analysis, Insights and Forecast - by Type
- 10.2.1. Metal
- 10.2.2. Rubber
- 10.2.3. Nylon
- 10.2.4. Others
- 10.1. Market Analysis, Insights and Forecast - by Application
- 11. Competitive Analysis
- 11.1. Global Market Share Analysis 2024
- 11.2. Company Profiles
- 11.2.1 Continental
- 11.2.1.1. Overview
- 11.2.1.2. Products
- 11.2.1.3. SWOT Analysis
- 11.2.1.4. Recent Developments
- 11.2.1.5. Financials (Based on Availability)
- 11.2.2 ILPEA
- 11.2.2.1. Overview
- 11.2.2.2. Products
- 11.2.2.3. SWOT Analysis
- 11.2.2.4. Recent Developments
- 11.2.2.5. Financials (Based on Availability)
- 11.2.3 NORMA
- 11.2.3.1. Overview
- 11.2.3.2. Products
- 11.2.3.3. SWOT Analysis
- 11.2.3.4. Recent Developments
- 11.2.3.5. Financials (Based on Availability)
- 11.2.4 Tl Fluid Systems
- 11.2.4.1. Overview
- 11.2.4.2. Products
- 11.2.4.3. SWOT Analysis
- 11.2.4.4. Recent Developments
- 11.2.4.5. Financials (Based on Availability)
- 11.2.5 Teklas
- 11.2.5.1. Overview
- 11.2.5.2. Products
- 11.2.5.3. SWOT Analysis
- 11.2.5.4. Recent Developments
- 11.2.5.5. Financials (Based on Availability)
- 11.2.6 Kayser
- 11.2.6.1. Overview
- 11.2.6.2. Products
- 11.2.6.3. SWOT Analysis
- 11.2.6.4. Recent Developments
- 11.2.6.5. Financials (Based on Availability)
- 11.2.7 PASS GmbH
- 11.2.7.1. Overview
- 11.2.7.2. Products
- 11.2.7.3. SWOT Analysis
- 11.2.7.4. Recent Developments
- 11.2.7.5. Financials (Based on Availability)
- 11.2.8 Fraenkisch
- 11.2.8.1. Overview
- 11.2.8.2. Products
- 11.2.8.3. SWOT Analysis
- 11.2.8.4. Recent Developments
- 11.2.8.5. Financials (Based on Availability)
- 11.2.9 VOSS Automotive
- 11.2.9.1. Overview
- 11.2.9.2. Products
- 11.2.9.3. SWOT Analysis
- 11.2.9.4. Recent Developments
- 11.2.9.5. Financials (Based on Availability)
- 11.2.10 ManuliHydraulics
- 11.2.10.1. Overview
- 11.2.10.2. Products
- 11.2.10.3. SWOT Analysis
- 11.2.10.4. Recent Developments
- 11.2.10.5. Financials (Based on Availability)
- 11.2.11 Pivot Automotive
- 11.2.11.1. Overview
- 11.2.11.2. Products
- 11.2.11.3. SWOT Analysis
- 11.2.11.4. Recent Developments
- 11.2.11.5. Financials (Based on Availability)
- 11.2.12 Chinaust
- 11.2.12.1. Overview
- 11.2.12.2. Products
- 11.2.12.3. SWOT Analysis
- 11.2.12.4. Recent Developments
- 11.2.12.5. Financials (Based on Availability)
- 11.2.13 Sulian Plastic
- 11.2.13.1. Overview
- 11.2.13.2. Products
- 11.2.13.3. SWOT Analysis
- 11.2.13.4. Recent Developments
- 11.2.13.5. Financials (Based on Availability)
- 11.2.14 Pengling Group
- 11.2.14.1. Overview
- 11.2.14.2. Products
- 11.2.14.3. SWOT Analysis
- 11.2.14.4. Recent Developments
- 11.2.14.5. Financials (Based on Availability)
- 11.2.15 Chuanhuan Technology
- 11.2.15.1. Overview
- 11.2.15.2. Products
- 11.2.15.3. SWOT Analysis
- 11.2.15.4. Recent Developments
- 11.2.15.5. Financials (Based on Availability)
- 11.2.16 Zhongding Group
- 11.2.16.1. Overview
- 11.2.16.2. Products
- 11.2.16.3. SWOT Analysis
- 11.2.16.4. Recent Developments
- 11.2.16.5. Financials (Based on Availability)
- 11.2.17 KUS
- 11.2.17.1. Overview
- 11.2.17.2. Products
- 11.2.17.3. SWOT Analysis
- 11.2.17.4. Recent Developments
- 11.2.17.5. Financials (Based on Availability)
- 11.2.18 Shanghai Sanda Automobile Parts
- 11.2.18.1. Overview
- 11.2.18.2. Products
- 11.2.18.3. SWOT Analysis
- 11.2.18.4. Recent Developments
- 11.2.18.5. Financials (Based on Availability)
- 11.2.1 Continental
List of Figures
- Figure 1: Global Automobile Cooling Water Pipe Revenue Breakdown (million, %) by Region 2024 & 2032
- Figure 2: Global Automobile Cooling Water Pipe Volume Breakdown (K, %) by Region 2024 & 2032
- Figure 3: North America Automobile Cooling Water Pipe Revenue (million), by Application 2024 & 2032
- Figure 4: North America Automobile Cooling Water Pipe Volume (K), by Application 2024 & 2032
- Figure 5: North America Automobile Cooling Water Pipe Revenue Share (%), by Application 2024 & 2032
- Figure 6: North America Automobile Cooling Water Pipe Volume Share (%), by Application 2024 & 2032
- Figure 7: North America Automobile Cooling Water Pipe Revenue (million), by Type 2024 & 2032
- Figure 8: North America Automobile Cooling Water Pipe Volume (K), by Type 2024 & 2032
- Figure 9: North America Automobile Cooling Water Pipe Revenue Share (%), by Type 2024 & 2032
- Figure 10: North America Automobile Cooling Water Pipe Volume Share (%), by Type 2024 & 2032
- Figure 11: North America Automobile Cooling Water Pipe Revenue (million), by Country 2024 & 2032
- Figure 12: North America Automobile Cooling Water Pipe Volume (K), by Country 2024 & 2032
- Figure 13: North America Automobile Cooling Water Pipe Revenue Share (%), by Country 2024 & 2032
- Figure 14: North America Automobile Cooling Water Pipe Volume Share (%), by Country 2024 & 2032
- Figure 15: South America Automobile Cooling Water Pipe Revenue (million), by Application 2024 & 2032
- Figure 16: South America Automobile Cooling Water Pipe Volume (K), by Application 2024 & 2032
- Figure 17: South America Automobile Cooling Water Pipe Revenue Share (%), by Application 2024 & 2032
- Figure 18: South America Automobile Cooling Water Pipe Volume Share (%), by Application 2024 & 2032
- Figure 19: South America Automobile Cooling Water Pipe Revenue (million), by Type 2024 & 2032
- Figure 20: South America Automobile Cooling Water Pipe Volume (K), by Type 2024 & 2032
- Figure 21: South America Automobile Cooling Water Pipe Revenue Share (%), by Type 2024 & 2032
- Figure 22: South America Automobile Cooling Water Pipe Volume Share (%), by Type 2024 & 2032
- Figure 23: South America Automobile Cooling Water Pipe Revenue (million), by Country 2024 & 2032
- Figure 24: South America Automobile Cooling Water Pipe Volume (K), by Country 2024 & 2032
- Figure 25: South America Automobile Cooling Water Pipe Revenue Share (%), by Country 2024 & 2032
- Figure 26: South America Automobile Cooling Water Pipe Volume Share (%), by Country 2024 & 2032
- Figure 27: Europe Automobile Cooling Water Pipe Revenue (million), by Application 2024 & 2032
- Figure 28: Europe Automobile Cooling Water Pipe Volume (K), by Application 2024 & 2032
- Figure 29: Europe Automobile Cooling Water Pipe Revenue Share (%), by Application 2024 & 2032
- Figure 30: Europe Automobile Cooling Water Pipe Volume Share (%), by Application 2024 & 2032
- Figure 31: Europe Automobile Cooling Water Pipe Revenue (million), by Type 2024 & 2032
- Figure 32: Europe Automobile Cooling Water Pipe Volume (K), by Type 2024 & 2032
- Figure 33: Europe Automobile Cooling Water Pipe Revenue Share (%), by Type 2024 & 2032
- Figure 34: Europe Automobile Cooling Water Pipe Volume Share (%), by Type 2024 & 2032
- Figure 35: Europe Automobile Cooling Water Pipe Revenue (million), by Country 2024 & 2032
- Figure 36: Europe Automobile Cooling Water Pipe Volume (K), by Country 2024 & 2032
- Figure 37: Europe Automobile Cooling Water Pipe Revenue Share (%), by Country 2024 & 2032
- Figure 38: Europe Automobile Cooling Water Pipe Volume Share (%), by Country 2024 & 2032
- Figure 39: Middle East & Africa Automobile Cooling Water Pipe Revenue (million), by Application 2024 & 2032
- Figure 40: Middle East & Africa Automobile Cooling Water Pipe Volume (K), by Application 2024 & 2032
- Figure 41: Middle East & Africa Automobile Cooling Water Pipe Revenue Share (%), by Application 2024 & 2032
- Figure 42: Middle East & Africa Automobile Cooling Water Pipe Volume Share (%), by Application 2024 & 2032
- Figure 43: Middle East & Africa Automobile Cooling Water Pipe Revenue (million), by Type 2024 & 2032
- Figure 44: Middle East & Africa Automobile Cooling Water Pipe Volume (K), by Type 2024 & 2032
- Figure 45: Middle East & Africa Automobile Cooling Water Pipe Revenue Share (%), by Type 2024 & 2032
- Figure 46: Middle East & Africa Automobile Cooling Water Pipe Volume Share (%), by Type 2024 & 2032
- Figure 47: Middle East & Africa Automobile Cooling Water Pipe Revenue (million), by Country 2024 & 2032
- Figure 48: Middle East & Africa Automobile Cooling Water Pipe Volume (K), by Country 2024 & 2032
- Figure 49: Middle East & Africa Automobile Cooling Water Pipe Revenue Share (%), by Country 2024 & 2032
- Figure 50: Middle East & Africa Automobile Cooling Water Pipe Volume Share (%), by Country 2024 & 2032
- Figure 51: Asia Pacific Automobile Cooling Water Pipe Revenue (million), by Application 2024 & 2032
- Figure 52: Asia Pacific Automobile Cooling Water Pipe Volume (K), by Application 2024 & 2032
- Figure 53: Asia Pacific Automobile Cooling Water Pipe Revenue Share (%), by Application 2024 & 2032
- Figure 54: Asia Pacific Automobile Cooling Water Pipe Volume Share (%), by Application 2024 & 2032
- Figure 55: Asia Pacific Automobile Cooling Water Pipe Revenue (million), by Type 2024 & 2032
- Figure 56: Asia Pacific Automobile Cooling Water Pipe Volume (K), by Type 2024 & 2032
- Figure 57: Asia Pacific Automobile Cooling Water Pipe Revenue Share (%), by Type 2024 & 2032
- Figure 58: Asia Pacific Automobile Cooling Water Pipe Volume Share (%), by Type 2024 & 2032
- Figure 59: Asia Pacific Automobile Cooling Water Pipe Revenue (million), by Country 2024 & 2032
- Figure 60: Asia Pacific Automobile Cooling Water Pipe Volume (K), by Country 2024 & 2032
- Figure 61: Asia Pacific Automobile Cooling Water Pipe Revenue Share (%), by Country 2024 & 2032
- Figure 62: Asia Pacific Automobile Cooling Water Pipe Volume Share (%), by Country 2024 & 2032
List of Tables
- Table 1: Global Automobile Cooling Water Pipe Revenue million Forecast, by Region 2019 & 2032
- Table 2: Global Automobile Cooling Water Pipe Volume K Forecast, by Region 2019 & 2032
- Table 3: Global Automobile Cooling Water Pipe Revenue million Forecast, by Application 2019 & 2032
- Table 4: Global Automobile Cooling Water Pipe Volume K Forecast, by Application 2019 & 2032
- Table 5: Global Automobile Cooling Water Pipe Revenue million Forecast, by Type 2019 & 2032
- Table 6: Global Automobile Cooling Water Pipe Volume K Forecast, by Type 2019 & 2032
- Table 7: Global Automobile Cooling Water Pipe Revenue million Forecast, by Region 2019 & 2032
- Table 8: Global Automobile Cooling Water Pipe Volume K Forecast, by Region 2019 & 2032
- Table 9: Global Automobile Cooling Water Pipe Revenue million Forecast, by Application 2019 & 2032
- Table 10: Global Automobile Cooling Water Pipe Volume K Forecast, by Application 2019 & 2032
- Table 11: Global Automobile Cooling Water Pipe Revenue million Forecast, by Type 2019 & 2032
- Table 12: Global Automobile Cooling Water Pipe Volume K Forecast, by Type 2019 & 2032
- Table 13: Global Automobile Cooling Water Pipe Revenue million Forecast, by Country 2019 & 2032
- Table 14: Global Automobile Cooling Water Pipe Volume K Forecast, by Country 2019 & 2032
- Table 15: United States Automobile Cooling Water Pipe Revenue (million) Forecast, by Application 2019 & 2032
- Table 16: United States Automobile Cooling Water Pipe Volume (K) Forecast, by Application 2019 & 2032
- Table 17: Canada Automobile Cooling Water Pipe Revenue (million) Forecast, by Application 2019 & 2032
- Table 18: Canada Automobile Cooling Water Pipe Volume (K) Forecast, by Application 2019 & 2032
- Table 19: Mexico Automobile Cooling Water Pipe Revenue (million) Forecast, by Application 2019 & 2032
- Table 20: Mexico Automobile Cooling Water Pipe Volume (K) Forecast, by Application 2019 & 2032
- Table 21: Global Automobile Cooling Water Pipe Revenue million Forecast, by Application 2019 & 2032
- Table 22: Global Automobile Cooling Water Pipe Volume K Forecast, by Application 2019 & 2032
- Table 23: Global Automobile Cooling Water Pipe Revenue million Forecast, by Type 2019 & 2032
- Table 24: Global Automobile Cooling Water Pipe Volume K Forecast, by Type 2019 & 2032
- Table 25: Global Automobile Cooling Water Pipe Revenue million Forecast, by Country 2019 & 2032
- Table 26: Global Automobile Cooling Water Pipe Volume K Forecast, by Country 2019 & 2032
- Table 27: Brazil Automobile Cooling Water Pipe Revenue (million) Forecast, by Application 2019 & 2032
- Table 28: Brazil Automobile Cooling Water Pipe Volume (K) Forecast, by Application 2019 & 2032
- Table 29: Argentina Automobile Cooling Water Pipe Revenue (million) Forecast, by Application 2019 & 2032
- Table 30: Argentina Automobile Cooling Water Pipe Volume (K) Forecast, by Application 2019 & 2032
- Table 31: Rest of South America Automobile Cooling Water Pipe Revenue (million) Forecast, by Application 2019 & 2032
- Table 32: Rest of South America Automobile Cooling Water Pipe Volume (K) Forecast, by Application 2019 & 2032
- Table 33: Global Automobile Cooling Water Pipe Revenue million Forecast, by Application 2019 & 2032
- Table 34: Global Automobile Cooling Water Pipe Volume K Forecast, by Application 2019 & 2032
- Table 35: Global Automobile Cooling Water Pipe Revenue million Forecast, by Type 2019 & 2032
- Table 36: Global Automobile Cooling Water Pipe Volume K Forecast, by Type 2019 & 2032
- Table 37: Global Automobile Cooling Water Pipe Revenue million Forecast, by Country 2019 & 2032
- Table 38: Global Automobile Cooling Water Pipe Volume K Forecast, by Country 2019 & 2032
- Table 39: United Kingdom Automobile Cooling Water Pipe Revenue (million) Forecast, by Application 2019 & 2032
- Table 40: United Kingdom Automobile Cooling Water Pipe Volume (K) Forecast, by Application 2019 & 2032
- Table 41: Germany Automobile Cooling Water Pipe Revenue (million) Forecast, by Application 2019 & 2032
- Table 42: Germany Automobile Cooling Water Pipe Volume (K) Forecast, by Application 2019 & 2032
- Table 43: France Automobile Cooling Water Pipe Revenue (million) Forecast, by Application 2019 & 2032
- Table 44: France Automobile Cooling Water Pipe Volume (K) Forecast, by Application 2019 & 2032
- Table 45: Italy Automobile Cooling Water Pipe Revenue (million) Forecast, by Application 2019 & 2032
- Table 46: Italy Automobile Cooling Water Pipe Volume (K) Forecast, by Application 2019 & 2032
- Table 47: Spain Automobile Cooling Water Pipe Revenue (million) Forecast, by Application 2019 & 2032
- Table 48: Spain Automobile Cooling Water Pipe Volume (K) Forecast, by Application 2019 & 2032
- Table 49: Russia Automobile Cooling Water Pipe Revenue (million) Forecast, by Application 2019 & 2032
- Table 50: Russia Automobile Cooling Water Pipe Volume (K) Forecast, by Application 2019 & 2032
- Table 51: Benelux Automobile Cooling Water Pipe Revenue (million) Forecast, by Application 2019 & 2032
- Table 52: Benelux Automobile Cooling Water Pipe Volume (K) Forecast, by Application 2019 & 2032
- Table 53: Nordics Automobile Cooling Water Pipe Revenue (million) Forecast, by Application 2019 & 2032
- Table 54: Nordics Automobile Cooling Water Pipe Volume (K) Forecast, by Application 2019 & 2032
- Table 55: Rest of Europe Automobile Cooling Water Pipe Revenue (million) Forecast, by Application 2019 & 2032
- Table 56: Rest of Europe Automobile Cooling Water Pipe Volume (K) Forecast, by Application 2019 & 2032
- Table 57: Global Automobile Cooling Water Pipe Revenue million Forecast, by Application 2019 & 2032
- Table 58: Global Automobile Cooling Water Pipe Volume K Forecast, by Application 2019 & 2032
- Table 59: Global Automobile Cooling Water Pipe Revenue million Forecast, by Type 2019 & 2032
- Table 60: Global Automobile Cooling Water Pipe Volume K Forecast, by Type 2019 & 2032
- Table 61: Global Automobile Cooling Water Pipe Revenue million Forecast, by Country 2019 & 2032
- Table 62: Global Automobile Cooling Water Pipe Volume K Forecast, by Country 2019 & 2032
- Table 63: Turkey Automobile Cooling Water Pipe Revenue (million) Forecast, by Application 2019 & 2032
- Table 64: Turkey Automobile Cooling Water Pipe Volume (K) Forecast, by Application 2019 & 2032
- Table 65: Israel Automobile Cooling Water Pipe Revenue (million) Forecast, by Application 2019 & 2032
- Table 66: Israel Automobile Cooling Water Pipe Volume (K) Forecast, by Application 2019 & 2032
- Table 67: GCC Automobile Cooling Water Pipe Revenue (million) Forecast, by Application 2019 & 2032
- Table 68: GCC Automobile Cooling Water Pipe Volume (K) Forecast, by Application 2019 & 2032
- Table 69: North Africa Automobile Cooling Water Pipe Revenue (million) Forecast, by Application 2019 & 2032
- Table 70: North Africa Automobile Cooling Water Pipe Volume (K) Forecast, by Application 2019 & 2032
- Table 71: South Africa Automobile Cooling Water Pipe Revenue (million) Forecast, by Application 2019 & 2032
- Table 72: South Africa Automobile Cooling Water Pipe Volume (K) Forecast, by Application 2019 & 2032
- Table 73: Rest of Middle East & Africa Automobile Cooling Water Pipe Revenue (million) Forecast, by Application 2019 & 2032
- Table 74: Rest of Middle East & Africa Automobile Cooling Water Pipe Volume (K) Forecast, by Application 2019 & 2032
- Table 75: Global Automobile Cooling Water Pipe Revenue million Forecast, by Application 2019 & 2032
- Table 76: Global Automobile Cooling Water Pipe Volume K Forecast, by Application 2019 & 2032
- Table 77: Global Automobile Cooling Water Pipe Revenue million Forecast, by Type 2019 & 2032
- Table 78: Global Automobile Cooling Water Pipe Volume K Forecast, by Type 2019 & 2032
- Table 79: Global Automobile Cooling Water Pipe Revenue million Forecast, by Country 2019 & 2032
- Table 80: Global Automobile Cooling Water Pipe Volume K Forecast, by Country 2019 & 2032
- Table 81: China Automobile Cooling Water Pipe Revenue (million) Forecast, by Application 2019 & 2032
- Table 82: China Automobile Cooling Water Pipe Volume (K) Forecast, by Application 2019 & 2032
- Table 83: India Automobile Cooling Water Pipe Revenue (million) Forecast, by Application 2019 & 2032
- Table 84: India Automobile Cooling Water Pipe Volume (K) Forecast, by Application 2019 & 2032
- Table 85: Japan Automobile Cooling Water Pipe Revenue (million) Forecast, by Application 2019 & 2032
- Table 86: Japan Automobile Cooling Water Pipe Volume (K) Forecast, by Application 2019 & 2032
- Table 87: South Korea Automobile Cooling Water Pipe Revenue (million) Forecast, by Application 2019 & 2032
- Table 88: South Korea Automobile Cooling Water Pipe Volume (K) Forecast, by Application 2019 & 2032
- Table 89: ASEAN Automobile Cooling Water Pipe Revenue (million) Forecast, by Application 2019 & 2032
- Table 90: ASEAN Automobile Cooling Water Pipe Volume (K) Forecast, by Application 2019 & 2032
- Table 91: Oceania Automobile Cooling Water Pipe Revenue (million) Forecast, by Application 2019 & 2032
- Table 92: Oceania Automobile Cooling Water Pipe Volume (K) Forecast, by Application 2019 & 2032
- Table 93: Rest of Asia Pacific Automobile Cooling Water Pipe Revenue (million) Forecast, by Application 2019 & 2032
- Table 94: Rest of Asia Pacific Automobile Cooling Water Pipe Volume (K) Forecast, by Application 2019 & 2032
Frequently Asked Questions
1. What is the projected Compound Annual Growth Rate (CAGR) of the Automobile Cooling Water Pipe?
The projected CAGR is approximately XXX%.
2. Which companies are prominent players in the Automobile Cooling Water Pipe?
Key companies in the market include Continental, ILPEA, NORMA, Tl Fluid Systems, Teklas, Kayser, PASS GmbH, Fraenkisch, VOSS Automotive, ManuliHydraulics, Pivot Automotive, Chinaust, Sulian Plastic, Pengling Group, Chuanhuan Technology, Zhongding Group, KUS, Shanghai Sanda Automobile Parts.
3. What are the main segments of the Automobile Cooling Water Pipe?
The market segments include Application, Type.
4. Can you provide details about the market size?
The market size is estimated to be USD XXX million as of 2022.
5. What are some drivers contributing to market growth?
N/A
6. What are the notable trends driving market growth?
N/A
7. Are there any restraints impacting market growth?
N/A
8. Can you provide examples of recent developments in the market?
N/A
9. What pricing options are available for accessing the report?
Pricing options include single-user, multi-user, and enterprise licenses priced at USD 3950.00, USD 5925.00, and USD 7900.00 respectively.
10. Is the market size provided in terms of value or volume?
The market size is provided in terms of value, measured in million and volume, measured in K.
11. Are there any specific market keywords associated with the report?
Yes, the market keyword associated with the report is "Automobile Cooling Water Pipe," which aids in identifying and referencing the specific market segment covered.
12. How do I determine which pricing option suits my needs best?
The pricing options vary based on user requirements and access needs. Individual users may opt for single-user licenses, while businesses requiring broader access may choose multi-user or enterprise licenses for cost-effective access to the report.
13. Are there any additional resources or data provided in the Automobile Cooling Water Pipe report?
While the report offers comprehensive insights, it's advisable to review the specific contents or supplementary materials provided to ascertain if additional resources or data are available.
14. How can I stay updated on further developments or reports in the Automobile Cooling Water Pipe?
To stay informed about further developments, trends, and reports in the Automobile Cooling Water Pipe, consider subscribing to industry newsletters, following relevant companies and organizations, or regularly checking reputable industry news sources and publications.
Methodology
Step 1 - Identification of Relevant Samples Size from Population Database


Step 2 - Approaches for Defining Global Market Size (Value, Volume* & Price*)

Note*: In applicable scenarios
Step 3 - Data Sources
Primary Research
- Web Analytics
- Survey Reports
- Research Institute
- Latest Research Reports
- Opinion Leaders
Secondary Research
- Annual Reports
- White Paper
- Latest Press Release
- Industry Association
- Paid Database
- Investor Presentations

Step 4 - Data Triangulation
Involves using different sources of information in order to increase the validity of a study
These sources are likely to be stakeholders in a program - participants, other researchers, program staff, other community members, and so on.
Then we put all data in single framework & apply various statistical tools to find out the dynamic on the market.
During the analysis stage, feedback from the stakeholder groups would be compared to determine areas of agreement as well as areas of divergence
