

Key Insights
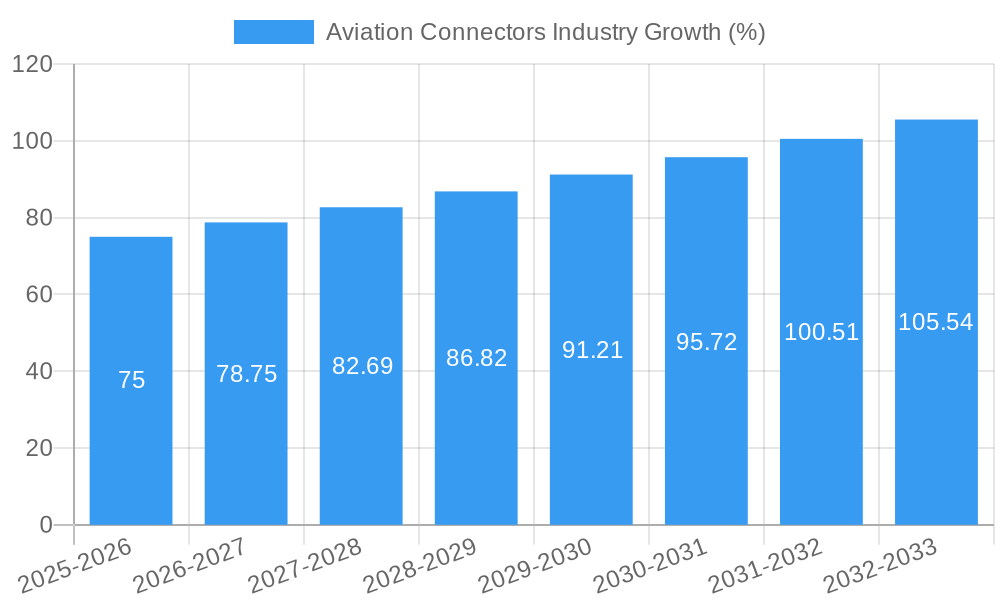
The global aviation connectors market, valued at approximately $XX million in 2025, is projected to experience robust growth, driven by the increasing demand for advanced aircraft technologies and a rising number of air travel passengers. A compound annual growth rate (CAGR) of 5.00% from 2025 to 2033 suggests a significant market expansion over the forecast period. Key growth drivers include the integration of sophisticated avionics systems, the rise of electric and hybrid-electric aircraft, and increasing investments in aerospace infrastructure globally. The market is segmented by connector shape (circular, rectangular) and type (PCB, RF connectors, fiber optic, others). Circular connectors currently dominate due to their reliability and suitability in harsh environments, while the demand for high-speed data transmission is fueling the growth of fiber optic connectors. Regional growth is expected to be diverse, with North America and Europe maintaining significant market share due to established aerospace industries, but Asia-Pacific is poised for rapid expansion driven by burgeoning economies and investments in air travel infrastructure. Restraints to market growth may include supply chain disruptions, stringent regulatory compliance requirements, and the high cost of advanced connector technologies.
The competitive landscape is characterized by both established players and emerging companies. Major players such as Conesys Inc, SOURIAU SAS, Carlisle Interconnect Technologies, Rosenberger Group, Amphenol Corporation, ITT Inc, TE Connectivity Ltd, Cooper Industries (Eaton Corporation), Radiall SA, and Smiths Interconnect Inc are focused on innovation, strategic partnerships, and mergers & acquisitions to enhance their market positions. The market is likely to see further consolidation and innovation in materials and designs to address the increasing demands for miniaturization, improved performance, and enhanced reliability in next-generation aircraft. The continuous need for enhanced safety and operational efficiency within the aviation industry will further stimulate growth and technological advancements in the aviation connectors market.

Aviation Connectors Industry Market Report: 2019-2033
This comprehensive report provides a detailed analysis of the Aviation Connectors industry, encompassing market dynamics, growth trends, regional segmentation, product landscape, key players, and future outlook. The study period covers 2019-2033, with 2025 as the base and estimated year. The report is crucial for industry professionals, investors, and strategic decision-makers seeking a deep understanding of this dynamic market. The total market size is projected at xx million units by 2033.
Aviation Connectors Industry Market Dynamics & Structure
The aviation connectors market is characterized by moderate concentration, with a few major players holding significant market share. Technological innovation, driven by the demand for lighter, more reliable, and higher-performance connectors, is a key driver. Stringent regulatory frameworks, particularly regarding safety and certification, heavily influence market dynamics. Competitive pressure exists from substitute materials and technologies, while the industry witnesses periodic mergers and acquisitions (M&A) activity aimed at expanding market reach and technological capabilities. The parent market is the broader aerospace and defense industry, while the child market encompasses various aircraft segments (commercial, military, general aviation).
- Market Concentration: The top 5 players hold approximately xx% of the market share in 2025.
- Technological Innovation: Focus on miniaturization, high-speed data transmission, and improved environmental resistance.
- Regulatory Framework: Stringent safety standards (e.g., DO-160) and certification processes.
- M&A Activity: An average of xx M&A deals per year were recorded during 2019-2024, indicating consolidation trends.
- Substitute Technologies: Emerging technologies like wireless communication pose a potential threat, albeit limited at present.
Aviation Connectors Industry Growth Trends & Insights
The aviation connectors market has experienced steady growth over the historical period (2019-2024), driven by the increasing demand for new aircraft and the modernization of existing fleets. The adoption rate of advanced connector technologies, such as high-speed data connectors and fiber optic connectors, is gradually increasing. Technological disruptions, including the development of lightweight materials and improved manufacturing processes, are further boosting market growth. Consumer behavior shifts towards more technologically advanced aircraft contribute to rising demand for high-performance connectors.
- Market Size Evolution: The market size grew from xx million units in 2019 to xx million units in 2024, registering a CAGR of xx%.
- Adoption Rates: Adoption of Fiber Optic connectors is projected to increase at a CAGR of xx% from 2025 to 2033.
- Technological Disruptions: 3D printing and advanced material science are improving connector design and efficiency.
- Consumer Behavior: Airlines' focus on enhanced passenger experience and operational efficiency drives the demand for improved connectivity.
Dominant Regions, Countries, or Segments in Aviation Connectors Industry
North America currently dominates the aviation connectors market, followed by Europe. This dominance is attributed to a strong aerospace manufacturing base, robust R&D activities, and a high concentration of major connector manufacturers. Within the segments, circular connectors currently hold the largest market share due to their wide applicability in various aircraft systems. However, the RF connectors segment is projected to experience significant growth owing to increasing demand for high-speed data transmission in advanced aircraft systems.
- Key Drivers in North America: Strong aerospace industry presence, high investment in R&D, and stringent safety standards.
- Key Drivers in Europe: Significant aircraft manufacturing activity, advanced technological capabilities, and governmental support for aerospace innovation.
- Dominant Segment (Shape): Circular connectors account for approximately xx% of the market share in 2025.
- Fastest-Growing Segment (Type): RF connectors are projected to achieve the highest CAGR (xx%) during the forecast period.
Aviation Connectors Industry Product Landscape
The aviation connectors market offers a diverse range of products, including circular, rectangular, PCB, RF, fiber optic, and other specialized connectors. Product innovations focus on improving durability, weight reduction, and performance. Key features include improved sealing against harsh environmental conditions, higher current carrying capacity, and increased bandwidth for data transmission. Unique selling propositions include enhanced reliability, reduced weight, and compliance with stringent aviation standards.
Key Drivers, Barriers & Challenges in Aviation Connectors Industry
Key Drivers: Growing demand for new and modernized aircraft, increasing adoption of advanced avionics, stringent safety regulations driving demand for high-quality connectors, and the increasing need for reliable data communication in aircraft systems.
Challenges: High material costs, complex certification processes, stringent quality control requirements, and competitive pressures from both established and emerging players. Supply chain disruptions resulting from geopolitical instability are also a significant challenge, leading to an estimated xx% increase in production costs in 2024.
Emerging Opportunities in Aviation Connectors Industry
The increasing adoption of electric and hybrid-electric aircraft presents significant opportunities for the aviation connectors market. The integration of advanced sensor technologies and improved connectivity solutions in aircraft systems will also drive growth. Furthermore, the expansion of unmanned aerial vehicles (UAVs) and the development of next-generation air traffic management systems offer lucrative prospects for specialized aviation connectors.
Growth Accelerators in the Aviation Connectors Industry
Technological advancements such as the development of miniaturized, lightweight connectors with high-speed data transmission capabilities are major growth catalysts. Strategic partnerships between connector manufacturers and aircraft manufacturers are essential for driving innovation and market penetration. Expansion into new geographic markets and the development of customized solutions for specific aircraft applications are also important growth strategies.
Key Players Shaping the Aviation Connectors Industry Market
- Conesys Inc
- SOURIAU SAS
- Carlisle Interconnect Technologies (Carlisle Companies Inc)
- Rosenberger Group
- Amphenol Corporation
- ITT Inc
- TE Connectivity Ltd
- Cooper Industries (Eaton Corporation)
- Radiall SA
- Smiths Interconnect Inc (Smiths Group PLC)
Notable Milestones in Aviation Connectors Industry Sector
- 2022-Q3: Amphenol Corporation launched a new series of lightweight, high-performance connectors for next-generation aircraft.
- 2021-Q4: TE Connectivity acquired a smaller connector manufacturer, expanding its product portfolio.
- 2020-Q1: Industry-wide supply chain disruptions due to the COVID-19 pandemic impacted production timelines and costs.
In-Depth Aviation Connectors Industry Market Outlook
The aviation connectors market is poised for continued growth driven by technological advancements, increasing demand for new aircraft, and the modernization of existing fleets. Strategic partnerships, expansion into new markets, and focus on high-performance and lightweight solutions are key strategic opportunities. The market’s future success hinges on addressing ongoing supply chain vulnerabilities and adapting to the evolving demands of the aerospace industry.
Aviation Connectors Industry Segmentation
-
1. Type
- 1.1. PCB (Printed Circuit Board)
- 1.2. RF Connectors
- 1.3. Fiber Optic
- 1.4. Other Types
-
2. Shape
- 2.1. Circular
- 2.2. Rectangular
Aviation Connectors Industry Segmentation By Geography
-
1. North America
- 1.1. United States
- 1.2. Canada
-
2. Europe
- 2.1. United Kingdom
- 2.2. France
- 2.3. Germany
- 2.4. Italy
- 2.5. Rest of Europe
-
3. Asia Pacific
- 3.1. Japan
- 3.2. China
- 3.3. Rest of Asia Pacific
-
4. Rest of the World
- 4.1. Latin America
- 4.2. Middle East

Aviation Connectors Industry REPORT HIGHLIGHTS
| Aspects | Details |
|---|---|
| Study Period | 2019-2033 |
| Base Year | 2024 |
| Estimated Year | 2025 |
| Forecast Period | 2025-2033 |
| Historical Period | 2019-2024 |
| Growth Rate | CAGR of 5.00% from 2019-2033 |
| Segmentation |
|
Table of Contents
- 1. Introduction
- 1.1. Research Scope
- 1.2. Market Segmentation
- 1.3. Research Methodology
- 1.4. Definitions and Assumptions
- 2. Executive Summary
- 2.1. Introduction
- 3. Market Dynamics
- 3.1. Introduction
- 3.2. Market Drivers
- 3.2.1. ; Increase in the Demand for Aircraft; Shift towards Electric Architecture and Technology
- 3.3. Market Restrains
- 3.3.1. ; Existing Backlog of Aircraft Deliveries
- 3.4. Market Trends
- 3.4.1. Fiber Optic Connectors are Expected to Register a Significant Growth Rate
- 4. Market Factor Analysis
- 4.1. Porters Five Forces
- 4.2. Supply/Value Chain
- 4.3. PESTEL analysis
- 4.4. Market Entropy
- 4.5. Patent/Trademark Analysis
- 5. Global Aviation Connectors Industry Analysis, Insights and Forecast, 2019-2031
- 5.1. Market Analysis, Insights and Forecast - by Type
- 5.1.1. PCB (Printed Circuit Board)
- 5.1.2. RF Connectors
- 5.1.3. Fiber Optic
- 5.1.4. Other Types
- 5.2. Market Analysis, Insights and Forecast - by Shape
- 5.2.1. Circular
- 5.2.2. Rectangular
- 5.3. Market Analysis, Insights and Forecast - by Region
- 5.3.1. North America
- 5.3.2. Europe
- 5.3.3. Asia Pacific
- 5.3.4. Rest of the World
- 5.1. Market Analysis, Insights and Forecast - by Type
- 6. North America Aviation Connectors Industry Analysis, Insights and Forecast, 2019-2031
- 6.1. Market Analysis, Insights and Forecast - by Type
- 6.1.1. PCB (Printed Circuit Board)
- 6.1.2. RF Connectors
- 6.1.3. Fiber Optic
- 6.1.4. Other Types
- 6.2. Market Analysis, Insights and Forecast - by Shape
- 6.2.1. Circular
- 6.2.2. Rectangular
- 6.1. Market Analysis, Insights and Forecast - by Type
- 7. Europe Aviation Connectors Industry Analysis, Insights and Forecast, 2019-2031
- 7.1. Market Analysis, Insights and Forecast - by Type
- 7.1.1. PCB (Printed Circuit Board)
- 7.1.2. RF Connectors
- 7.1.3. Fiber Optic
- 7.1.4. Other Types
- 7.2. Market Analysis, Insights and Forecast - by Shape
- 7.2.1. Circular
- 7.2.2. Rectangular
- 7.1. Market Analysis, Insights and Forecast - by Type
- 8. Asia Pacific Aviation Connectors Industry Analysis, Insights and Forecast, 2019-2031
- 8.1. Market Analysis, Insights and Forecast - by Type
- 8.1.1. PCB (Printed Circuit Board)
- 8.1.2. RF Connectors
- 8.1.3. Fiber Optic
- 8.1.4. Other Types
- 8.2. Market Analysis, Insights and Forecast - by Shape
- 8.2.1. Circular
- 8.2.2. Rectangular
- 8.1. Market Analysis, Insights and Forecast - by Type
- 9. Rest of the World Aviation Connectors Industry Analysis, Insights and Forecast, 2019-2031
- 9.1. Market Analysis, Insights and Forecast - by Type
- 9.1.1. PCB (Printed Circuit Board)
- 9.1.2. RF Connectors
- 9.1.3. Fiber Optic
- 9.1.4. Other Types
- 9.2. Market Analysis, Insights and Forecast - by Shape
- 9.2.1. Circular
- 9.2.2. Rectangular
- 9.1. Market Analysis, Insights and Forecast - by Type
- 10. North America Aviation Connectors Industry Analysis, Insights and Forecast, 2019-2031
- 10.1. Market Analysis, Insights and Forecast - By Country/Sub-region
- 10.1.1 United States
- 10.1.2 Canada
- 10.1.3 Mexico
- 11. Europe Aviation Connectors Industry Analysis, Insights and Forecast, 2019-2031
- 11.1. Market Analysis, Insights and Forecast - By Country/Sub-region
- 11.1.1 Germany
- 11.1.2 United Kingdom
- 11.1.3 France
- 11.1.4 Spain
- 11.1.5 Italy
- 11.1.6 Spain
- 11.1.7 Belgium
- 11.1.8 Netherland
- 11.1.9 Nordics
- 11.1.10 Rest of Europe
- 12. Asia Pacific Aviation Connectors Industry Analysis, Insights and Forecast, 2019-2031
- 12.1. Market Analysis, Insights and Forecast - By Country/Sub-region
- 12.1.1 China
- 12.1.2 Japan
- 12.1.3 India
- 12.1.4 South Korea
- 12.1.5 Southeast Asia
- 12.1.6 Australia
- 12.1.7 Indonesia
- 12.1.8 Phillipes
- 12.1.9 Singapore
- 12.1.10 Thailandc
- 12.1.11 Rest of Asia Pacific
- 13. South America Aviation Connectors Industry Analysis, Insights and Forecast, 2019-2031
- 13.1. Market Analysis, Insights and Forecast - By Country/Sub-region
- 13.1.1 Brazil
- 13.1.2 Argentina
- 13.1.3 Peru
- 13.1.4 Chile
- 13.1.5 Colombia
- 13.1.6 Ecuador
- 13.1.7 Venezuela
- 13.1.8 Rest of South America
- 14. MEA Aviation Connectors Industry Analysis, Insights and Forecast, 2019-2031
- 14.1. Market Analysis, Insights and Forecast - By Country/Sub-region
- 14.1.1 United Arab Emirates
- 14.1.2 Saudi Arabia
- 14.1.3 South Africa
- 14.1.4 Rest of Middle East and Africa
- 15. Competitive Analysis
- 15.1. Global Market Share Analysis 2024
- 15.2. Company Profiles
- 15.2.1 Conesys Inc
- 15.2.1.1. Overview
- 15.2.1.2. Products
- 15.2.1.3. SWOT Analysis
- 15.2.1.4. Recent Developments
- 15.2.1.5. Financials (Based on Availability)
- 15.2.2 SOURIAU SAS
- 15.2.2.1. Overview
- 15.2.2.2. Products
- 15.2.2.3. SWOT Analysis
- 15.2.2.4. Recent Developments
- 15.2.2.5. Financials (Based on Availability)
- 15.2.3 Carlisle Interconnect Technologies (Carlisle Companies Inc )
- 15.2.3.1. Overview
- 15.2.3.2. Products
- 15.2.3.3. SWOT Analysis
- 15.2.3.4. Recent Developments
- 15.2.3.5. Financials (Based on Availability)
- 15.2.4 Rosenberger Group
- 15.2.4.1. Overview
- 15.2.4.2. Products
- 15.2.4.3. SWOT Analysis
- 15.2.4.4. Recent Developments
- 15.2.4.5. Financials (Based on Availability)
- 15.2.5 Amphenol Corporation ITT Inc
- 15.2.5.1. Overview
- 15.2.5.2. Products
- 15.2.5.3. SWOT Analysis
- 15.2.5.4. Recent Developments
- 15.2.5.5. Financials (Based on Availability)
- 15.2.6 TE Connectivity Ltd
- 15.2.6.1. Overview
- 15.2.6.2. Products
- 15.2.6.3. SWOT Analysis
- 15.2.6.4. Recent Developments
- 15.2.6.5. Financials (Based on Availability)
- 15.2.7 Cooper Industries (Eaton Corporation)
- 15.2.7.1. Overview
- 15.2.7.2. Products
- 15.2.7.3. SWOT Analysis
- 15.2.7.4. Recent Developments
- 15.2.7.5. Financials (Based on Availability)
- 15.2.8 Radiall SA
- 15.2.8.1. Overview
- 15.2.8.2. Products
- 15.2.8.3. SWOT Analysis
- 15.2.8.4. Recent Developments
- 15.2.8.5. Financials (Based on Availability)
- 15.2.9 Smiths Interconnect Inc (Smiths Group PLC)
- 15.2.9.1. Overview
- 15.2.9.2. Products
- 15.2.9.3. SWOT Analysis
- 15.2.9.4. Recent Developments
- 15.2.9.5. Financials (Based on Availability)
- 15.2.1 Conesys Inc
List of Figures
- Figure 1: Global Aviation Connectors Industry Revenue Breakdown (Million, %) by Region 2024 & 2032
- Figure 2: Global Aviation Connectors Industry Volume Breakdown (K Unit, %) by Region 2024 & 2032
- Figure 3: North America Aviation Connectors Industry Revenue (Million), by Country 2024 & 2032
- Figure 4: North America Aviation Connectors Industry Volume (K Unit), by Country 2024 & 2032
- Figure 5: North America Aviation Connectors Industry Revenue Share (%), by Country 2024 & 2032
- Figure 6: North America Aviation Connectors Industry Volume Share (%), by Country 2024 & 2032
- Figure 7: Europe Aviation Connectors Industry Revenue (Million), by Country 2024 & 2032
- Figure 8: Europe Aviation Connectors Industry Volume (K Unit), by Country 2024 & 2032
- Figure 9: Europe Aviation Connectors Industry Revenue Share (%), by Country 2024 & 2032
- Figure 10: Europe Aviation Connectors Industry Volume Share (%), by Country 2024 & 2032
- Figure 11: Asia Pacific Aviation Connectors Industry Revenue (Million), by Country 2024 & 2032
- Figure 12: Asia Pacific Aviation Connectors Industry Volume (K Unit), by Country 2024 & 2032
- Figure 13: Asia Pacific Aviation Connectors Industry Revenue Share (%), by Country 2024 & 2032
- Figure 14: Asia Pacific Aviation Connectors Industry Volume Share (%), by Country 2024 & 2032
- Figure 15: South America Aviation Connectors Industry Revenue (Million), by Country 2024 & 2032
- Figure 16: South America Aviation Connectors Industry Volume (K Unit), by Country 2024 & 2032
- Figure 17: South America Aviation Connectors Industry Revenue Share (%), by Country 2024 & 2032
- Figure 18: South America Aviation Connectors Industry Volume Share (%), by Country 2024 & 2032
- Figure 19: MEA Aviation Connectors Industry Revenue (Million), by Country 2024 & 2032
- Figure 20: MEA Aviation Connectors Industry Volume (K Unit), by Country 2024 & 2032
- Figure 21: MEA Aviation Connectors Industry Revenue Share (%), by Country 2024 & 2032
- Figure 22: MEA Aviation Connectors Industry Volume Share (%), by Country 2024 & 2032
- Figure 23: North America Aviation Connectors Industry Revenue (Million), by Type 2024 & 2032
- Figure 24: North America Aviation Connectors Industry Volume (K Unit), by Type 2024 & 2032
- Figure 25: North America Aviation Connectors Industry Revenue Share (%), by Type 2024 & 2032
- Figure 26: North America Aviation Connectors Industry Volume Share (%), by Type 2024 & 2032
- Figure 27: North America Aviation Connectors Industry Revenue (Million), by Shape 2024 & 2032
- Figure 28: North America Aviation Connectors Industry Volume (K Unit), by Shape 2024 & 2032
- Figure 29: North America Aviation Connectors Industry Revenue Share (%), by Shape 2024 & 2032
- Figure 30: North America Aviation Connectors Industry Volume Share (%), by Shape 2024 & 2032
- Figure 31: North America Aviation Connectors Industry Revenue (Million), by Country 2024 & 2032
- Figure 32: North America Aviation Connectors Industry Volume (K Unit), by Country 2024 & 2032
- Figure 33: North America Aviation Connectors Industry Revenue Share (%), by Country 2024 & 2032
- Figure 34: North America Aviation Connectors Industry Volume Share (%), by Country 2024 & 2032
- Figure 35: Europe Aviation Connectors Industry Revenue (Million), by Type 2024 & 2032
- Figure 36: Europe Aviation Connectors Industry Volume (K Unit), by Type 2024 & 2032
- Figure 37: Europe Aviation Connectors Industry Revenue Share (%), by Type 2024 & 2032
- Figure 38: Europe Aviation Connectors Industry Volume Share (%), by Type 2024 & 2032
- Figure 39: Europe Aviation Connectors Industry Revenue (Million), by Shape 2024 & 2032
- Figure 40: Europe Aviation Connectors Industry Volume (K Unit), by Shape 2024 & 2032
- Figure 41: Europe Aviation Connectors Industry Revenue Share (%), by Shape 2024 & 2032
- Figure 42: Europe Aviation Connectors Industry Volume Share (%), by Shape 2024 & 2032
- Figure 43: Europe Aviation Connectors Industry Revenue (Million), by Country 2024 & 2032
- Figure 44: Europe Aviation Connectors Industry Volume (K Unit), by Country 2024 & 2032
- Figure 45: Europe Aviation Connectors Industry Revenue Share (%), by Country 2024 & 2032
- Figure 46: Europe Aviation Connectors Industry Volume Share (%), by Country 2024 & 2032
- Figure 47: Asia Pacific Aviation Connectors Industry Revenue (Million), by Type 2024 & 2032
- Figure 48: Asia Pacific Aviation Connectors Industry Volume (K Unit), by Type 2024 & 2032
- Figure 49: Asia Pacific Aviation Connectors Industry Revenue Share (%), by Type 2024 & 2032
- Figure 50: Asia Pacific Aviation Connectors Industry Volume Share (%), by Type 2024 & 2032
- Figure 51: Asia Pacific Aviation Connectors Industry Revenue (Million), by Shape 2024 & 2032
- Figure 52: Asia Pacific Aviation Connectors Industry Volume (K Unit), by Shape 2024 & 2032
- Figure 53: Asia Pacific Aviation Connectors Industry Revenue Share (%), by Shape 2024 & 2032
- Figure 54: Asia Pacific Aviation Connectors Industry Volume Share (%), by Shape 2024 & 2032
- Figure 55: Asia Pacific Aviation Connectors Industry Revenue (Million), by Country 2024 & 2032
- Figure 56: Asia Pacific Aviation Connectors Industry Volume (K Unit), by Country 2024 & 2032
- Figure 57: Asia Pacific Aviation Connectors Industry Revenue Share (%), by Country 2024 & 2032
- Figure 58: Asia Pacific Aviation Connectors Industry Volume Share (%), by Country 2024 & 2032
- Figure 59: Rest of the World Aviation Connectors Industry Revenue (Million), by Type 2024 & 2032
- Figure 60: Rest of the World Aviation Connectors Industry Volume (K Unit), by Type 2024 & 2032
- Figure 61: Rest of the World Aviation Connectors Industry Revenue Share (%), by Type 2024 & 2032
- Figure 62: Rest of the World Aviation Connectors Industry Volume Share (%), by Type 2024 & 2032
- Figure 63: Rest of the World Aviation Connectors Industry Revenue (Million), by Shape 2024 & 2032
- Figure 64: Rest of the World Aviation Connectors Industry Volume (K Unit), by Shape 2024 & 2032
- Figure 65: Rest of the World Aviation Connectors Industry Revenue Share (%), by Shape 2024 & 2032
- Figure 66: Rest of the World Aviation Connectors Industry Volume Share (%), by Shape 2024 & 2032
- Figure 67: Rest of the World Aviation Connectors Industry Revenue (Million), by Country 2024 & 2032
- Figure 68: Rest of the World Aviation Connectors Industry Volume (K Unit), by Country 2024 & 2032
- Figure 69: Rest of the World Aviation Connectors Industry Revenue Share (%), by Country 2024 & 2032
- Figure 70: Rest of the World Aviation Connectors Industry Volume Share (%), by Country 2024 & 2032
List of Tables
- Table 1: Global Aviation Connectors Industry Revenue Million Forecast, by Region 2019 & 2032
- Table 2: Global Aviation Connectors Industry Volume K Unit Forecast, by Region 2019 & 2032
- Table 3: Global Aviation Connectors Industry Revenue Million Forecast, by Type 2019 & 2032
- Table 4: Global Aviation Connectors Industry Volume K Unit Forecast, by Type 2019 & 2032
- Table 5: Global Aviation Connectors Industry Revenue Million Forecast, by Shape 2019 & 2032
- Table 6: Global Aviation Connectors Industry Volume K Unit Forecast, by Shape 2019 & 2032
- Table 7: Global Aviation Connectors Industry Revenue Million Forecast, by Region 2019 & 2032
- Table 8: Global Aviation Connectors Industry Volume K Unit Forecast, by Region 2019 & 2032
- Table 9: Global Aviation Connectors Industry Revenue Million Forecast, by Country 2019 & 2032
- Table 10: Global Aviation Connectors Industry Volume K Unit Forecast, by Country 2019 & 2032
- Table 11: United States Aviation Connectors Industry Revenue (Million) Forecast, by Application 2019 & 2032
- Table 12: United States Aviation Connectors Industry Volume (K Unit) Forecast, by Application 2019 & 2032
- Table 13: Canada Aviation Connectors Industry Revenue (Million) Forecast, by Application 2019 & 2032
- Table 14: Canada Aviation Connectors Industry Volume (K Unit) Forecast, by Application 2019 & 2032
- Table 15: Mexico Aviation Connectors Industry Revenue (Million) Forecast, by Application 2019 & 2032
- Table 16: Mexico Aviation Connectors Industry Volume (K Unit) Forecast, by Application 2019 & 2032
- Table 17: Global Aviation Connectors Industry Revenue Million Forecast, by Country 2019 & 2032
- Table 18: Global Aviation Connectors Industry Volume K Unit Forecast, by Country 2019 & 2032
- Table 19: Germany Aviation Connectors Industry Revenue (Million) Forecast, by Application 2019 & 2032
- Table 20: Germany Aviation Connectors Industry Volume (K Unit) Forecast, by Application 2019 & 2032
- Table 21: United Kingdom Aviation Connectors Industry Revenue (Million) Forecast, by Application 2019 & 2032
- Table 22: United Kingdom Aviation Connectors Industry Volume (K Unit) Forecast, by Application 2019 & 2032
- Table 23: France Aviation Connectors Industry Revenue (Million) Forecast, by Application 2019 & 2032
- Table 24: France Aviation Connectors Industry Volume (K Unit) Forecast, by Application 2019 & 2032
- Table 25: Spain Aviation Connectors Industry Revenue (Million) Forecast, by Application 2019 & 2032
- Table 26: Spain Aviation Connectors Industry Volume (K Unit) Forecast, by Application 2019 & 2032
- Table 27: Italy Aviation Connectors Industry Revenue (Million) Forecast, by Application 2019 & 2032
- Table 28: Italy Aviation Connectors Industry Volume (K Unit) Forecast, by Application 2019 & 2032
- Table 29: Spain Aviation Connectors Industry Revenue (Million) Forecast, by Application 2019 & 2032
- Table 30: Spain Aviation Connectors Industry Volume (K Unit) Forecast, by Application 2019 & 2032
- Table 31: Belgium Aviation Connectors Industry Revenue (Million) Forecast, by Application 2019 & 2032
- Table 32: Belgium Aviation Connectors Industry Volume (K Unit) Forecast, by Application 2019 & 2032
- Table 33: Netherland Aviation Connectors Industry Revenue (Million) Forecast, by Application 2019 & 2032
- Table 34: Netherland Aviation Connectors Industry Volume (K Unit) Forecast, by Application 2019 & 2032
- Table 35: Nordics Aviation Connectors Industry Revenue (Million) Forecast, by Application 2019 & 2032
- Table 36: Nordics Aviation Connectors Industry Volume (K Unit) Forecast, by Application 2019 & 2032
- Table 37: Rest of Europe Aviation Connectors Industry Revenue (Million) Forecast, by Application 2019 & 2032
- Table 38: Rest of Europe Aviation Connectors Industry Volume (K Unit) Forecast, by Application 2019 & 2032
- Table 39: Global Aviation Connectors Industry Revenue Million Forecast, by Country 2019 & 2032
- Table 40: Global Aviation Connectors Industry Volume K Unit Forecast, by Country 2019 & 2032
- Table 41: China Aviation Connectors Industry Revenue (Million) Forecast, by Application 2019 & 2032
- Table 42: China Aviation Connectors Industry Volume (K Unit) Forecast, by Application 2019 & 2032
- Table 43: Japan Aviation Connectors Industry Revenue (Million) Forecast, by Application 2019 & 2032
- Table 44: Japan Aviation Connectors Industry Volume (K Unit) Forecast, by Application 2019 & 2032
- Table 45: India Aviation Connectors Industry Revenue (Million) Forecast, by Application 2019 & 2032
- Table 46: India Aviation Connectors Industry Volume (K Unit) Forecast, by Application 2019 & 2032
- Table 47: South Korea Aviation Connectors Industry Revenue (Million) Forecast, by Application 2019 & 2032
- Table 48: South Korea Aviation Connectors Industry Volume (K Unit) Forecast, by Application 2019 & 2032
- Table 49: Southeast Asia Aviation Connectors Industry Revenue (Million) Forecast, by Application 2019 & 2032
- Table 50: Southeast Asia Aviation Connectors Industry Volume (K Unit) Forecast, by Application 2019 & 2032
- Table 51: Australia Aviation Connectors Industry Revenue (Million) Forecast, by Application 2019 & 2032
- Table 52: Australia Aviation Connectors Industry Volume (K Unit) Forecast, by Application 2019 & 2032
- Table 53: Indonesia Aviation Connectors Industry Revenue (Million) Forecast, by Application 2019 & 2032
- Table 54: Indonesia Aviation Connectors Industry Volume (K Unit) Forecast, by Application 2019 & 2032
- Table 55: Phillipes Aviation Connectors Industry Revenue (Million) Forecast, by Application 2019 & 2032
- Table 56: Phillipes Aviation Connectors Industry Volume (K Unit) Forecast, by Application 2019 & 2032
- Table 57: Singapore Aviation Connectors Industry Revenue (Million) Forecast, by Application 2019 & 2032
- Table 58: Singapore Aviation Connectors Industry Volume (K Unit) Forecast, by Application 2019 & 2032
- Table 59: Thailandc Aviation Connectors Industry Revenue (Million) Forecast, by Application 2019 & 2032
- Table 60: Thailandc Aviation Connectors Industry Volume (K Unit) Forecast, by Application 2019 & 2032
- Table 61: Rest of Asia Pacific Aviation Connectors Industry Revenue (Million) Forecast, by Application 2019 & 2032
- Table 62: Rest of Asia Pacific Aviation Connectors Industry Volume (K Unit) Forecast, by Application 2019 & 2032
- Table 63: Global Aviation Connectors Industry Revenue Million Forecast, by Country 2019 & 2032
- Table 64: Global Aviation Connectors Industry Volume K Unit Forecast, by Country 2019 & 2032
- Table 65: Brazil Aviation Connectors Industry Revenue (Million) Forecast, by Application 2019 & 2032
- Table 66: Brazil Aviation Connectors Industry Volume (K Unit) Forecast, by Application 2019 & 2032
- Table 67: Argentina Aviation Connectors Industry Revenue (Million) Forecast, by Application 2019 & 2032
- Table 68: Argentina Aviation Connectors Industry Volume (K Unit) Forecast, by Application 2019 & 2032
- Table 69: Peru Aviation Connectors Industry Revenue (Million) Forecast, by Application 2019 & 2032
- Table 70: Peru Aviation Connectors Industry Volume (K Unit) Forecast, by Application 2019 & 2032
- Table 71: Chile Aviation Connectors Industry Revenue (Million) Forecast, by Application 2019 & 2032
- Table 72: Chile Aviation Connectors Industry Volume (K Unit) Forecast, by Application 2019 & 2032
- Table 73: Colombia Aviation Connectors Industry Revenue (Million) Forecast, by Application 2019 & 2032
- Table 74: Colombia Aviation Connectors Industry Volume (K Unit) Forecast, by Application 2019 & 2032
- Table 75: Ecuador Aviation Connectors Industry Revenue (Million) Forecast, by Application 2019 & 2032
- Table 76: Ecuador Aviation Connectors Industry Volume (K Unit) Forecast, by Application 2019 & 2032
- Table 77: Venezuela Aviation Connectors Industry Revenue (Million) Forecast, by Application 2019 & 2032
- Table 78: Venezuela Aviation Connectors Industry Volume (K Unit) Forecast, by Application 2019 & 2032
- Table 79: Rest of South America Aviation Connectors Industry Revenue (Million) Forecast, by Application 2019 & 2032
- Table 80: Rest of South America Aviation Connectors Industry Volume (K Unit) Forecast, by Application 2019 & 2032
- Table 81: Global Aviation Connectors Industry Revenue Million Forecast, by Country 2019 & 2032
- Table 82: Global Aviation Connectors Industry Volume K Unit Forecast, by Country 2019 & 2032
- Table 83: United Arab Emirates Aviation Connectors Industry Revenue (Million) Forecast, by Application 2019 & 2032
- Table 84: United Arab Emirates Aviation Connectors Industry Volume (K Unit) Forecast, by Application 2019 & 2032
- Table 85: Saudi Arabia Aviation Connectors Industry Revenue (Million) Forecast, by Application 2019 & 2032
- Table 86: Saudi Arabia Aviation Connectors Industry Volume (K Unit) Forecast, by Application 2019 & 2032
- Table 87: South Africa Aviation Connectors Industry Revenue (Million) Forecast, by Application 2019 & 2032
- Table 88: South Africa Aviation Connectors Industry Volume (K Unit) Forecast, by Application 2019 & 2032
- Table 89: Rest of Middle East and Africa Aviation Connectors Industry Revenue (Million) Forecast, by Application 2019 & 2032
- Table 90: Rest of Middle East and Africa Aviation Connectors Industry Volume (K Unit) Forecast, by Application 2019 & 2032
- Table 91: Global Aviation Connectors Industry Revenue Million Forecast, by Type 2019 & 2032
- Table 92: Global Aviation Connectors Industry Volume K Unit Forecast, by Type 2019 & 2032
- Table 93: Global Aviation Connectors Industry Revenue Million Forecast, by Shape 2019 & 2032
- Table 94: Global Aviation Connectors Industry Volume K Unit Forecast, by Shape 2019 & 2032
- Table 95: Global Aviation Connectors Industry Revenue Million Forecast, by Country 2019 & 2032
- Table 96: Global Aviation Connectors Industry Volume K Unit Forecast, by Country 2019 & 2032
- Table 97: United States Aviation Connectors Industry Revenue (Million) Forecast, by Application 2019 & 2032
- Table 98: United States Aviation Connectors Industry Volume (K Unit) Forecast, by Application 2019 & 2032
- Table 99: Canada Aviation Connectors Industry Revenue (Million) Forecast, by Application 2019 & 2032
- Table 100: Canada Aviation Connectors Industry Volume (K Unit) Forecast, by Application 2019 & 2032
- Table 101: Global Aviation Connectors Industry Revenue Million Forecast, by Type 2019 & 2032
- Table 102: Global Aviation Connectors Industry Volume K Unit Forecast, by Type 2019 & 2032
- Table 103: Global Aviation Connectors Industry Revenue Million Forecast, by Shape 2019 & 2032
- Table 104: Global Aviation Connectors Industry Volume K Unit Forecast, by Shape 2019 & 2032
- Table 105: Global Aviation Connectors Industry Revenue Million Forecast, by Country 2019 & 2032
- Table 106: Global Aviation Connectors Industry Volume K Unit Forecast, by Country 2019 & 2032
- Table 107: United Kingdom Aviation Connectors Industry Revenue (Million) Forecast, by Application 2019 & 2032
- Table 108: United Kingdom Aviation Connectors Industry Volume (K Unit) Forecast, by Application 2019 & 2032
- Table 109: France Aviation Connectors Industry Revenue (Million) Forecast, by Application 2019 & 2032
- Table 110: France Aviation Connectors Industry Volume (K Unit) Forecast, by Application 2019 & 2032
- Table 111: Germany Aviation Connectors Industry Revenue (Million) Forecast, by Application 2019 & 2032
- Table 112: Germany Aviation Connectors Industry Volume (K Unit) Forecast, by Application 2019 & 2032
- Table 113: Italy Aviation Connectors Industry Revenue (Million) Forecast, by Application 2019 & 2032
- Table 114: Italy Aviation Connectors Industry Volume (K Unit) Forecast, by Application 2019 & 2032
- Table 115: Rest of Europe Aviation Connectors Industry Revenue (Million) Forecast, by Application 2019 & 2032
- Table 116: Rest of Europe Aviation Connectors Industry Volume (K Unit) Forecast, by Application 2019 & 2032
- Table 117: Global Aviation Connectors Industry Revenue Million Forecast, by Type 2019 & 2032
- Table 118: Global Aviation Connectors Industry Volume K Unit Forecast, by Type 2019 & 2032
- Table 119: Global Aviation Connectors Industry Revenue Million Forecast, by Shape 2019 & 2032
- Table 120: Global Aviation Connectors Industry Volume K Unit Forecast, by Shape 2019 & 2032
- Table 121: Global Aviation Connectors Industry Revenue Million Forecast, by Country 2019 & 2032
- Table 122: Global Aviation Connectors Industry Volume K Unit Forecast, by Country 2019 & 2032
- Table 123: Japan Aviation Connectors Industry Revenue (Million) Forecast, by Application 2019 & 2032
- Table 124: Japan Aviation Connectors Industry Volume (K Unit) Forecast, by Application 2019 & 2032
- Table 125: China Aviation Connectors Industry Revenue (Million) Forecast, by Application 2019 & 2032
- Table 126: China Aviation Connectors Industry Volume (K Unit) Forecast, by Application 2019 & 2032
- Table 127: Rest of Asia Pacific Aviation Connectors Industry Revenue (Million) Forecast, by Application 2019 & 2032
- Table 128: Rest of Asia Pacific Aviation Connectors Industry Volume (K Unit) Forecast, by Application 2019 & 2032
- Table 129: Global Aviation Connectors Industry Revenue Million Forecast, by Type 2019 & 2032
- Table 130: Global Aviation Connectors Industry Volume K Unit Forecast, by Type 2019 & 2032
- Table 131: Global Aviation Connectors Industry Revenue Million Forecast, by Shape 2019 & 2032
- Table 132: Global Aviation Connectors Industry Volume K Unit Forecast, by Shape 2019 & 2032
- Table 133: Global Aviation Connectors Industry Revenue Million Forecast, by Country 2019 & 2032
- Table 134: Global Aviation Connectors Industry Volume K Unit Forecast, by Country 2019 & 2032
- Table 135: Latin America Aviation Connectors Industry Revenue (Million) Forecast, by Application 2019 & 2032
- Table 136: Latin America Aviation Connectors Industry Volume (K Unit) Forecast, by Application 2019 & 2032
- Table 137: Middle East Aviation Connectors Industry Revenue (Million) Forecast, by Application 2019 & 2032
- Table 138: Middle East Aviation Connectors Industry Volume (K Unit) Forecast, by Application 2019 & 2032
Frequently Asked Questions
1. What is the projected Compound Annual Growth Rate (CAGR) of the Aviation Connectors Industry?
The projected CAGR is approximately 5.00%.
2. Which companies are prominent players in the Aviation Connectors Industry?
Key companies in the market include Conesys Inc, SOURIAU SAS, Carlisle Interconnect Technologies (Carlisle Companies Inc ), Rosenberger Group, Amphenol Corporation ITT Inc, TE Connectivity Ltd, Cooper Industries (Eaton Corporation), Radiall SA, Smiths Interconnect Inc (Smiths Group PLC).
3. What are the main segments of the Aviation Connectors Industry?
The market segments include Type, Shape.
4. Can you provide details about the market size?
The market size is estimated to be USD XX Million as of 2022.
5. What are some drivers contributing to market growth?
; Increase in the Demand for Aircraft; Shift towards Electric Architecture and Technology.
6. What are the notable trends driving market growth?
Fiber Optic Connectors are Expected to Register a Significant Growth Rate.
7. Are there any restraints impacting market growth?
; Existing Backlog of Aircraft Deliveries.
8. Can you provide examples of recent developments in the market?
N/A
9. What pricing options are available for accessing the report?
Pricing options include single-user, multi-user, and enterprise licenses priced at USD 4750, USD 5250, and USD 8750 respectively.
10. Is the market size provided in terms of value or volume?
The market size is provided in terms of value, measured in Million and volume, measured in K Unit.
11. Are there any specific market keywords associated with the report?
Yes, the market keyword associated with the report is "Aviation Connectors Industry," which aids in identifying and referencing the specific market segment covered.
12. How do I determine which pricing option suits my needs best?
The pricing options vary based on user requirements and access needs. Individual users may opt for single-user licenses, while businesses requiring broader access may choose multi-user or enterprise licenses for cost-effective access to the report.
13. Are there any additional resources or data provided in the Aviation Connectors Industry report?
While the report offers comprehensive insights, it's advisable to review the specific contents or supplementary materials provided to ascertain if additional resources or data are available.
14. How can I stay updated on further developments or reports in the Aviation Connectors Industry?
To stay informed about further developments, trends, and reports in the Aviation Connectors Industry, consider subscribing to industry newsletters, following relevant companies and organizations, or regularly checking reputable industry news sources and publications.
Methodology
Step 1 - Identification of Relevant Samples Size from Population Database


Step 2 - Approaches for Defining Global Market Size (Value, Volume* & Price*)

Note*: In applicable scenarios
Step 3 - Data Sources
Primary Research
- Web Analytics
- Survey Reports
- Research Institute
- Latest Research Reports
- Opinion Leaders
Secondary Research
- Annual Reports
- White Paper
- Latest Press Release
- Industry Association
- Paid Database
- Investor Presentations

Step 4 - Data Triangulation
Involves using different sources of information in order to increase the validity of a study
These sources are likely to be stakeholders in a program - participants, other researchers, program staff, other community members, and so on.
Then we put all data in single framework & apply various statistical tools to find out the dynamic on the market.
During the analysis stage, feedback from the stakeholder groups would be compared to determine areas of agreement as well as areas of divergence
