

Key Insights
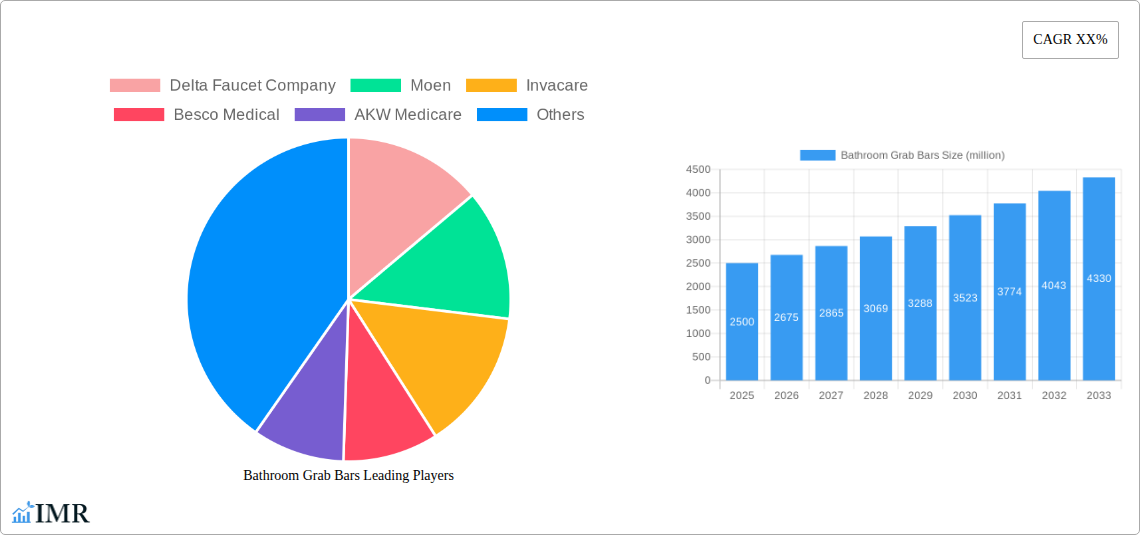
The global bathroom grab bar market is experiencing robust growth, driven by an aging global population and increasing awareness of safety and accessibility needs in bathrooms. The market, estimated at $2.5 billion in 2025, is projected to expand at a Compound Annual Growth Rate (CAGR) of 7% from 2025 to 2033, reaching approximately $4.2 billion by 2033. This growth is fueled by several key factors including rising incidence of chronic diseases leading to mobility impairments, increasing government initiatives promoting accessibility in public and private spaces, and technological advancements in grab bar design, offering improved safety and aesthetics. Key market segments include residential and commercial applications, with further segmentation by material (stainless steel, brass, etc.) and mounting type. The market is relatively fragmented with several major players such as Delta Faucet, Moen, and Invacare competing alongside numerous smaller specialized manufacturers.
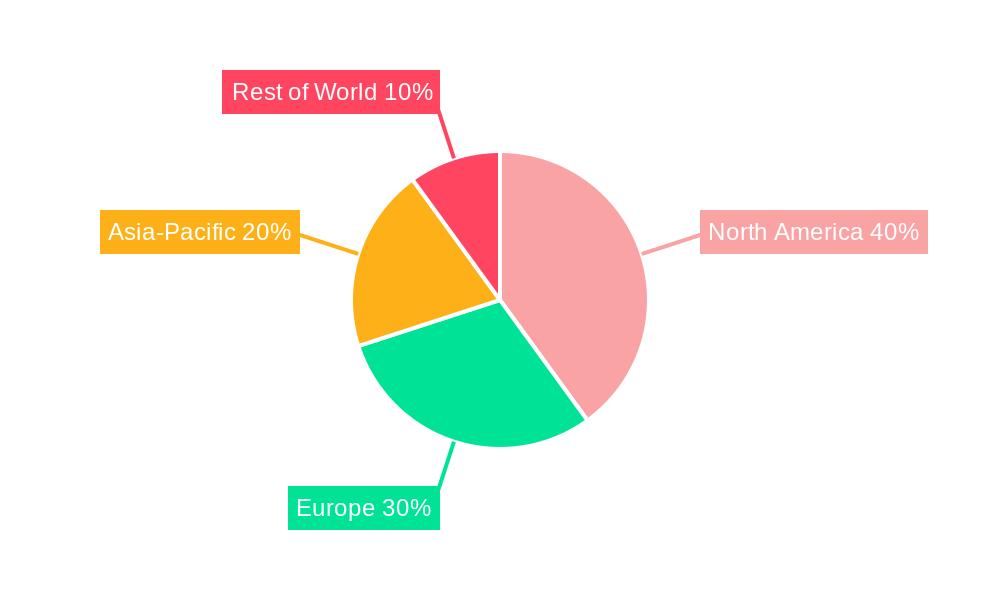
Growth is further enhanced by the increasing adoption of smart grab bars incorporating features such as emergency call buttons and fall detection sensors. However, the market faces certain restraints, including high initial investment costs for some advanced grab bars potentially limiting adoption in certain regions and demographics. Nonetheless, the increasing focus on preventative healthcare and the rising disposable incomes in developing economies are expected to mitigate these limitations, driving continued market expansion throughout the forecast period. The regional market is expected to see significant growth in North America and Europe driven by high adoption rates and strong regulatory frameworks supporting accessible design. Asia-Pacific is also poised for significant growth due to rapid urbanization and rising geriatric populations.
Bathroom Grab Bars Market Report: 2019-2033
This comprehensive report provides a detailed analysis of the global Bathroom Grab Bars market, encompassing market dynamics, growth trends, regional segmentation, product landscape, competitive analysis, and future outlook. The study period spans from 2019 to 2033, with 2025 serving as the base and estimated year. This report is invaluable for industry professionals, investors, and stakeholders seeking a deep understanding of this vital segment within the larger Assistive Devices & Mobility Aids market (Parent Market) and specifically the Bathroom Safety & Accessibility Products market (Child Market). The report projects a market size of xx million units by 2033.
Bathroom Grab Bars Market Dynamics & Structure
The global bathroom grab bars market is characterized by a moderately concentrated landscape, with key players like Delta Faucet Company, Moen, Invacare, and others holding significant market share. Technological innovation, driven by the increasing demand for user-friendly and aesthetically pleasing designs, is a major driver. Stringent regulatory frameworks focusing on safety and accessibility standards influence product development and market growth. The market also faces competition from alternative solutions, including adaptive bathroom remodeling. The aging global population and rising prevalence of mobility impairments are key demographic drivers. Mergers and acquisitions (M&A) activity within the sector has been moderate, with a reported xx deals in the past five years, primarily focused on expanding product portfolios and geographical reach.
- Market Concentration: Moderately concentrated, with the top 5 players holding approximately xx% of the market share in 2024.
- Technological Innovation: Focus on ergonomic designs, material advancements (stainless steel, coated materials), and smart features (e.g., pressure sensors).
- Regulatory Landscape: Compliance with ADA (Americans with Disabilities Act) and similar international standards is crucial.
- Competitive Substitutes: Adaptive bathroom renovations, specialized shower chairs, and other assistive devices.
- End-User Demographics: Aging population, individuals with disabilities, and elderly care facilities are key end-users.
- M&A Activity: xx M&A deals between 2019-2024, primarily for market expansion and product diversification.
Bathroom Grab Bars Growth Trends & Insights
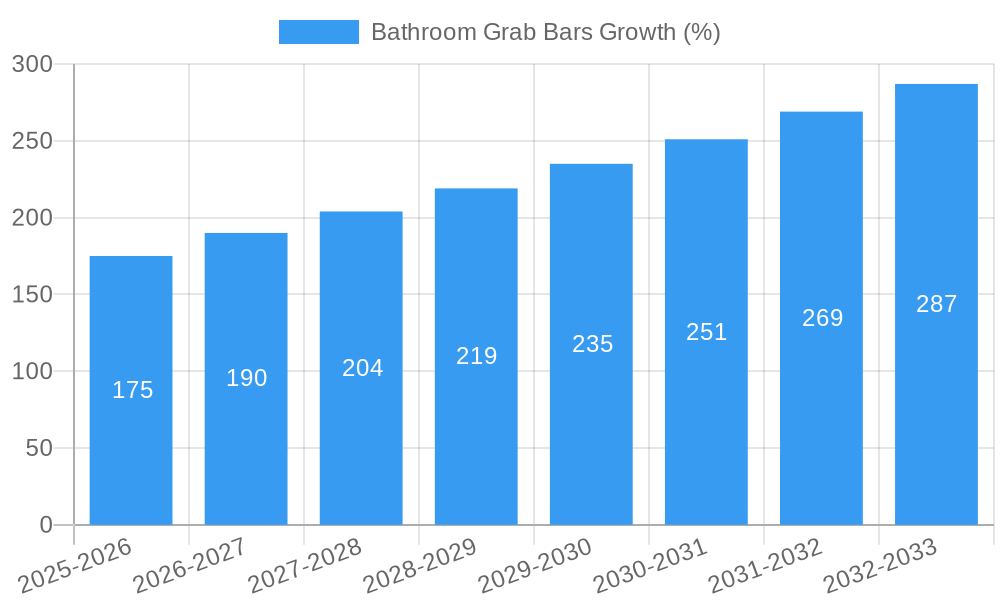
The global bathroom grab bars market experienced steady growth during the historical period (2019-2024), with a CAGR of xx%. This growth is attributed to several factors, including an aging global population, increasing awareness of bathroom safety, rising disposable incomes, and government initiatives promoting accessibility. Technological advancements, such as the introduction of sleek, modern designs and smart grab bars, have further fueled market adoption. Consumer preferences are shifting towards aesthetically pleasing and functional products, driving demand for higher-priced, feature-rich grab bars. We project a CAGR of xx% during the forecast period (2025-2033), with the market size reaching xx million units by 2033. Market penetration in developed regions is relatively high, while emerging markets offer significant growth opportunities.
Dominant Regions, Countries, or Segments in Bathroom Grab Bars
North America and Europe currently dominate the global bathroom grab bars market, driven by high disposable incomes, strong regulatory frameworks, and a large aging population. The United States holds the largest market share within North America, while Germany and the UK are key markets in Europe. However, Asia-Pacific is projected to experience the fastest growth rate during the forecast period, fueled by rising disposable incomes, increasing awareness of bathroom safety, and government initiatives promoting accessibility in countries like China, India, and Japan.
- Key Drivers in North America: High disposable income, aging population, stringent safety regulations.
- Key Drivers in Europe: Similar to North America, with strong government support for accessibility.
- Key Drivers in Asia-Pacific: Rapid economic growth, rising middle class, increasing awareness of aging-related issues.
Bathroom Grab Bars Product Landscape
The bathroom grab bars market offers a diverse range of products, categorized by material (stainless steel, brass, coated materials), design (straight, angled, curved), and features (fold-down, suction cup, illuminated). Recent innovations focus on enhanced grip, improved aesthetics, and smart functionalities, such as pressure sensors and integrated emergency call systems. Key selling propositions include safety, durability, and ease of installation.
Key Drivers, Barriers & Challenges in Bathroom Grab Bars
Key Drivers:
- Increasing geriatric population globally.
- Growing awareness regarding bathroom safety and accessibility.
- Stringent regulations promoting accessibility in public and private spaces.
- Technological advancements leading to innovative and user-friendly products.
Key Challenges:
- High initial investment cost for some premium grab bar models can be a barrier for price-sensitive consumers.
- Potential supply chain disruptions impacting raw material availability and manufacturing costs.
- Intense competition among existing players and new entrants into the market.
Emerging Opportunities in Bathroom Grab Bars
- Expansion into emerging markets with growing elderly populations.
- Development of smart grab bars with integrated features.
- Customization options to cater to diverse needs and preferences.
- Focus on sustainable and eco-friendly materials.
Growth Accelerators in the Bathroom Grab Bars Industry
Technological advancements, particularly in smart grab bar technologies and material science, will be crucial growth accelerators. Strategic partnerships between manufacturers and healthcare providers can enhance market penetration. Expanding into underserved markets and focusing on customized solutions will further boost growth.
Key Players Shaping the Bathroom Grab Bars Market
- Delta Faucet Company
- Moen
- Invacare
- Besco Medical
- AKW Medicare
- HealthCraft Products
- MIXTA
- Rehastage
- Etac
- Parsons ADL
- Ponte Giulio
- HERDEGEN
Notable Milestones in Bathroom Grab Bars Sector
- 2021: Delta Faucet launches a new line of smart grab bars with integrated emergency call systems.
- 2022: Moen introduces a range of grab bars with enhanced grip surfaces and modern designs.
- 2023: A significant merger occurs between two mid-sized grab bar manufacturers, resulting in increased market share.
In-Depth Bathroom Grab Bars Market Outlook
The future of the bathroom grab bars market looks promising, driven by sustained growth in the elderly population and increasing awareness of bathroom safety. Continued technological innovations, strategic partnerships, and expansion into emerging markets will further propel market expansion. The market is expected to experience robust growth, presenting significant opportunities for established players and new entrants alike. Strategic focus on user experience, innovative product features, and sustainable practices will be key to success in this evolving market.
Bathroom Grab Bars Segmentation
-
1. Application
- 1.1. Residential
- 1.2. Commercial
- 1.3. Communal
- 1.4. Medical
-
2. Types
- 2.1. Wall Mounted Bathroom Grab Bars
- 2.2. Suction Cup Bathroom Grab Bars
- 2.3. Floor Type Bathroom Grab Bars
- 2.4. Adhesive Bathroom Grab Bars
Bathroom Grab Bars Segmentation By Geography
-
1. North America
- 1.1. United States
- 1.2. Canada
- 1.3. Mexico
-
2. South America
- 2.1. Brazil
- 2.2. Argentina
- 2.3. Rest of South America
-
3. Europe
- 3.1. United Kingdom
- 3.2. Germany
- 3.3. France
- 3.4. Italy
- 3.5. Spain
- 3.6. Russia
- 3.7. Benelux
- 3.8. Nordics
- 3.9. Rest of Europe
-
4. Middle East & Africa
- 4.1. Turkey
- 4.2. Israel
- 4.3. GCC
- 4.4. North Africa
- 4.5. South Africa
- 4.6. Rest of Middle East & Africa
-
5. Asia Pacific
- 5.1. China
- 5.2. India
- 5.3. Japan
- 5.4. South Korea
- 5.5. ASEAN
- 5.6. Oceania
- 5.7. Rest of Asia Pacific
Bathroom Grab Bars REPORT HIGHLIGHTS
| Aspects | Details |
|---|---|
| Study Period | 2019-2033 |
| Base Year | 2024 |
| Estimated Year | 2025 |
| Forecast Period | 2025-2033 |
| Historical Period | 2019-2024 |
| Growth Rate | CAGR of XX% from 2019-2033 |
| Segmentation |
|
Table of Contents
- 1. Introduction
- 1.1. Research Scope
- 1.2. Market Segmentation
- 1.3. Research Methodology
- 1.4. Definitions and Assumptions
- 2. Executive Summary
- 2.1. Introduction
- 3. Market Dynamics
- 3.1. Introduction
- 3.2. Market Drivers
- 3.3. Market Restrains
- 3.4. Market Trends
- 4. Market Factor Analysis
- 4.1. Porters Five Forces
- 4.2. Supply/Value Chain
- 4.3. PESTEL analysis
- 4.4. Market Entropy
- 4.5. Patent/Trademark Analysis
- 5. Global Bathroom Grab Bars Analysis, Insights and Forecast, 2019-2031
- 5.1. Market Analysis, Insights and Forecast - by Application
- 5.1.1. Residential
- 5.1.2. Commercial
- 5.1.3. Communal
- 5.1.4. Medical
- 5.2. Market Analysis, Insights and Forecast - by Types
- 5.2.1. Wall Mounted Bathroom Grab Bars
- 5.2.2. Suction Cup Bathroom Grab Bars
- 5.2.3. Floor Type Bathroom Grab Bars
- 5.2.4. Adhesive Bathroom Grab Bars
- 5.3. Market Analysis, Insights and Forecast - by Region
- 5.3.1. North America
- 5.3.2. South America
- 5.3.3. Europe
- 5.3.4. Middle East & Africa
- 5.3.5. Asia Pacific
- 5.1. Market Analysis, Insights and Forecast - by Application
- 6. North America Bathroom Grab Bars Analysis, Insights and Forecast, 2019-2031
- 6.1. Market Analysis, Insights and Forecast - by Application
- 6.1.1. Residential
- 6.1.2. Commercial
- 6.1.3. Communal
- 6.1.4. Medical
- 6.2. Market Analysis, Insights and Forecast - by Types
- 6.2.1. Wall Mounted Bathroom Grab Bars
- 6.2.2. Suction Cup Bathroom Grab Bars
- 6.2.3. Floor Type Bathroom Grab Bars
- 6.2.4. Adhesive Bathroom Grab Bars
- 6.1. Market Analysis, Insights and Forecast - by Application
- 7. South America Bathroom Grab Bars Analysis, Insights and Forecast, 2019-2031
- 7.1. Market Analysis, Insights and Forecast - by Application
- 7.1.1. Residential
- 7.1.2. Commercial
- 7.1.3. Communal
- 7.1.4. Medical
- 7.2. Market Analysis, Insights and Forecast - by Types
- 7.2.1. Wall Mounted Bathroom Grab Bars
- 7.2.2. Suction Cup Bathroom Grab Bars
- 7.2.3. Floor Type Bathroom Grab Bars
- 7.2.4. Adhesive Bathroom Grab Bars
- 7.1. Market Analysis, Insights and Forecast - by Application
- 8. Europe Bathroom Grab Bars Analysis, Insights and Forecast, 2019-2031
- 8.1. Market Analysis, Insights and Forecast - by Application
- 8.1.1. Residential
- 8.1.2. Commercial
- 8.1.3. Communal
- 8.1.4. Medical
- 8.2. Market Analysis, Insights and Forecast - by Types
- 8.2.1. Wall Mounted Bathroom Grab Bars
- 8.2.2. Suction Cup Bathroom Grab Bars
- 8.2.3. Floor Type Bathroom Grab Bars
- 8.2.4. Adhesive Bathroom Grab Bars
- 8.1. Market Analysis, Insights and Forecast - by Application
- 9. Middle East & Africa Bathroom Grab Bars Analysis, Insights and Forecast, 2019-2031
- 9.1. Market Analysis, Insights and Forecast - by Application
- 9.1.1. Residential
- 9.1.2. Commercial
- 9.1.3. Communal
- 9.1.4. Medical
- 9.2. Market Analysis, Insights and Forecast - by Types
- 9.2.1. Wall Mounted Bathroom Grab Bars
- 9.2.2. Suction Cup Bathroom Grab Bars
- 9.2.3. Floor Type Bathroom Grab Bars
- 9.2.4. Adhesive Bathroom Grab Bars
- 9.1. Market Analysis, Insights and Forecast - by Application
- 10. Asia Pacific Bathroom Grab Bars Analysis, Insights and Forecast, 2019-2031
- 10.1. Market Analysis, Insights and Forecast - by Application
- 10.1.1. Residential
- 10.1.2. Commercial
- 10.1.3. Communal
- 10.1.4. Medical
- 10.2. Market Analysis, Insights and Forecast - by Types
- 10.2.1. Wall Mounted Bathroom Grab Bars
- 10.2.2. Suction Cup Bathroom Grab Bars
- 10.2.3. Floor Type Bathroom Grab Bars
- 10.2.4. Adhesive Bathroom Grab Bars
- 10.1. Market Analysis, Insights and Forecast - by Application
- 11. Competitive Analysis
- 11.1. Global Market Share Analysis 2024
- 11.2. Company Profiles
- 11.2.1 Delta Faucet Company
- 11.2.1.1. Overview
- 11.2.1.2. Products
- 11.2.1.3. SWOT Analysis
- 11.2.1.4. Recent Developments
- 11.2.1.5. Financials (Based on Availability)
- 11.2.2 Moen
- 11.2.2.1. Overview
- 11.2.2.2. Products
- 11.2.2.3. SWOT Analysis
- 11.2.2.4. Recent Developments
- 11.2.2.5. Financials (Based on Availability)
- 11.2.3 Invacare
- 11.2.3.1. Overview
- 11.2.3.2. Products
- 11.2.3.3. SWOT Analysis
- 11.2.3.4. Recent Developments
- 11.2.3.5. Financials (Based on Availability)
- 11.2.4 Besco Medical
- 11.2.4.1. Overview
- 11.2.4.2. Products
- 11.2.4.3. SWOT Analysis
- 11.2.4.4. Recent Developments
- 11.2.4.5. Financials (Based on Availability)
- 11.2.5 AKW Medicare
- 11.2.5.1. Overview
- 11.2.5.2. Products
- 11.2.5.3. SWOT Analysis
- 11.2.5.4. Recent Developments
- 11.2.5.5. Financials (Based on Availability)
- 11.2.6 HealthCraft Products
- 11.2.6.1. Overview
- 11.2.6.2. Products
- 11.2.6.3. SWOT Analysis
- 11.2.6.4. Recent Developments
- 11.2.6.5. Financials (Based on Availability)
- 11.2.7 MIXTA
- 11.2.7.1. Overview
- 11.2.7.2. Products
- 11.2.7.3. SWOT Analysis
- 11.2.7.4. Recent Developments
- 11.2.7.5. Financials (Based on Availability)
- 11.2.8 Rehastage
- 11.2.8.1. Overview
- 11.2.8.2. Products
- 11.2.8.3. SWOT Analysis
- 11.2.8.4. Recent Developments
- 11.2.8.5. Financials (Based on Availability)
- 11.2.9 Etac
- 11.2.9.1. Overview
- 11.2.9.2. Products
- 11.2.9.3. SWOT Analysis
- 11.2.9.4. Recent Developments
- 11.2.9.5. Financials (Based on Availability)
- 11.2.10 Parsons ADL
- 11.2.10.1. Overview
- 11.2.10.2. Products
- 11.2.10.3. SWOT Analysis
- 11.2.10.4. Recent Developments
- 11.2.10.5. Financials (Based on Availability)
- 11.2.11 Ponte Giulio
- 11.2.11.1. Overview
- 11.2.11.2. Products
- 11.2.11.3. SWOT Analysis
- 11.2.11.4. Recent Developments
- 11.2.11.5. Financials (Based on Availability)
- 11.2.12 HERDEGEN
- 11.2.12.1. Overview
- 11.2.12.2. Products
- 11.2.12.3. SWOT Analysis
- 11.2.12.4. Recent Developments
- 11.2.12.5. Financials (Based on Availability)
- 11.2.1 Delta Faucet Company
List of Figures
- Figure 1: Global Bathroom Grab Bars Revenue Breakdown (million, %) by Region 2024 & 2032
- Figure 2: Global Bathroom Grab Bars Volume Breakdown (K, %) by Region 2024 & 2032
- Figure 3: North America Bathroom Grab Bars Revenue (million), by Application 2024 & 2032
- Figure 4: North America Bathroom Grab Bars Volume (K), by Application 2024 & 2032
- Figure 5: North America Bathroom Grab Bars Revenue Share (%), by Application 2024 & 2032
- Figure 6: North America Bathroom Grab Bars Volume Share (%), by Application 2024 & 2032
- Figure 7: North America Bathroom Grab Bars Revenue (million), by Types 2024 & 2032
- Figure 8: North America Bathroom Grab Bars Volume (K), by Types 2024 & 2032
- Figure 9: North America Bathroom Grab Bars Revenue Share (%), by Types 2024 & 2032
- Figure 10: North America Bathroom Grab Bars Volume Share (%), by Types 2024 & 2032
- Figure 11: North America Bathroom Grab Bars Revenue (million), by Country 2024 & 2032
- Figure 12: North America Bathroom Grab Bars Volume (K), by Country 2024 & 2032
- Figure 13: North America Bathroom Grab Bars Revenue Share (%), by Country 2024 & 2032
- Figure 14: North America Bathroom Grab Bars Volume Share (%), by Country 2024 & 2032
- Figure 15: South America Bathroom Grab Bars Revenue (million), by Application 2024 & 2032
- Figure 16: South America Bathroom Grab Bars Volume (K), by Application 2024 & 2032
- Figure 17: South America Bathroom Grab Bars Revenue Share (%), by Application 2024 & 2032
- Figure 18: South America Bathroom Grab Bars Volume Share (%), by Application 2024 & 2032
- Figure 19: South America Bathroom Grab Bars Revenue (million), by Types 2024 & 2032
- Figure 20: South America Bathroom Grab Bars Volume (K), by Types 2024 & 2032
- Figure 21: South America Bathroom Grab Bars Revenue Share (%), by Types 2024 & 2032
- Figure 22: South America Bathroom Grab Bars Volume Share (%), by Types 2024 & 2032
- Figure 23: South America Bathroom Grab Bars Revenue (million), by Country 2024 & 2032
- Figure 24: South America Bathroom Grab Bars Volume (K), by Country 2024 & 2032
- Figure 25: South America Bathroom Grab Bars Revenue Share (%), by Country 2024 & 2032
- Figure 26: South America Bathroom Grab Bars Volume Share (%), by Country 2024 & 2032
- Figure 27: Europe Bathroom Grab Bars Revenue (million), by Application 2024 & 2032
- Figure 28: Europe Bathroom Grab Bars Volume (K), by Application 2024 & 2032
- Figure 29: Europe Bathroom Grab Bars Revenue Share (%), by Application 2024 & 2032
- Figure 30: Europe Bathroom Grab Bars Volume Share (%), by Application 2024 & 2032
- Figure 31: Europe Bathroom Grab Bars Revenue (million), by Types 2024 & 2032
- Figure 32: Europe Bathroom Grab Bars Volume (K), by Types 2024 & 2032
- Figure 33: Europe Bathroom Grab Bars Revenue Share (%), by Types 2024 & 2032
- Figure 34: Europe Bathroom Grab Bars Volume Share (%), by Types 2024 & 2032
- Figure 35: Europe Bathroom Grab Bars Revenue (million), by Country 2024 & 2032
- Figure 36: Europe Bathroom Grab Bars Volume (K), by Country 2024 & 2032
- Figure 37: Europe Bathroom Grab Bars Revenue Share (%), by Country 2024 & 2032
- Figure 38: Europe Bathroom Grab Bars Volume Share (%), by Country 2024 & 2032
- Figure 39: Middle East & Africa Bathroom Grab Bars Revenue (million), by Application 2024 & 2032
- Figure 40: Middle East & Africa Bathroom Grab Bars Volume (K), by Application 2024 & 2032
- Figure 41: Middle East & Africa Bathroom Grab Bars Revenue Share (%), by Application 2024 & 2032
- Figure 42: Middle East & Africa Bathroom Grab Bars Volume Share (%), by Application 2024 & 2032
- Figure 43: Middle East & Africa Bathroom Grab Bars Revenue (million), by Types 2024 & 2032
- Figure 44: Middle East & Africa Bathroom Grab Bars Volume (K), by Types 2024 & 2032
- Figure 45: Middle East & Africa Bathroom Grab Bars Revenue Share (%), by Types 2024 & 2032
- Figure 46: Middle East & Africa Bathroom Grab Bars Volume Share (%), by Types 2024 & 2032
- Figure 47: Middle East & Africa Bathroom Grab Bars Revenue (million), by Country 2024 & 2032
- Figure 48: Middle East & Africa Bathroom Grab Bars Volume (K), by Country 2024 & 2032
- Figure 49: Middle East & Africa Bathroom Grab Bars Revenue Share (%), by Country 2024 & 2032
- Figure 50: Middle East & Africa Bathroom Grab Bars Volume Share (%), by Country 2024 & 2032
- Figure 51: Asia Pacific Bathroom Grab Bars Revenue (million), by Application 2024 & 2032
- Figure 52: Asia Pacific Bathroom Grab Bars Volume (K), by Application 2024 & 2032
- Figure 53: Asia Pacific Bathroom Grab Bars Revenue Share (%), by Application 2024 & 2032
- Figure 54: Asia Pacific Bathroom Grab Bars Volume Share (%), by Application 2024 & 2032
- Figure 55: Asia Pacific Bathroom Grab Bars Revenue (million), by Types 2024 & 2032
- Figure 56: Asia Pacific Bathroom Grab Bars Volume (K), by Types 2024 & 2032
- Figure 57: Asia Pacific Bathroom Grab Bars Revenue Share (%), by Types 2024 & 2032
- Figure 58: Asia Pacific Bathroom Grab Bars Volume Share (%), by Types 2024 & 2032
- Figure 59: Asia Pacific Bathroom Grab Bars Revenue (million), by Country 2024 & 2032
- Figure 60: Asia Pacific Bathroom Grab Bars Volume (K), by Country 2024 & 2032
- Figure 61: Asia Pacific Bathroom Grab Bars Revenue Share (%), by Country 2024 & 2032
- Figure 62: Asia Pacific Bathroom Grab Bars Volume Share (%), by Country 2024 & 2032
List of Tables
- Table 1: Global Bathroom Grab Bars Revenue million Forecast, by Region 2019 & 2032
- Table 2: Global Bathroom Grab Bars Volume K Forecast, by Region 2019 & 2032
- Table 3: Global Bathroom Grab Bars Revenue million Forecast, by Application 2019 & 2032
- Table 4: Global Bathroom Grab Bars Volume K Forecast, by Application 2019 & 2032
- Table 5: Global Bathroom Grab Bars Revenue million Forecast, by Types 2019 & 2032
- Table 6: Global Bathroom Grab Bars Volume K Forecast, by Types 2019 & 2032
- Table 7: Global Bathroom Grab Bars Revenue million Forecast, by Region 2019 & 2032
- Table 8: Global Bathroom Grab Bars Volume K Forecast, by Region 2019 & 2032
- Table 9: Global Bathroom Grab Bars Revenue million Forecast, by Application 2019 & 2032
- Table 10: Global Bathroom Grab Bars Volume K Forecast, by Application 2019 & 2032
- Table 11: Global Bathroom Grab Bars Revenue million Forecast, by Types 2019 & 2032
- Table 12: Global Bathroom Grab Bars Volume K Forecast, by Types 2019 & 2032
- Table 13: Global Bathroom Grab Bars Revenue million Forecast, by Country 2019 & 2032
- Table 14: Global Bathroom Grab Bars Volume K Forecast, by Country 2019 & 2032
- Table 15: United States Bathroom Grab Bars Revenue (million) Forecast, by Application 2019 & 2032
- Table 16: United States Bathroom Grab Bars Volume (K) Forecast, by Application 2019 & 2032
- Table 17: Canada Bathroom Grab Bars Revenue (million) Forecast, by Application 2019 & 2032
- Table 18: Canada Bathroom Grab Bars Volume (K) Forecast, by Application 2019 & 2032
- Table 19: Mexico Bathroom Grab Bars Revenue (million) Forecast, by Application 2019 & 2032
- Table 20: Mexico Bathroom Grab Bars Volume (K) Forecast, by Application 2019 & 2032
- Table 21: Global Bathroom Grab Bars Revenue million Forecast, by Application 2019 & 2032
- Table 22: Global Bathroom Grab Bars Volume K Forecast, by Application 2019 & 2032
- Table 23: Global Bathroom Grab Bars Revenue million Forecast, by Types 2019 & 2032
- Table 24: Global Bathroom Grab Bars Volume K Forecast, by Types 2019 & 2032
- Table 25: Global Bathroom Grab Bars Revenue million Forecast, by Country 2019 & 2032
- Table 26: Global Bathroom Grab Bars Volume K Forecast, by Country 2019 & 2032
- Table 27: Brazil Bathroom Grab Bars Revenue (million) Forecast, by Application 2019 & 2032
- Table 28: Brazil Bathroom Grab Bars Volume (K) Forecast, by Application 2019 & 2032
- Table 29: Argentina Bathroom Grab Bars Revenue (million) Forecast, by Application 2019 & 2032
- Table 30: Argentina Bathroom Grab Bars Volume (K) Forecast, by Application 2019 & 2032
- Table 31: Rest of South America Bathroom Grab Bars Revenue (million) Forecast, by Application 2019 & 2032
- Table 32: Rest of South America Bathroom Grab Bars Volume (K) Forecast, by Application 2019 & 2032
- Table 33: Global Bathroom Grab Bars Revenue million Forecast, by Application 2019 & 2032
- Table 34: Global Bathroom Grab Bars Volume K Forecast, by Application 2019 & 2032
- Table 35: Global Bathroom Grab Bars Revenue million Forecast, by Types 2019 & 2032
- Table 36: Global Bathroom Grab Bars Volume K Forecast, by Types 2019 & 2032
- Table 37: Global Bathroom Grab Bars Revenue million Forecast, by Country 2019 & 2032
- Table 38: Global Bathroom Grab Bars Volume K Forecast, by Country 2019 & 2032
- Table 39: United Kingdom Bathroom Grab Bars Revenue (million) Forecast, by Application 2019 & 2032
- Table 40: United Kingdom Bathroom Grab Bars Volume (K) Forecast, by Application 2019 & 2032
- Table 41: Germany Bathroom Grab Bars Revenue (million) Forecast, by Application 2019 & 2032
- Table 42: Germany Bathroom Grab Bars Volume (K) Forecast, by Application 2019 & 2032
- Table 43: France Bathroom Grab Bars Revenue (million) Forecast, by Application 2019 & 2032
- Table 44: France Bathroom Grab Bars Volume (K) Forecast, by Application 2019 & 2032
- Table 45: Italy Bathroom Grab Bars Revenue (million) Forecast, by Application 2019 & 2032
- Table 46: Italy Bathroom Grab Bars Volume (K) Forecast, by Application 2019 & 2032
- Table 47: Spain Bathroom Grab Bars Revenue (million) Forecast, by Application 2019 & 2032
- Table 48: Spain Bathroom Grab Bars Volume (K) Forecast, by Application 2019 & 2032
- Table 49: Russia Bathroom Grab Bars Revenue (million) Forecast, by Application 2019 & 2032
- Table 50: Russia Bathroom Grab Bars Volume (K) Forecast, by Application 2019 & 2032
- Table 51: Benelux Bathroom Grab Bars Revenue (million) Forecast, by Application 2019 & 2032
- Table 52: Benelux Bathroom Grab Bars Volume (K) Forecast, by Application 2019 & 2032
- Table 53: Nordics Bathroom Grab Bars Revenue (million) Forecast, by Application 2019 & 2032
- Table 54: Nordics Bathroom Grab Bars Volume (K) Forecast, by Application 2019 & 2032
- Table 55: Rest of Europe Bathroom Grab Bars Revenue (million) Forecast, by Application 2019 & 2032
- Table 56: Rest of Europe Bathroom Grab Bars Volume (K) Forecast, by Application 2019 & 2032
- Table 57: Global Bathroom Grab Bars Revenue million Forecast, by Application 2019 & 2032
- Table 58: Global Bathroom Grab Bars Volume K Forecast, by Application 2019 & 2032
- Table 59: Global Bathroom Grab Bars Revenue million Forecast, by Types 2019 & 2032
- Table 60: Global Bathroom Grab Bars Volume K Forecast, by Types 2019 & 2032
- Table 61: Global Bathroom Grab Bars Revenue million Forecast, by Country 2019 & 2032
- Table 62: Global Bathroom Grab Bars Volume K Forecast, by Country 2019 & 2032
- Table 63: Turkey Bathroom Grab Bars Revenue (million) Forecast, by Application 2019 & 2032
- Table 64: Turkey Bathroom Grab Bars Volume (K) Forecast, by Application 2019 & 2032
- Table 65: Israel Bathroom Grab Bars Revenue (million) Forecast, by Application 2019 & 2032
- Table 66: Israel Bathroom Grab Bars Volume (K) Forecast, by Application 2019 & 2032
- Table 67: GCC Bathroom Grab Bars Revenue (million) Forecast, by Application 2019 & 2032
- Table 68: GCC Bathroom Grab Bars Volume (K) Forecast, by Application 2019 & 2032
- Table 69: North Africa Bathroom Grab Bars Revenue (million) Forecast, by Application 2019 & 2032
- Table 70: North Africa Bathroom Grab Bars Volume (K) Forecast, by Application 2019 & 2032
- Table 71: South Africa Bathroom Grab Bars Revenue (million) Forecast, by Application 2019 & 2032
- Table 72: South Africa Bathroom Grab Bars Volume (K) Forecast, by Application 2019 & 2032
- Table 73: Rest of Middle East & Africa Bathroom Grab Bars Revenue (million) Forecast, by Application 2019 & 2032
- Table 74: Rest of Middle East & Africa Bathroom Grab Bars Volume (K) Forecast, by Application 2019 & 2032
- Table 75: Global Bathroom Grab Bars Revenue million Forecast, by Application 2019 & 2032
- Table 76: Global Bathroom Grab Bars Volume K Forecast, by Application 2019 & 2032
- Table 77: Global Bathroom Grab Bars Revenue million Forecast, by Types 2019 & 2032
- Table 78: Global Bathroom Grab Bars Volume K Forecast, by Types 2019 & 2032
- Table 79: Global Bathroom Grab Bars Revenue million Forecast, by Country 2019 & 2032
- Table 80: Global Bathroom Grab Bars Volume K Forecast, by Country 2019 & 2032
- Table 81: China Bathroom Grab Bars Revenue (million) Forecast, by Application 2019 & 2032
- Table 82: China Bathroom Grab Bars Volume (K) Forecast, by Application 2019 & 2032
- Table 83: India Bathroom Grab Bars Revenue (million) Forecast, by Application 2019 & 2032
- Table 84: India Bathroom Grab Bars Volume (K) Forecast, by Application 2019 & 2032
- Table 85: Japan Bathroom Grab Bars Revenue (million) Forecast, by Application 2019 & 2032
- Table 86: Japan Bathroom Grab Bars Volume (K) Forecast, by Application 2019 & 2032
- Table 87: South Korea Bathroom Grab Bars Revenue (million) Forecast, by Application 2019 & 2032
- Table 88: South Korea Bathroom Grab Bars Volume (K) Forecast, by Application 2019 & 2032
- Table 89: ASEAN Bathroom Grab Bars Revenue (million) Forecast, by Application 2019 & 2032
- Table 90: ASEAN Bathroom Grab Bars Volume (K) Forecast, by Application 2019 & 2032
- Table 91: Oceania Bathroom Grab Bars Revenue (million) Forecast, by Application 2019 & 2032
- Table 92: Oceania Bathroom Grab Bars Volume (K) Forecast, by Application 2019 & 2032
- Table 93: Rest of Asia Pacific Bathroom Grab Bars Revenue (million) Forecast, by Application 2019 & 2032
- Table 94: Rest of Asia Pacific Bathroom Grab Bars Volume (K) Forecast, by Application 2019 & 2032
Frequently Asked Questions
1. What is the projected Compound Annual Growth Rate (CAGR) of the Bathroom Grab Bars?
The projected CAGR is approximately XX%.
2. Which companies are prominent players in the Bathroom Grab Bars?
Key companies in the market include Delta Faucet Company, Moen, Invacare, Besco Medical, AKW Medicare, HealthCraft Products, MIXTA, Rehastage, Etac, Parsons ADL, Ponte Giulio, HERDEGEN.
3. What are the main segments of the Bathroom Grab Bars?
The market segments include Application, Types.
4. Can you provide details about the market size?
The market size is estimated to be USD XXX million as of 2022.
5. What are some drivers contributing to market growth?
N/A
6. What are the notable trends driving market growth?
N/A
7. Are there any restraints impacting market growth?
N/A
8. Can you provide examples of recent developments in the market?
N/A
9. What pricing options are available for accessing the report?
Pricing options include single-user, multi-user, and enterprise licenses priced at USD 3950.00, USD 5925.00, and USD 7900.00 respectively.
10. Is the market size provided in terms of value or volume?
The market size is provided in terms of value, measured in million and volume, measured in K.
11. Are there any specific market keywords associated with the report?
Yes, the market keyword associated with the report is "Bathroom Grab Bars," which aids in identifying and referencing the specific market segment covered.
12. How do I determine which pricing option suits my needs best?
The pricing options vary based on user requirements and access needs. Individual users may opt for single-user licenses, while businesses requiring broader access may choose multi-user or enterprise licenses for cost-effective access to the report.
13. Are there any additional resources or data provided in the Bathroom Grab Bars report?
While the report offers comprehensive insights, it's advisable to review the specific contents or supplementary materials provided to ascertain if additional resources or data are available.
14. How can I stay updated on further developments or reports in the Bathroom Grab Bars?
To stay informed about further developments, trends, and reports in the Bathroom Grab Bars, consider subscribing to industry newsletters, following relevant companies and organizations, or regularly checking reputable industry news sources and publications.
Methodology
Step 1 - Identification of Relevant Samples Size from Population Database


Step 2 - Approaches for Defining Global Market Size (Value, Volume* & Price*)

Note*: In applicable scenarios
Step 3 - Data Sources
Primary Research
- Web Analytics
- Survey Reports
- Research Institute
- Latest Research Reports
- Opinion Leaders
Secondary Research
- Annual Reports
- White Paper
- Latest Press Release
- Industry Association
- Paid Database
- Investor Presentations

Step 4 - Data Triangulation
Involves using different sources of information in order to increase the validity of a study
These sources are likely to be stakeholders in a program - participants, other researchers, program staff, other community members, and so on.
Then we put all data in single framework & apply various statistical tools to find out the dynamic on the market.
During the analysis stage, feedback from the stakeholder groups would be compared to determine areas of agreement as well as areas of divergence
