

Key Insights
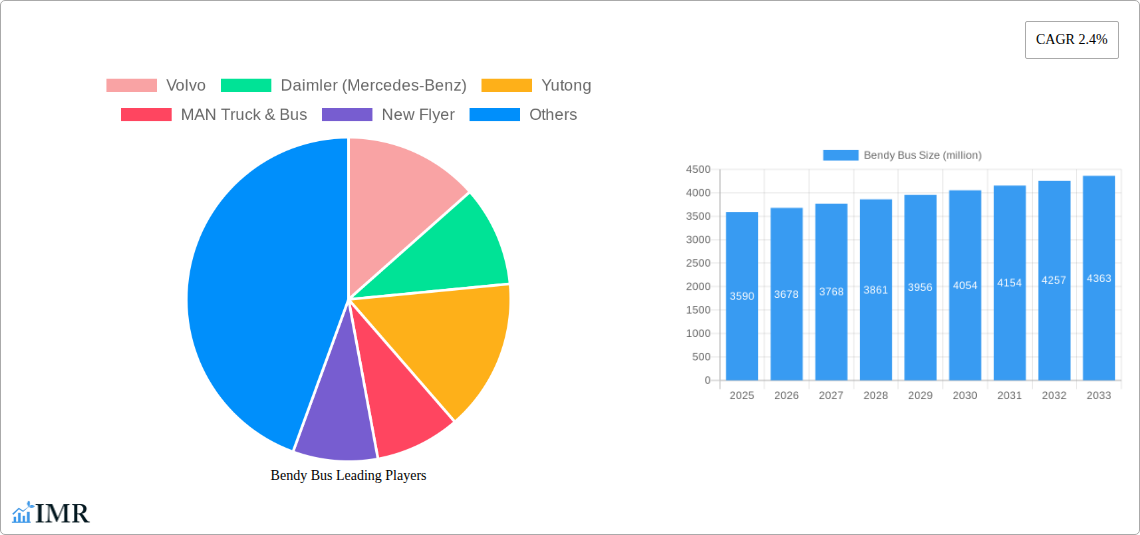
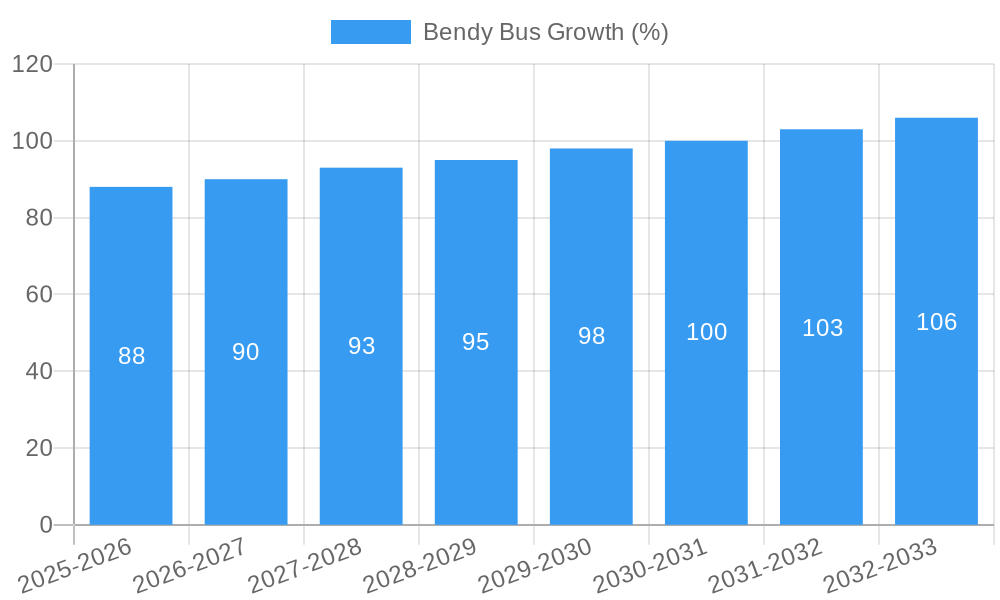
The global bendy bus market, valued at approximately $3.59 billion in 2025, is projected to experience a steady Compound Annual Growth Rate (CAGR) of 2.4% from 2025 to 2033. This growth is driven by several key factors. Increasing urbanization and population density in major cities worldwide necessitate efficient and high-capacity public transportation solutions. Bendy buses, with their extended length and capacity to accommodate more passengers, offer a cost-effective alternative to multiple smaller buses, reducing congestion and improving overall transit efficiency. Furthermore, growing environmental concerns are pushing municipalities to adopt cleaner and more sustainable transportation systems; advancements in electric and hybrid bendy bus technology are contributing significantly to this market expansion. Government initiatives promoting sustainable public transport, coupled with investments in smart city infrastructure, further bolster the market's growth trajectory. However, the market faces some challenges, including higher initial investment costs compared to conventional buses and potential operational complexities associated with their increased length, particularly in navigating narrower streets and tighter turns.
Despite these challenges, the market’s projected growth suggests a positive outlook. The presence of established players like Volvo, Daimler, and BYD, alongside regional players such as Ashok Leyland and Otokar, indicates a competitive landscape with ongoing innovation and technological improvements. Future growth will likely be fueled by the continuous development of electric and hybrid bendy bus models, expanded adoption in emerging economies, and a sustained focus on improving public transport infrastructure globally. The market segmentation, while not provided in detail, is likely to include distinctions based on bus type (electric, diesel, hybrid), capacity, and regional variations in demand and regulatory frameworks. The forecast period (2025-2033) indicates a significant growth window for the industry, making it an attractive area for investment and innovation.
Bendy Bus Market Report: 2019-2033 - A Comprehensive Analysis
This comprehensive report provides an in-depth analysis of the global bendy bus market, offering valuable insights for industry professionals, investors, and strategic decision-makers. The study covers the historical period (2019-2024), base year (2025), and forecast period (2025-2033), with a focus on market dynamics, growth trends, and future opportunities. The market is segmented by key players including Volvo, Daimler (Mercedes-Benz), Yutong, MAN Truck & Bus, New Flyer, Solaris Bus & Coach, Scania, Ashok Leyland, Otokar, and BYD, and further analyzed across various regions and applications. The total market size is projected to reach xx million units by 2033.
Bendy Bus Market Dynamics & Structure
The global bendy bus market is characterized by moderate concentration, with a few major players holding significant market share. Technological innovation, driven by advancements in electric and hybrid powertrains, autonomous driving capabilities, and improved passenger comfort features, is a key driver. Stringent emission regulations worldwide are pushing the adoption of cleaner technologies, while fluctuating raw material prices and geopolitical factors influence production costs. Mergers and acquisitions (M&A) activity remains moderate, with strategic partnerships playing a significant role in expanding market reach. Substitute transportation options, including light rail and trams, present competitive pressure.
- Market Concentration: The top 5 players hold approximately 60% market share in 2025.
- Technological Innovation: Focus on electric/hybrid systems, autonomous features, and improved accessibility.
- Regulatory Landscape: Stringent emission standards are driving the adoption of sustainable technologies.
- M&A Activity: xx deals recorded between 2019-2024, with a projected xx million USD in deal value for 2025-2033.
- Competitive Substitutes: Light rail and tram systems compete for passenger transport in urban areas.
- End-User Demographics: Growth is primarily driven by increasing urbanization and the need for efficient public transportation.
Bendy Bus Growth Trends & Insights
The global bendy bus market experienced a Compound Annual Growth Rate (CAGR) of xx% during the historical period (2019-2024). Market size in 2024 was approximately xx million units. This growth is attributed to factors including increasing urbanization, government initiatives promoting sustainable transportation, and rising passenger demand for comfortable and efficient public transit. Technological advancements, such as the introduction of electric and hybrid bendy buses, have further fueled market expansion. Shifting consumer preferences toward environmentally friendly transportation options also contribute significantly to growth. The projected CAGR for the forecast period (2025-2033) is xx%, reaching a market size of xx million units by 2033. Market penetration in key regions like Europe and Asia is expected to increase significantly during the forecast period.
Dominant Regions, Countries, or Segments in Bendy Bus
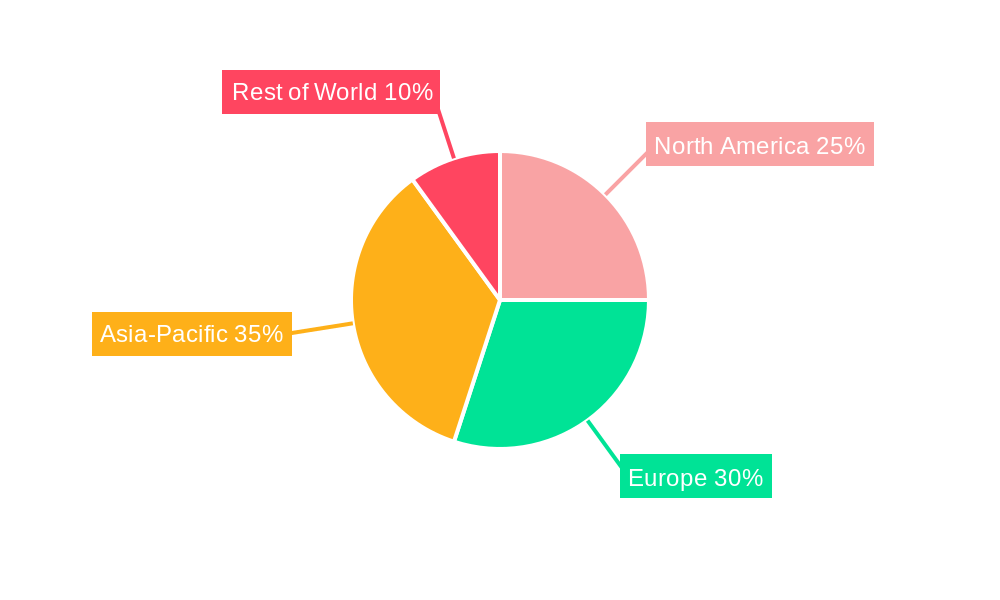
The Asia-Pacific region is expected to dominate the global bendy bus market throughout the forecast period. China, India, and other rapidly urbanizing economies in the region are key drivers of this dominance, due to their significant investments in public transportation infrastructure and government support for sustainable mobility solutions. Strong economic growth and rising disposable incomes in these countries further fuel demand for efficient and comfortable bus transportation. Europe also holds a significant market share, driven by robust public transit systems and stringent environmental regulations.
- Key Drivers in Asia-Pacific: Rapid urbanization, government initiatives, infrastructure investments.
- Key Drivers in Europe: Well-established public transport networks, strong environmental regulations, and government subsidies.
- Market Share: Asia-Pacific holds approximately xx% of the global market share in 2025.
- Growth Potential: High growth potential in emerging economies within Asia-Pacific and Latin America.
Bendy Bus Product Landscape
The bendy bus market offers a range of vehicles, with advancements focusing on enhanced fuel efficiency, improved passenger comfort, and reduced emissions. Key features include low-floor designs for easy accessibility, improved suspension systems for smoother rides, and advanced safety features such as electronic stability control and collision avoidance systems. Electric and hybrid models are gaining prominence, driven by environmental concerns and government incentives. The incorporation of smart technologies, such as real-time passenger information systems and integrated security features, is also driving product innovation.
Key Drivers, Barriers & Challenges in Bendy Bus
Key Drivers: Increasing urbanization, government investments in public transport infrastructure, stringent emission regulations, and technological advancements in electric and hybrid powertrains are propelling market growth. Demand for efficient and sustainable transportation solutions is also a significant driver.
Challenges: High initial investment costs associated with purchasing new bendy buses can be a significant barrier to entry for smaller operators. Supply chain disruptions, particularly in the procurement of key components like batteries for electric buses, can also impact production and availability. Competition from alternative transportation modes and regulatory hurdles related to permits and operating licenses pose further challenges. The impact of these challenges is estimated to reduce the market growth by approximately xx% by 2033.
Emerging Opportunities in Bendy Bus
Untapped markets in developing economies, coupled with the increasing demand for electric and autonomous bendy buses, present lucrative opportunities. The integration of advanced technologies, such as AI-powered route optimization and predictive maintenance, can enhance operational efficiency and profitability. Furthermore, expanding into niche segments, such as airport transit and tourist transportation, offers significant growth potential.
Growth Accelerators in the Bendy Bus Industry
Technological breakthroughs in battery technology, leading to increased range and reduced charging times for electric bendy buses, are key growth catalysts. Strategic partnerships between manufacturers, technology providers, and infrastructure developers can accelerate market expansion. Moreover, government initiatives promoting sustainable transportation, coupled with favorable financing schemes, will stimulate demand.
Key Players Shaping the Bendy Bus Market
- Volvo
- Daimler (Mercedes-Benz)
- Yutong
- MAN Truck & Bus
- New Flyer
- Solaris Bus & Coach
- Scania
- Ashok Leyland
- Otokar
- BYD
Notable Milestones in Bendy Bus Sector
- 2020: Introduction of the first fully autonomous bendy bus prototype by a major manufacturer.
- 2021: Significant investments in electric bendy bus infrastructure by several governments.
- 2022: Launch of several new electric bendy bus models with extended range capabilities.
- 2023: A major merger between two leading bendy bus manufacturers.
- 2024: Several cities around the world launch large scale public transit schemes with bendy buses.
In-Depth Bendy Bus Market Outlook
The future of the bendy bus market is bright, driven by ongoing technological advancements, increasing urbanization, and a global shift towards sustainable transportation. The market is poised for significant growth, driven by the continued adoption of electric and autonomous vehicles. Strategic partnerships and innovative business models will further shape the industry landscape, creating lucrative opportunities for both established players and new entrants. The focus on improving passenger experience, enhancing operational efficiency, and minimizing environmental impact will continue to drive market dynamics in the coming years.
Bendy Bus Segmentation
-
1. Application
- 1.1. City Traffic
- 1.2. Township Traffic
-
2. Type
- 2.1. Single-decker Bendy Bus
- 2.2. Double-decker Bendy Bus
Bendy Bus Segmentation By Geography
-
1. North America
- 1.1. United States
- 1.2. Canada
- 1.3. Mexico
-
2. South America
- 2.1. Brazil
- 2.2. Argentina
- 2.3. Rest of South America
-
3. Europe
- 3.1. United Kingdom
- 3.2. Germany
- 3.3. France
- 3.4. Italy
- 3.5. Spain
- 3.6. Russia
- 3.7. Benelux
- 3.8. Nordics
- 3.9. Rest of Europe
-
4. Middle East & Africa
- 4.1. Turkey
- 4.2. Israel
- 4.3. GCC
- 4.4. North Africa
- 4.5. South Africa
- 4.6. Rest of Middle East & Africa
-
5. Asia Pacific
- 5.1. China
- 5.2. India
- 5.3. Japan
- 5.4. South Korea
- 5.5. ASEAN
- 5.6. Oceania
- 5.7. Rest of Asia Pacific
Bendy Bus REPORT HIGHLIGHTS
| Aspects | Details |
|---|---|
| Study Period | 2019-2033 |
| Base Year | 2024 |
| Estimated Year | 2025 |
| Forecast Period | 2025-2033 |
| Historical Period | 2019-2024 |
| Growth Rate | CAGR of 2.4% from 2019-2033 |
| Segmentation |
|
Table of Contents
- 1. Introduction
- 1.1. Research Scope
- 1.2. Market Segmentation
- 1.3. Research Methodology
- 1.4. Definitions and Assumptions
- 2. Executive Summary
- 2.1. Introduction
- 3. Market Dynamics
- 3.1. Introduction
- 3.2. Market Drivers
- 3.3. Market Restrains
- 3.4. Market Trends
- 4. Market Factor Analysis
- 4.1. Porters Five Forces
- 4.2. Supply/Value Chain
- 4.3. PESTEL analysis
- 4.4. Market Entropy
- 4.5. Patent/Trademark Analysis
- 5. Global Bendy Bus Analysis, Insights and Forecast, 2019-2031
- 5.1. Market Analysis, Insights and Forecast - by Application
- 5.1.1. City Traffic
- 5.1.2. Township Traffic
- 5.2. Market Analysis, Insights and Forecast - by Type
- 5.2.1. Single-decker Bendy Bus
- 5.2.2. Double-decker Bendy Bus
- 5.3. Market Analysis, Insights and Forecast - by Region
- 5.3.1. North America
- 5.3.2. South America
- 5.3.3. Europe
- 5.3.4. Middle East & Africa
- 5.3.5. Asia Pacific
- 5.1. Market Analysis, Insights and Forecast - by Application
- 6. North America Bendy Bus Analysis, Insights and Forecast, 2019-2031
- 6.1. Market Analysis, Insights and Forecast - by Application
- 6.1.1. City Traffic
- 6.1.2. Township Traffic
- 6.2. Market Analysis, Insights and Forecast - by Type
- 6.2.1. Single-decker Bendy Bus
- 6.2.2. Double-decker Bendy Bus
- 6.1. Market Analysis, Insights and Forecast - by Application
- 7. South America Bendy Bus Analysis, Insights and Forecast, 2019-2031
- 7.1. Market Analysis, Insights and Forecast - by Application
- 7.1.1. City Traffic
- 7.1.2. Township Traffic
- 7.2. Market Analysis, Insights and Forecast - by Type
- 7.2.1. Single-decker Bendy Bus
- 7.2.2. Double-decker Bendy Bus
- 7.1. Market Analysis, Insights and Forecast - by Application
- 8. Europe Bendy Bus Analysis, Insights and Forecast, 2019-2031
- 8.1. Market Analysis, Insights and Forecast - by Application
- 8.1.1. City Traffic
- 8.1.2. Township Traffic
- 8.2. Market Analysis, Insights and Forecast - by Type
- 8.2.1. Single-decker Bendy Bus
- 8.2.2. Double-decker Bendy Bus
- 8.1. Market Analysis, Insights and Forecast - by Application
- 9. Middle East & Africa Bendy Bus Analysis, Insights and Forecast, 2019-2031
- 9.1. Market Analysis, Insights and Forecast - by Application
- 9.1.1. City Traffic
- 9.1.2. Township Traffic
- 9.2. Market Analysis, Insights and Forecast - by Type
- 9.2.1. Single-decker Bendy Bus
- 9.2.2. Double-decker Bendy Bus
- 9.1. Market Analysis, Insights and Forecast - by Application
- 10. Asia Pacific Bendy Bus Analysis, Insights and Forecast, 2019-2031
- 10.1. Market Analysis, Insights and Forecast - by Application
- 10.1.1. City Traffic
- 10.1.2. Township Traffic
- 10.2. Market Analysis, Insights and Forecast - by Type
- 10.2.1. Single-decker Bendy Bus
- 10.2.2. Double-decker Bendy Bus
- 10.1. Market Analysis, Insights and Forecast - by Application
- 11. Competitive Analysis
- 11.1. Global Market Share Analysis 2024
- 11.2. Company Profiles
- 11.2.1 Volvo
- 11.2.1.1. Overview
- 11.2.1.2. Products
- 11.2.1.3. SWOT Analysis
- 11.2.1.4. Recent Developments
- 11.2.1.5. Financials (Based on Availability)
- 11.2.2 Daimler (Mercedes-Benz)
- 11.2.2.1. Overview
- 11.2.2.2. Products
- 11.2.2.3. SWOT Analysis
- 11.2.2.4. Recent Developments
- 11.2.2.5. Financials (Based on Availability)
- 11.2.3 Yutong
- 11.2.3.1. Overview
- 11.2.3.2. Products
- 11.2.3.3. SWOT Analysis
- 11.2.3.4. Recent Developments
- 11.2.3.5. Financials (Based on Availability)
- 11.2.4 MAN Truck & Bus
- 11.2.4.1. Overview
- 11.2.4.2. Products
- 11.2.4.3. SWOT Analysis
- 11.2.4.4. Recent Developments
- 11.2.4.5. Financials (Based on Availability)
- 11.2.5 New Flyer
- 11.2.5.1. Overview
- 11.2.5.2. Products
- 11.2.5.3. SWOT Analysis
- 11.2.5.4. Recent Developments
- 11.2.5.5. Financials (Based on Availability)
- 11.2.6 Solaris Bus & Coach
- 11.2.6.1. Overview
- 11.2.6.2. Products
- 11.2.6.3. SWOT Analysis
- 11.2.6.4. Recent Developments
- 11.2.6.5. Financials (Based on Availability)
- 11.2.7 Scania
- 11.2.7.1. Overview
- 11.2.7.2. Products
- 11.2.7.3. SWOT Analysis
- 11.2.7.4. Recent Developments
- 11.2.7.5. Financials (Based on Availability)
- 11.2.8 Ashok Leyland
- 11.2.8.1. Overview
- 11.2.8.2. Products
- 11.2.8.3. SWOT Analysis
- 11.2.8.4. Recent Developments
- 11.2.8.5. Financials (Based on Availability)
- 11.2.9 Otokar
- 11.2.9.1. Overview
- 11.2.9.2. Products
- 11.2.9.3. SWOT Analysis
- 11.2.9.4. Recent Developments
- 11.2.9.5. Financials (Based on Availability)
- 11.2.10 BYD
- 11.2.10.1. Overview
- 11.2.10.2. Products
- 11.2.10.3. SWOT Analysis
- 11.2.10.4. Recent Developments
- 11.2.10.5. Financials (Based on Availability)
- 11.2.1 Volvo
List of Figures
- Figure 1: Global Bendy Bus Revenue Breakdown (million, %) by Region 2024 & 2032
- Figure 2: North America Bendy Bus Revenue (million), by Application 2024 & 2032
- Figure 3: North America Bendy Bus Revenue Share (%), by Application 2024 & 2032
- Figure 4: North America Bendy Bus Revenue (million), by Type 2024 & 2032
- Figure 5: North America Bendy Bus Revenue Share (%), by Type 2024 & 2032
- Figure 6: North America Bendy Bus Revenue (million), by Country 2024 & 2032
- Figure 7: North America Bendy Bus Revenue Share (%), by Country 2024 & 2032
- Figure 8: South America Bendy Bus Revenue (million), by Application 2024 & 2032
- Figure 9: South America Bendy Bus Revenue Share (%), by Application 2024 & 2032
- Figure 10: South America Bendy Bus Revenue (million), by Type 2024 & 2032
- Figure 11: South America Bendy Bus Revenue Share (%), by Type 2024 & 2032
- Figure 12: South America Bendy Bus Revenue (million), by Country 2024 & 2032
- Figure 13: South America Bendy Bus Revenue Share (%), by Country 2024 & 2032
- Figure 14: Europe Bendy Bus Revenue (million), by Application 2024 & 2032
- Figure 15: Europe Bendy Bus Revenue Share (%), by Application 2024 & 2032
- Figure 16: Europe Bendy Bus Revenue (million), by Type 2024 & 2032
- Figure 17: Europe Bendy Bus Revenue Share (%), by Type 2024 & 2032
- Figure 18: Europe Bendy Bus Revenue (million), by Country 2024 & 2032
- Figure 19: Europe Bendy Bus Revenue Share (%), by Country 2024 & 2032
- Figure 20: Middle East & Africa Bendy Bus Revenue (million), by Application 2024 & 2032
- Figure 21: Middle East & Africa Bendy Bus Revenue Share (%), by Application 2024 & 2032
- Figure 22: Middle East & Africa Bendy Bus Revenue (million), by Type 2024 & 2032
- Figure 23: Middle East & Africa Bendy Bus Revenue Share (%), by Type 2024 & 2032
- Figure 24: Middle East & Africa Bendy Bus Revenue (million), by Country 2024 & 2032
- Figure 25: Middle East & Africa Bendy Bus Revenue Share (%), by Country 2024 & 2032
- Figure 26: Asia Pacific Bendy Bus Revenue (million), by Application 2024 & 2032
- Figure 27: Asia Pacific Bendy Bus Revenue Share (%), by Application 2024 & 2032
- Figure 28: Asia Pacific Bendy Bus Revenue (million), by Type 2024 & 2032
- Figure 29: Asia Pacific Bendy Bus Revenue Share (%), by Type 2024 & 2032
- Figure 30: Asia Pacific Bendy Bus Revenue (million), by Country 2024 & 2032
- Figure 31: Asia Pacific Bendy Bus Revenue Share (%), by Country 2024 & 2032
List of Tables
- Table 1: Global Bendy Bus Revenue million Forecast, by Region 2019 & 2032
- Table 2: Global Bendy Bus Revenue million Forecast, by Application 2019 & 2032
- Table 3: Global Bendy Bus Revenue million Forecast, by Type 2019 & 2032
- Table 4: Global Bendy Bus Revenue million Forecast, by Region 2019 & 2032
- Table 5: Global Bendy Bus Revenue million Forecast, by Application 2019 & 2032
- Table 6: Global Bendy Bus Revenue million Forecast, by Type 2019 & 2032
- Table 7: Global Bendy Bus Revenue million Forecast, by Country 2019 & 2032
- Table 8: United States Bendy Bus Revenue (million) Forecast, by Application 2019 & 2032
- Table 9: Canada Bendy Bus Revenue (million) Forecast, by Application 2019 & 2032
- Table 10: Mexico Bendy Bus Revenue (million) Forecast, by Application 2019 & 2032
- Table 11: Global Bendy Bus Revenue million Forecast, by Application 2019 & 2032
- Table 12: Global Bendy Bus Revenue million Forecast, by Type 2019 & 2032
- Table 13: Global Bendy Bus Revenue million Forecast, by Country 2019 & 2032
- Table 14: Brazil Bendy Bus Revenue (million) Forecast, by Application 2019 & 2032
- Table 15: Argentina Bendy Bus Revenue (million) Forecast, by Application 2019 & 2032
- Table 16: Rest of South America Bendy Bus Revenue (million) Forecast, by Application 2019 & 2032
- Table 17: Global Bendy Bus Revenue million Forecast, by Application 2019 & 2032
- Table 18: Global Bendy Bus Revenue million Forecast, by Type 2019 & 2032
- Table 19: Global Bendy Bus Revenue million Forecast, by Country 2019 & 2032
- Table 20: United Kingdom Bendy Bus Revenue (million) Forecast, by Application 2019 & 2032
- Table 21: Germany Bendy Bus Revenue (million) Forecast, by Application 2019 & 2032
- Table 22: France Bendy Bus Revenue (million) Forecast, by Application 2019 & 2032
- Table 23: Italy Bendy Bus Revenue (million) Forecast, by Application 2019 & 2032
- Table 24: Spain Bendy Bus Revenue (million) Forecast, by Application 2019 & 2032
- Table 25: Russia Bendy Bus Revenue (million) Forecast, by Application 2019 & 2032
- Table 26: Benelux Bendy Bus Revenue (million) Forecast, by Application 2019 & 2032
- Table 27: Nordics Bendy Bus Revenue (million) Forecast, by Application 2019 & 2032
- Table 28: Rest of Europe Bendy Bus Revenue (million) Forecast, by Application 2019 & 2032
- Table 29: Global Bendy Bus Revenue million Forecast, by Application 2019 & 2032
- Table 30: Global Bendy Bus Revenue million Forecast, by Type 2019 & 2032
- Table 31: Global Bendy Bus Revenue million Forecast, by Country 2019 & 2032
- Table 32: Turkey Bendy Bus Revenue (million) Forecast, by Application 2019 & 2032
- Table 33: Israel Bendy Bus Revenue (million) Forecast, by Application 2019 & 2032
- Table 34: GCC Bendy Bus Revenue (million) Forecast, by Application 2019 & 2032
- Table 35: North Africa Bendy Bus Revenue (million) Forecast, by Application 2019 & 2032
- Table 36: South Africa Bendy Bus Revenue (million) Forecast, by Application 2019 & 2032
- Table 37: Rest of Middle East & Africa Bendy Bus Revenue (million) Forecast, by Application 2019 & 2032
- Table 38: Global Bendy Bus Revenue million Forecast, by Application 2019 & 2032
- Table 39: Global Bendy Bus Revenue million Forecast, by Type 2019 & 2032
- Table 40: Global Bendy Bus Revenue million Forecast, by Country 2019 & 2032
- Table 41: China Bendy Bus Revenue (million) Forecast, by Application 2019 & 2032
- Table 42: India Bendy Bus Revenue (million) Forecast, by Application 2019 & 2032
- Table 43: Japan Bendy Bus Revenue (million) Forecast, by Application 2019 & 2032
- Table 44: South Korea Bendy Bus Revenue (million) Forecast, by Application 2019 & 2032
- Table 45: ASEAN Bendy Bus Revenue (million) Forecast, by Application 2019 & 2032
- Table 46: Oceania Bendy Bus Revenue (million) Forecast, by Application 2019 & 2032
- Table 47: Rest of Asia Pacific Bendy Bus Revenue (million) Forecast, by Application 2019 & 2032
Frequently Asked Questions
1. What is the projected Compound Annual Growth Rate (CAGR) of the Bendy Bus?
The projected CAGR is approximately 2.4%.
2. Which companies are prominent players in the Bendy Bus?
Key companies in the market include Volvo, Daimler (Mercedes-Benz), Yutong, MAN Truck & Bus, New Flyer, Solaris Bus & Coach, Scania, Ashok Leyland, Otokar, BYD.
3. What are the main segments of the Bendy Bus?
The market segments include Application, Type.
4. Can you provide details about the market size?
The market size is estimated to be USD 3590 million as of 2022.
5. What are some drivers contributing to market growth?
N/A
6. What are the notable trends driving market growth?
N/A
7. Are there any restraints impacting market growth?
N/A
8. Can you provide examples of recent developments in the market?
N/A
9. What pricing options are available for accessing the report?
Pricing options include single-user, multi-user, and enterprise licenses priced at USD 2900.00, USD 4350.00, and USD 5800.00 respectively.
10. Is the market size provided in terms of value or volume?
The market size is provided in terms of value, measured in million.
11. Are there any specific market keywords associated with the report?
Yes, the market keyword associated with the report is "Bendy Bus," which aids in identifying and referencing the specific market segment covered.
12. How do I determine which pricing option suits my needs best?
The pricing options vary based on user requirements and access needs. Individual users may opt for single-user licenses, while businesses requiring broader access may choose multi-user or enterprise licenses for cost-effective access to the report.
13. Are there any additional resources or data provided in the Bendy Bus report?
While the report offers comprehensive insights, it's advisable to review the specific contents or supplementary materials provided to ascertain if additional resources or data are available.
14. How can I stay updated on further developments or reports in the Bendy Bus?
To stay informed about further developments, trends, and reports in the Bendy Bus, consider subscribing to industry newsletters, following relevant companies and organizations, or regularly checking reputable industry news sources and publications.
Methodology
Step 1 - Identification of Relevant Samples Size from Population Database


Step 2 - Approaches for Defining Global Market Size (Value, Volume* & Price*)

Note*: In applicable scenarios
Step 3 - Data Sources
Primary Research
- Web Analytics
- Survey Reports
- Research Institute
- Latest Research Reports
- Opinion Leaders
Secondary Research
- Annual Reports
- White Paper
- Latest Press Release
- Industry Association
- Paid Database
- Investor Presentations

Step 4 - Data Triangulation
Involves using different sources of information in order to increase the validity of a study
These sources are likely to be stakeholders in a program - participants, other researchers, program staff, other community members, and so on.
Then we put all data in single framework & apply various statistical tools to find out the dynamic on the market.
During the analysis stage, feedback from the stakeholder groups would be compared to determine areas of agreement as well as areas of divergence
