

Key Insights
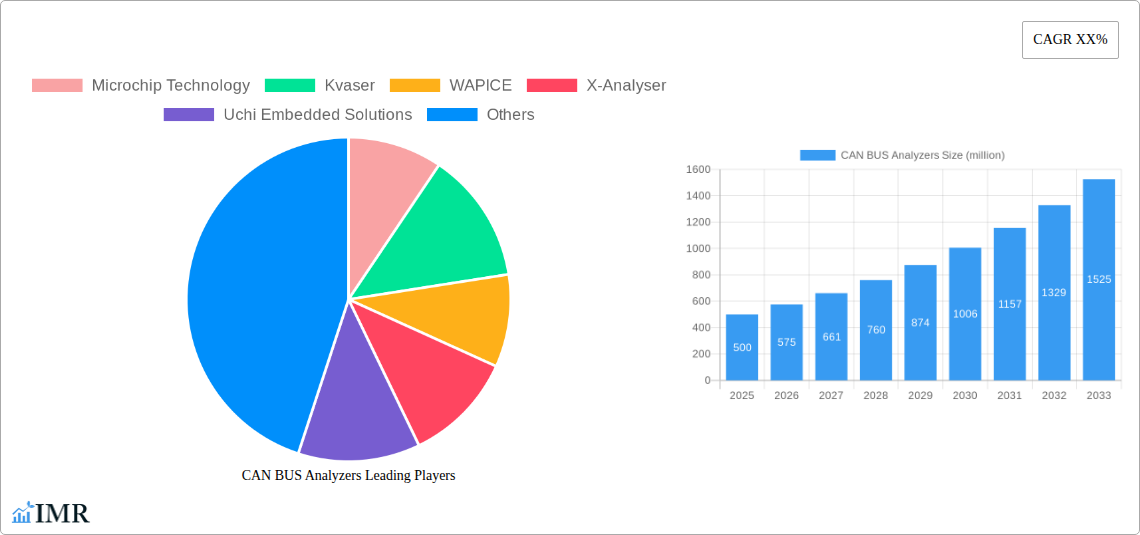
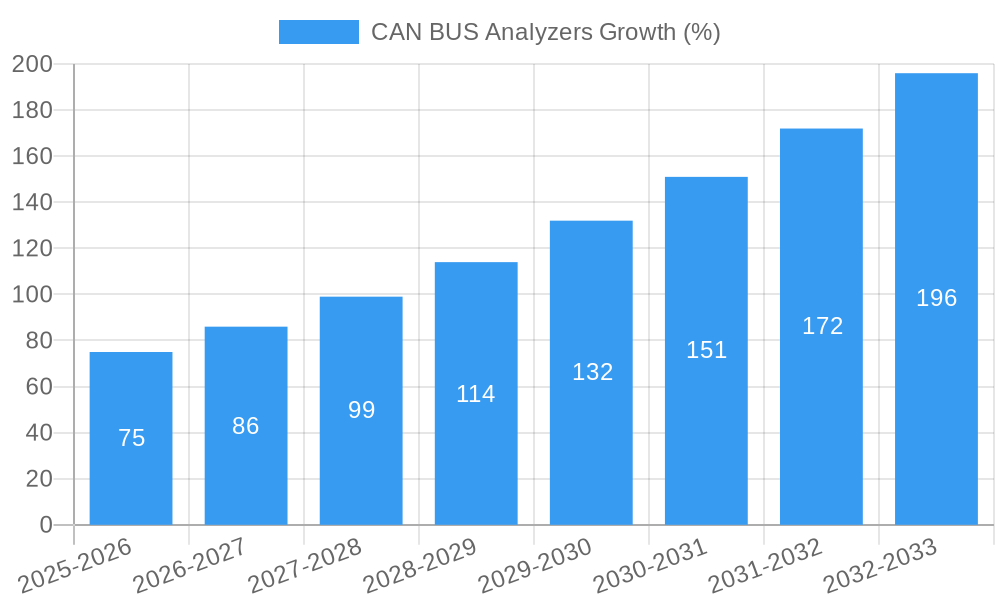
The CAN BUS analyzer market is experiencing robust growth, driven by the increasing adoption of CAN bus technology across diverse sectors like automotive, industrial automation, and aerospace. The market's expansion is fueled by the rising demand for efficient and reliable data communication in these applications, necessitating advanced diagnostic and analysis tools. The automotive industry, a major driver, is witnessing a surge in the deployment of advanced driver-assistance systems (ADAS) and electric vehicles (EVs), significantly boosting the need for sophisticated CAN bus analyzers to ensure optimal performance and safety. Furthermore, the growing complexity of embedded systems and the need for real-time diagnostics are fueling market growth. While challenges such as the high cost of advanced analyzers and the availability of open-source alternatives exist, the overall market outlook remains positive, with a projected Compound Annual Growth Rate (CAGR) of approximately 15% over the forecast period (2025-2033). This growth is expected to be driven by technological advancements leading to more compact, user-friendly, and cost-effective solutions.
The competitive landscape is characterized by a mix of established players and emerging companies. Key players like Microchip Technology, Kvaser, and Teledyne LeCroy dominate the market with their comprehensive product portfolios and strong brand recognition. However, smaller companies are also making significant inroads by offering specialized solutions and focusing on niche applications. Future growth will likely be influenced by factors such as the increasing integration of artificial intelligence (AI) and machine learning (ML) in CAN bus analysis, enabling more sophisticated diagnostic capabilities and predictive maintenance. The development of standardized protocols and interoperability across different systems will also play a crucial role in shaping the market trajectory. The expanding adoption of Industry 4.0 and the Internet of Things (IoT) will further fuel the demand for advanced CAN bus analyzers in the coming years.
CAN BUS Analyzers Market Report: 2019-2033
This comprehensive report provides a detailed analysis of the CAN BUS Analyzers market, encompassing market dynamics, growth trends, regional segmentation, product landscape, key players, and future outlook. The study period covers 2019-2033, with 2025 as the base and estimated year. The forecast period is 2025-2033, and the historical period is 2019-2024. This report is invaluable for industry professionals, investors, and strategic decision-makers seeking a deep understanding of this dynamic market. The global market size is projected to reach xx million units by 2033.
CAN BUS Analyzers Market Dynamics & Structure
The CAN BUS Analyzer market is characterized by a moderately concentrated landscape, with key players like Microchip Technology, Kvaser, and Teledyne LeCroy holding significant market share. The market’s growth is fueled by technological innovations, such as the increasing adoption of high-speed CAN FD and the development of more sophisticated diagnostic tools. Stringent automotive safety regulations and the rising demand for connected and autonomous vehicles are major drivers. However, high initial investment costs and the complexity of CAN bus systems present challenges. The market witnesses continuous M&A activity, with xx deals recorded between 2019 and 2024, primarily focused on expanding product portfolios and geographic reach.
- Market Concentration: Moderately concentrated, with top 5 players holding approximately xx% market share in 2025.
- Technological Innovation: Driven by CAN FD adoption, improved diagnostics, and integration with other communication protocols.
- Regulatory Frameworks: Stringent automotive safety standards and emission regulations are key growth drivers.
- Competitive Substitutes: Limited, with few direct substitutes for specialized CAN bus analysis.
- End-User Demographics: Primarily automotive, industrial automation, and medical device manufacturers.
- M&A Trends: Consolidation through acquisitions to expand product lines and market reach.
CAN BUS Analyzers Growth Trends & Insights
The CAN BUS Analyzers market experienced robust growth during the historical period (2019-2024), with a CAGR of xx%. This growth is attributed to the increasing adoption of CAN bus technology across various industries and the rising demand for advanced diagnostic tools. The market is expected to maintain a healthy CAGR of xx% during the forecast period (2025-2033), driven by factors such as the proliferation of electric vehicles, the rise of Industry 4.0, and the growing need for efficient vehicle diagnostics and maintenance. Technological advancements like improved software functionalities, miniaturization, and wireless connectivity are further stimulating adoption rates. Market penetration is expected to reach xx% by 2033, particularly in the automotive and industrial sectors. Consumer behavior shifts towards more connected and automated systems are further accelerating market growth.
Dominant Regions, Countries, or Segments in CAN BUS Analyzers
The North American and European regions currently dominate the CAN BUS Analyzers market, accounting for approximately xx% of the global market share in 2025. This dominance is primarily attributed to the well-established automotive and industrial automation sectors in these regions, coupled with stringent emission and safety standards driving demand for sophisticated diagnostic tools. However, the Asia-Pacific region is projected to experience the fastest growth during the forecast period due to rapid industrialization, significant investments in automotive manufacturing, and the increasing adoption of advanced driver-assistance systems (ADAS).
- Key Drivers in North America: Strong automotive industry, established infrastructure, stringent regulations.
- Key Drivers in Europe: Mature automotive and industrial sectors, focus on sustainable transportation.
- Key Drivers in Asia-Pacific: Rapid industrialization, increasing automotive production, government support for EV adoption.
CAN BUS Analyzers Product Landscape
The CAN BUS Analyzer market offers a diverse range of products, from basic handheld devices to sophisticated software-defined solutions. These analyzers vary in features, capabilities, and price points, catering to different application needs. Recent innovations include improved signal processing capabilities, enhanced user interfaces, and the integration of artificial intelligence for advanced diagnostics. Unique selling propositions often center around ease of use, advanced diagnostic features, and compatibility with various communication protocols.
Key Drivers, Barriers & Challenges in CAN BUS Analyzers
Key Drivers:
- Increasing demand for efficient vehicle diagnostics and maintenance.
- The rise of connected and autonomous vehicles.
- Growing adoption of CAN FD technology.
- Stringent regulatory compliance requirements.
Key Challenges and Restraints:
- High initial investment costs for advanced analyzers.
- Complexity of CAN bus systems requiring specialized expertise.
- Supply chain disruptions impacting component availability.
- Intense competition among established and emerging players. This competition is projected to reduce profit margins by xx% by 2033.
Emerging Opportunities in CAN BUS Analyzers
- Expansion into untapped markets such as agricultural machinery and smart grid applications.
- Development of cloud-based CAN bus analysis platforms for remote diagnostics.
- Integration of artificial intelligence and machine learning for predictive maintenance.
Growth Accelerators in the CAN BUS Analyzers Industry
The long-term growth of the CAN BUS Analyzer market will be driven by technological advancements such as the development of more powerful and user-friendly software, the integration of advanced diagnostic capabilities, and the proliferation of wireless connectivity options. Strategic partnerships between analyzer manufacturers and automotive OEMs will further accelerate market growth. The expansion into new application areas, particularly in industrial automation and renewable energy, also presents significant growth opportunities.
Key Players Shaping the CAN BUS Analyzers Market
- Microchip Technology
- Kvaser
- WAPICE
- X-Analyser
- Uchi Embedded Solutions
- TECHNOTON ENGINEERING
- TiePie Engineering
- Teledyne LeCroy
- Guangzhou ZHIYUAN Electronics
- MasterCAN Tool
- Spinalys
- Exclusive Origin
Notable Milestones in CAN BUS Analyzers Sector
- 2020-Q3: Microchip Technology launched a new generation of CAN FD transceivers.
- 2021-Q1: Kvaser released updated CAN bus analysis software with improved diagnostic capabilities.
- 2022-Q4: Teledyne LeCroy acquired a smaller CAN bus analyzer company, expanding its product portfolio.
- 2023-Q2: Introduction of AI-powered diagnostic features in several new CAN bus analyzers.
In-Depth CAN BUS Analyzers Market Outlook
The future of the CAN BUS Analyzers market looks promising, driven by continuous technological advancements, increasing demand from diverse sectors, and the growing importance of efficient vehicle and system diagnostics. Strategic partnerships and expansion into new application areas will further fuel market growth, creating significant opportunities for established and emerging players. The market is poised for continued expansion, with substantial potential for innovation and market penetration across various industries.
CAN BUS Analyzers Segmentation
-
1. Application
- 1.1. Automobile Industry
- 1.2. Medical Industry
- 1.3. Communication and Network
- 1.4. Manufacturing
- 1.5. Robot Technology
- 1.6. Other
-
2. Types
- 2.1. Single-Channel Analyzer
- 2.2. Multi-Channel Analyzer
CAN BUS Analyzers Segmentation By Geography
-
1. North America
- 1.1. United States
- 1.2. Canada
- 1.3. Mexico
-
2. South America
- 2.1. Brazil
- 2.2. Argentina
- 2.3. Rest of South America
-
3. Europe
- 3.1. United Kingdom
- 3.2. Germany
- 3.3. France
- 3.4. Italy
- 3.5. Spain
- 3.6. Russia
- 3.7. Benelux
- 3.8. Nordics
- 3.9. Rest of Europe
-
4. Middle East & Africa
- 4.1. Turkey
- 4.2. Israel
- 4.3. GCC
- 4.4. North Africa
- 4.5. South Africa
- 4.6. Rest of Middle East & Africa
-
5. Asia Pacific
- 5.1. China
- 5.2. India
- 5.3. Japan
- 5.4. South Korea
- 5.5. ASEAN
- 5.6. Oceania
- 5.7. Rest of Asia Pacific

CAN BUS Analyzers REPORT HIGHLIGHTS
| Aspects | Details |
|---|---|
| Study Period | 2019-2033 |
| Base Year | 2024 |
| Estimated Year | 2025 |
| Forecast Period | 2025-2033 |
| Historical Period | 2019-2024 |
| Growth Rate | CAGR of XX% from 2019-2033 |
| Segmentation |
|
Table of Contents
- 1. Introduction
- 1.1. Research Scope
- 1.2. Market Segmentation
- 1.3. Research Methodology
- 1.4. Definitions and Assumptions
- 2. Executive Summary
- 2.1. Introduction
- 3. Market Dynamics
- 3.1. Introduction
- 3.2. Market Drivers
- 3.3. Market Restrains
- 3.4. Market Trends
- 4. Market Factor Analysis
- 4.1. Porters Five Forces
- 4.2. Supply/Value Chain
- 4.3. PESTEL analysis
- 4.4. Market Entropy
- 4.5. Patent/Trademark Analysis
- 5. Global CAN BUS Analyzers Analysis, Insights and Forecast, 2019-2031
- 5.1. Market Analysis, Insights and Forecast - by Application
- 5.1.1. Automobile Industry
- 5.1.2. Medical Industry
- 5.1.3. Communication and Network
- 5.1.4. Manufacturing
- 5.1.5. Robot Technology
- 5.1.6. Other
- 5.2. Market Analysis, Insights and Forecast - by Types
- 5.2.1. Single-Channel Analyzer
- 5.2.2. Multi-Channel Analyzer
- 5.3. Market Analysis, Insights and Forecast - by Region
- 5.3.1. North America
- 5.3.2. South America
- 5.3.3. Europe
- 5.3.4. Middle East & Africa
- 5.3.5. Asia Pacific
- 5.1. Market Analysis, Insights and Forecast - by Application
- 6. North America CAN BUS Analyzers Analysis, Insights and Forecast, 2019-2031
- 6.1. Market Analysis, Insights and Forecast - by Application
- 6.1.1. Automobile Industry
- 6.1.2. Medical Industry
- 6.1.3. Communication and Network
- 6.1.4. Manufacturing
- 6.1.5. Robot Technology
- 6.1.6. Other
- 6.2. Market Analysis, Insights and Forecast - by Types
- 6.2.1. Single-Channel Analyzer
- 6.2.2. Multi-Channel Analyzer
- 6.1. Market Analysis, Insights and Forecast - by Application
- 7. South America CAN BUS Analyzers Analysis, Insights and Forecast, 2019-2031
- 7.1. Market Analysis, Insights and Forecast - by Application
- 7.1.1. Automobile Industry
- 7.1.2. Medical Industry
- 7.1.3. Communication and Network
- 7.1.4. Manufacturing
- 7.1.5. Robot Technology
- 7.1.6. Other
- 7.2. Market Analysis, Insights and Forecast - by Types
- 7.2.1. Single-Channel Analyzer
- 7.2.2. Multi-Channel Analyzer
- 7.1. Market Analysis, Insights and Forecast - by Application
- 8. Europe CAN BUS Analyzers Analysis, Insights and Forecast, 2019-2031
- 8.1. Market Analysis, Insights and Forecast - by Application
- 8.1.1. Automobile Industry
- 8.1.2. Medical Industry
- 8.1.3. Communication and Network
- 8.1.4. Manufacturing
- 8.1.5. Robot Technology
- 8.1.6. Other
- 8.2. Market Analysis, Insights and Forecast - by Types
- 8.2.1. Single-Channel Analyzer
- 8.2.2. Multi-Channel Analyzer
- 8.1. Market Analysis, Insights and Forecast - by Application
- 9. Middle East & Africa CAN BUS Analyzers Analysis, Insights and Forecast, 2019-2031
- 9.1. Market Analysis, Insights and Forecast - by Application
- 9.1.1. Automobile Industry
- 9.1.2. Medical Industry
- 9.1.3. Communication and Network
- 9.1.4. Manufacturing
- 9.1.5. Robot Technology
- 9.1.6. Other
- 9.2. Market Analysis, Insights and Forecast - by Types
- 9.2.1. Single-Channel Analyzer
- 9.2.2. Multi-Channel Analyzer
- 9.1. Market Analysis, Insights and Forecast - by Application
- 10. Asia Pacific CAN BUS Analyzers Analysis, Insights and Forecast, 2019-2031
- 10.1. Market Analysis, Insights and Forecast - by Application
- 10.1.1. Automobile Industry
- 10.1.2. Medical Industry
- 10.1.3. Communication and Network
- 10.1.4. Manufacturing
- 10.1.5. Robot Technology
- 10.1.6. Other
- 10.2. Market Analysis, Insights and Forecast - by Types
- 10.2.1. Single-Channel Analyzer
- 10.2.2. Multi-Channel Analyzer
- 10.1. Market Analysis, Insights and Forecast - by Application
- 11. Competitive Analysis
- 11.1. Global Market Share Analysis 2024
- 11.2. Company Profiles
- 11.2.1 Microchip Technology
- 11.2.1.1. Overview
- 11.2.1.2. Products
- 11.2.1.3. SWOT Analysis
- 11.2.1.4. Recent Developments
- 11.2.1.5. Financials (Based on Availability)
- 11.2.2 Kvaser
- 11.2.2.1. Overview
- 11.2.2.2. Products
- 11.2.2.3. SWOT Analysis
- 11.2.2.4. Recent Developments
- 11.2.2.5. Financials (Based on Availability)
- 11.2.3 WAPICE
- 11.2.3.1. Overview
- 11.2.3.2. Products
- 11.2.3.3. SWOT Analysis
- 11.2.3.4. Recent Developments
- 11.2.3.5. Financials (Based on Availability)
- 11.2.4 X-Analyser
- 11.2.4.1. Overview
- 11.2.4.2. Products
- 11.2.4.3. SWOT Analysis
- 11.2.4.4. Recent Developments
- 11.2.4.5. Financials (Based on Availability)
- 11.2.5 Uchi Embedded Solutions
- 11.2.5.1. Overview
- 11.2.5.2. Products
- 11.2.5.3. SWOT Analysis
- 11.2.5.4. Recent Developments
- 11.2.5.5. Financials (Based on Availability)
- 11.2.6 TECHNOTON ENGINEERING
- 11.2.6.1. Overview
- 11.2.6.2. Products
- 11.2.6.3. SWOT Analysis
- 11.2.6.4. Recent Developments
- 11.2.6.5. Financials (Based on Availability)
- 11.2.7 TiePie Engineering
- 11.2.7.1. Overview
- 11.2.7.2. Products
- 11.2.7.3. SWOT Analysis
- 11.2.7.4. Recent Developments
- 11.2.7.5. Financials (Based on Availability)
- 11.2.8 Teledyne LeCroy
- 11.2.8.1. Overview
- 11.2.8.2. Products
- 11.2.8.3. SWOT Analysis
- 11.2.8.4. Recent Developments
- 11.2.8.5. Financials (Based on Availability)
- 11.2.9 Guangzhou ZHIYUAN Electronics
- 11.2.9.1. Overview
- 11.2.9.2. Products
- 11.2.9.3. SWOT Analysis
- 11.2.9.4. Recent Developments
- 11.2.9.5. Financials (Based on Availability)
- 11.2.10 MasterCAN Tool
- 11.2.10.1. Overview
- 11.2.10.2. Products
- 11.2.10.3. SWOT Analysis
- 11.2.10.4. Recent Developments
- 11.2.10.5. Financials (Based on Availability)
- 11.2.11 Spinalys
- 11.2.11.1. Overview
- 11.2.11.2. Products
- 11.2.11.3. SWOT Analysis
- 11.2.11.4. Recent Developments
- 11.2.11.5. Financials (Based on Availability)
- 11.2.12 Exclusive Origin
- 11.2.12.1. Overview
- 11.2.12.2. Products
- 11.2.12.3. SWOT Analysis
- 11.2.12.4. Recent Developments
- 11.2.12.5. Financials (Based on Availability)
- 11.2.1 Microchip Technology
List of Figures
- Figure 1: Global CAN BUS Analyzers Revenue Breakdown (million, %) by Region 2024 & 2032
- Figure 2: North America CAN BUS Analyzers Revenue (million), by Application 2024 & 2032
- Figure 3: North America CAN BUS Analyzers Revenue Share (%), by Application 2024 & 2032
- Figure 4: North America CAN BUS Analyzers Revenue (million), by Types 2024 & 2032
- Figure 5: North America CAN BUS Analyzers Revenue Share (%), by Types 2024 & 2032
- Figure 6: North America CAN BUS Analyzers Revenue (million), by Country 2024 & 2032
- Figure 7: North America CAN BUS Analyzers Revenue Share (%), by Country 2024 & 2032
- Figure 8: South America CAN BUS Analyzers Revenue (million), by Application 2024 & 2032
- Figure 9: South America CAN BUS Analyzers Revenue Share (%), by Application 2024 & 2032
- Figure 10: South America CAN BUS Analyzers Revenue (million), by Types 2024 & 2032
- Figure 11: South America CAN BUS Analyzers Revenue Share (%), by Types 2024 & 2032
- Figure 12: South America CAN BUS Analyzers Revenue (million), by Country 2024 & 2032
- Figure 13: South America CAN BUS Analyzers Revenue Share (%), by Country 2024 & 2032
- Figure 14: Europe CAN BUS Analyzers Revenue (million), by Application 2024 & 2032
- Figure 15: Europe CAN BUS Analyzers Revenue Share (%), by Application 2024 & 2032
- Figure 16: Europe CAN BUS Analyzers Revenue (million), by Types 2024 & 2032
- Figure 17: Europe CAN BUS Analyzers Revenue Share (%), by Types 2024 & 2032
- Figure 18: Europe CAN BUS Analyzers Revenue (million), by Country 2024 & 2032
- Figure 19: Europe CAN BUS Analyzers Revenue Share (%), by Country 2024 & 2032
- Figure 20: Middle East & Africa CAN BUS Analyzers Revenue (million), by Application 2024 & 2032
- Figure 21: Middle East & Africa CAN BUS Analyzers Revenue Share (%), by Application 2024 & 2032
- Figure 22: Middle East & Africa CAN BUS Analyzers Revenue (million), by Types 2024 & 2032
- Figure 23: Middle East & Africa CAN BUS Analyzers Revenue Share (%), by Types 2024 & 2032
- Figure 24: Middle East & Africa CAN BUS Analyzers Revenue (million), by Country 2024 & 2032
- Figure 25: Middle East & Africa CAN BUS Analyzers Revenue Share (%), by Country 2024 & 2032
- Figure 26: Asia Pacific CAN BUS Analyzers Revenue (million), by Application 2024 & 2032
- Figure 27: Asia Pacific CAN BUS Analyzers Revenue Share (%), by Application 2024 & 2032
- Figure 28: Asia Pacific CAN BUS Analyzers Revenue (million), by Types 2024 & 2032
- Figure 29: Asia Pacific CAN BUS Analyzers Revenue Share (%), by Types 2024 & 2032
- Figure 30: Asia Pacific CAN BUS Analyzers Revenue (million), by Country 2024 & 2032
- Figure 31: Asia Pacific CAN BUS Analyzers Revenue Share (%), by Country 2024 & 2032
List of Tables
- Table 1: Global CAN BUS Analyzers Revenue million Forecast, by Region 2019 & 2032
- Table 2: Global CAN BUS Analyzers Revenue million Forecast, by Application 2019 & 2032
- Table 3: Global CAN BUS Analyzers Revenue million Forecast, by Types 2019 & 2032
- Table 4: Global CAN BUS Analyzers Revenue million Forecast, by Region 2019 & 2032
- Table 5: Global CAN BUS Analyzers Revenue million Forecast, by Application 2019 & 2032
- Table 6: Global CAN BUS Analyzers Revenue million Forecast, by Types 2019 & 2032
- Table 7: Global CAN BUS Analyzers Revenue million Forecast, by Country 2019 & 2032
- Table 8: United States CAN BUS Analyzers Revenue (million) Forecast, by Application 2019 & 2032
- Table 9: Canada CAN BUS Analyzers Revenue (million) Forecast, by Application 2019 & 2032
- Table 10: Mexico CAN BUS Analyzers Revenue (million) Forecast, by Application 2019 & 2032
- Table 11: Global CAN BUS Analyzers Revenue million Forecast, by Application 2019 & 2032
- Table 12: Global CAN BUS Analyzers Revenue million Forecast, by Types 2019 & 2032
- Table 13: Global CAN BUS Analyzers Revenue million Forecast, by Country 2019 & 2032
- Table 14: Brazil CAN BUS Analyzers Revenue (million) Forecast, by Application 2019 & 2032
- Table 15: Argentina CAN BUS Analyzers Revenue (million) Forecast, by Application 2019 & 2032
- Table 16: Rest of South America CAN BUS Analyzers Revenue (million) Forecast, by Application 2019 & 2032
- Table 17: Global CAN BUS Analyzers Revenue million Forecast, by Application 2019 & 2032
- Table 18: Global CAN BUS Analyzers Revenue million Forecast, by Types 2019 & 2032
- Table 19: Global CAN BUS Analyzers Revenue million Forecast, by Country 2019 & 2032
- Table 20: United Kingdom CAN BUS Analyzers Revenue (million) Forecast, by Application 2019 & 2032
- Table 21: Germany CAN BUS Analyzers Revenue (million) Forecast, by Application 2019 & 2032
- Table 22: France CAN BUS Analyzers Revenue (million) Forecast, by Application 2019 & 2032
- Table 23: Italy CAN BUS Analyzers Revenue (million) Forecast, by Application 2019 & 2032
- Table 24: Spain CAN BUS Analyzers Revenue (million) Forecast, by Application 2019 & 2032
- Table 25: Russia CAN BUS Analyzers Revenue (million) Forecast, by Application 2019 & 2032
- Table 26: Benelux CAN BUS Analyzers Revenue (million) Forecast, by Application 2019 & 2032
- Table 27: Nordics CAN BUS Analyzers Revenue (million) Forecast, by Application 2019 & 2032
- Table 28: Rest of Europe CAN BUS Analyzers Revenue (million) Forecast, by Application 2019 & 2032
- Table 29: Global CAN BUS Analyzers Revenue million Forecast, by Application 2019 & 2032
- Table 30: Global CAN BUS Analyzers Revenue million Forecast, by Types 2019 & 2032
- Table 31: Global CAN BUS Analyzers Revenue million Forecast, by Country 2019 & 2032
- Table 32: Turkey CAN BUS Analyzers Revenue (million) Forecast, by Application 2019 & 2032
- Table 33: Israel CAN BUS Analyzers Revenue (million) Forecast, by Application 2019 & 2032
- Table 34: GCC CAN BUS Analyzers Revenue (million) Forecast, by Application 2019 & 2032
- Table 35: North Africa CAN BUS Analyzers Revenue (million) Forecast, by Application 2019 & 2032
- Table 36: South Africa CAN BUS Analyzers Revenue (million) Forecast, by Application 2019 & 2032
- Table 37: Rest of Middle East & Africa CAN BUS Analyzers Revenue (million) Forecast, by Application 2019 & 2032
- Table 38: Global CAN BUS Analyzers Revenue million Forecast, by Application 2019 & 2032
- Table 39: Global CAN BUS Analyzers Revenue million Forecast, by Types 2019 & 2032
- Table 40: Global CAN BUS Analyzers Revenue million Forecast, by Country 2019 & 2032
- Table 41: China CAN BUS Analyzers Revenue (million) Forecast, by Application 2019 & 2032
- Table 42: India CAN BUS Analyzers Revenue (million) Forecast, by Application 2019 & 2032
- Table 43: Japan CAN BUS Analyzers Revenue (million) Forecast, by Application 2019 & 2032
- Table 44: South Korea CAN BUS Analyzers Revenue (million) Forecast, by Application 2019 & 2032
- Table 45: ASEAN CAN BUS Analyzers Revenue (million) Forecast, by Application 2019 & 2032
- Table 46: Oceania CAN BUS Analyzers Revenue (million) Forecast, by Application 2019 & 2032
- Table 47: Rest of Asia Pacific CAN BUS Analyzers Revenue (million) Forecast, by Application 2019 & 2032
Frequently Asked Questions
1. What is the projected Compound Annual Growth Rate (CAGR) of the CAN BUS Analyzers?
The projected CAGR is approximately XX%.
2. Which companies are prominent players in the CAN BUS Analyzers?
Key companies in the market include Microchip Technology, Kvaser, WAPICE, X-Analyser, Uchi Embedded Solutions, TECHNOTON ENGINEERING, TiePie Engineering, Teledyne LeCroy, Guangzhou ZHIYUAN Electronics, MasterCAN Tool, Spinalys, Exclusive Origin.
3. What are the main segments of the CAN BUS Analyzers?
The market segments include Application, Types.
4. Can you provide details about the market size?
The market size is estimated to be USD XXX million as of 2022.
5. What are some drivers contributing to market growth?
N/A
6. What are the notable trends driving market growth?
N/A
7. Are there any restraints impacting market growth?
N/A
8. Can you provide examples of recent developments in the market?
N/A
9. What pricing options are available for accessing the report?
Pricing options include single-user, multi-user, and enterprise licenses priced at USD 2900.00, USD 4350.00, and USD 5800.00 respectively.
10. Is the market size provided in terms of value or volume?
The market size is provided in terms of value, measured in million.
11. Are there any specific market keywords associated with the report?
Yes, the market keyword associated with the report is "CAN BUS Analyzers," which aids in identifying and referencing the specific market segment covered.
12. How do I determine which pricing option suits my needs best?
The pricing options vary based on user requirements and access needs. Individual users may opt for single-user licenses, while businesses requiring broader access may choose multi-user or enterprise licenses for cost-effective access to the report.
13. Are there any additional resources or data provided in the CAN BUS Analyzers report?
While the report offers comprehensive insights, it's advisable to review the specific contents or supplementary materials provided to ascertain if additional resources or data are available.
14. How can I stay updated on further developments or reports in the CAN BUS Analyzers?
To stay informed about further developments, trends, and reports in the CAN BUS Analyzers, consider subscribing to industry newsletters, following relevant companies and organizations, or regularly checking reputable industry news sources and publications.
Methodology
Step 1 - Identification of Relevant Samples Size from Population Database


Step 2 - Approaches for Defining Global Market Size (Value, Volume* & Price*)

Note*: In applicable scenarios
Step 3 - Data Sources
Primary Research
- Web Analytics
- Survey Reports
- Research Institute
- Latest Research Reports
- Opinion Leaders
Secondary Research
- Annual Reports
- White Paper
- Latest Press Release
- Industry Association
- Paid Database
- Investor Presentations

Step 4 - Data Triangulation
Involves using different sources of information in order to increase the validity of a study
These sources are likely to be stakeholders in a program - participants, other researchers, program staff, other community members, and so on.
Then we put all data in single framework & apply various statistical tools to find out the dynamic on the market.
During the analysis stage, feedback from the stakeholder groups would be compared to determine areas of agreement as well as areas of divergence
