

Key Insights
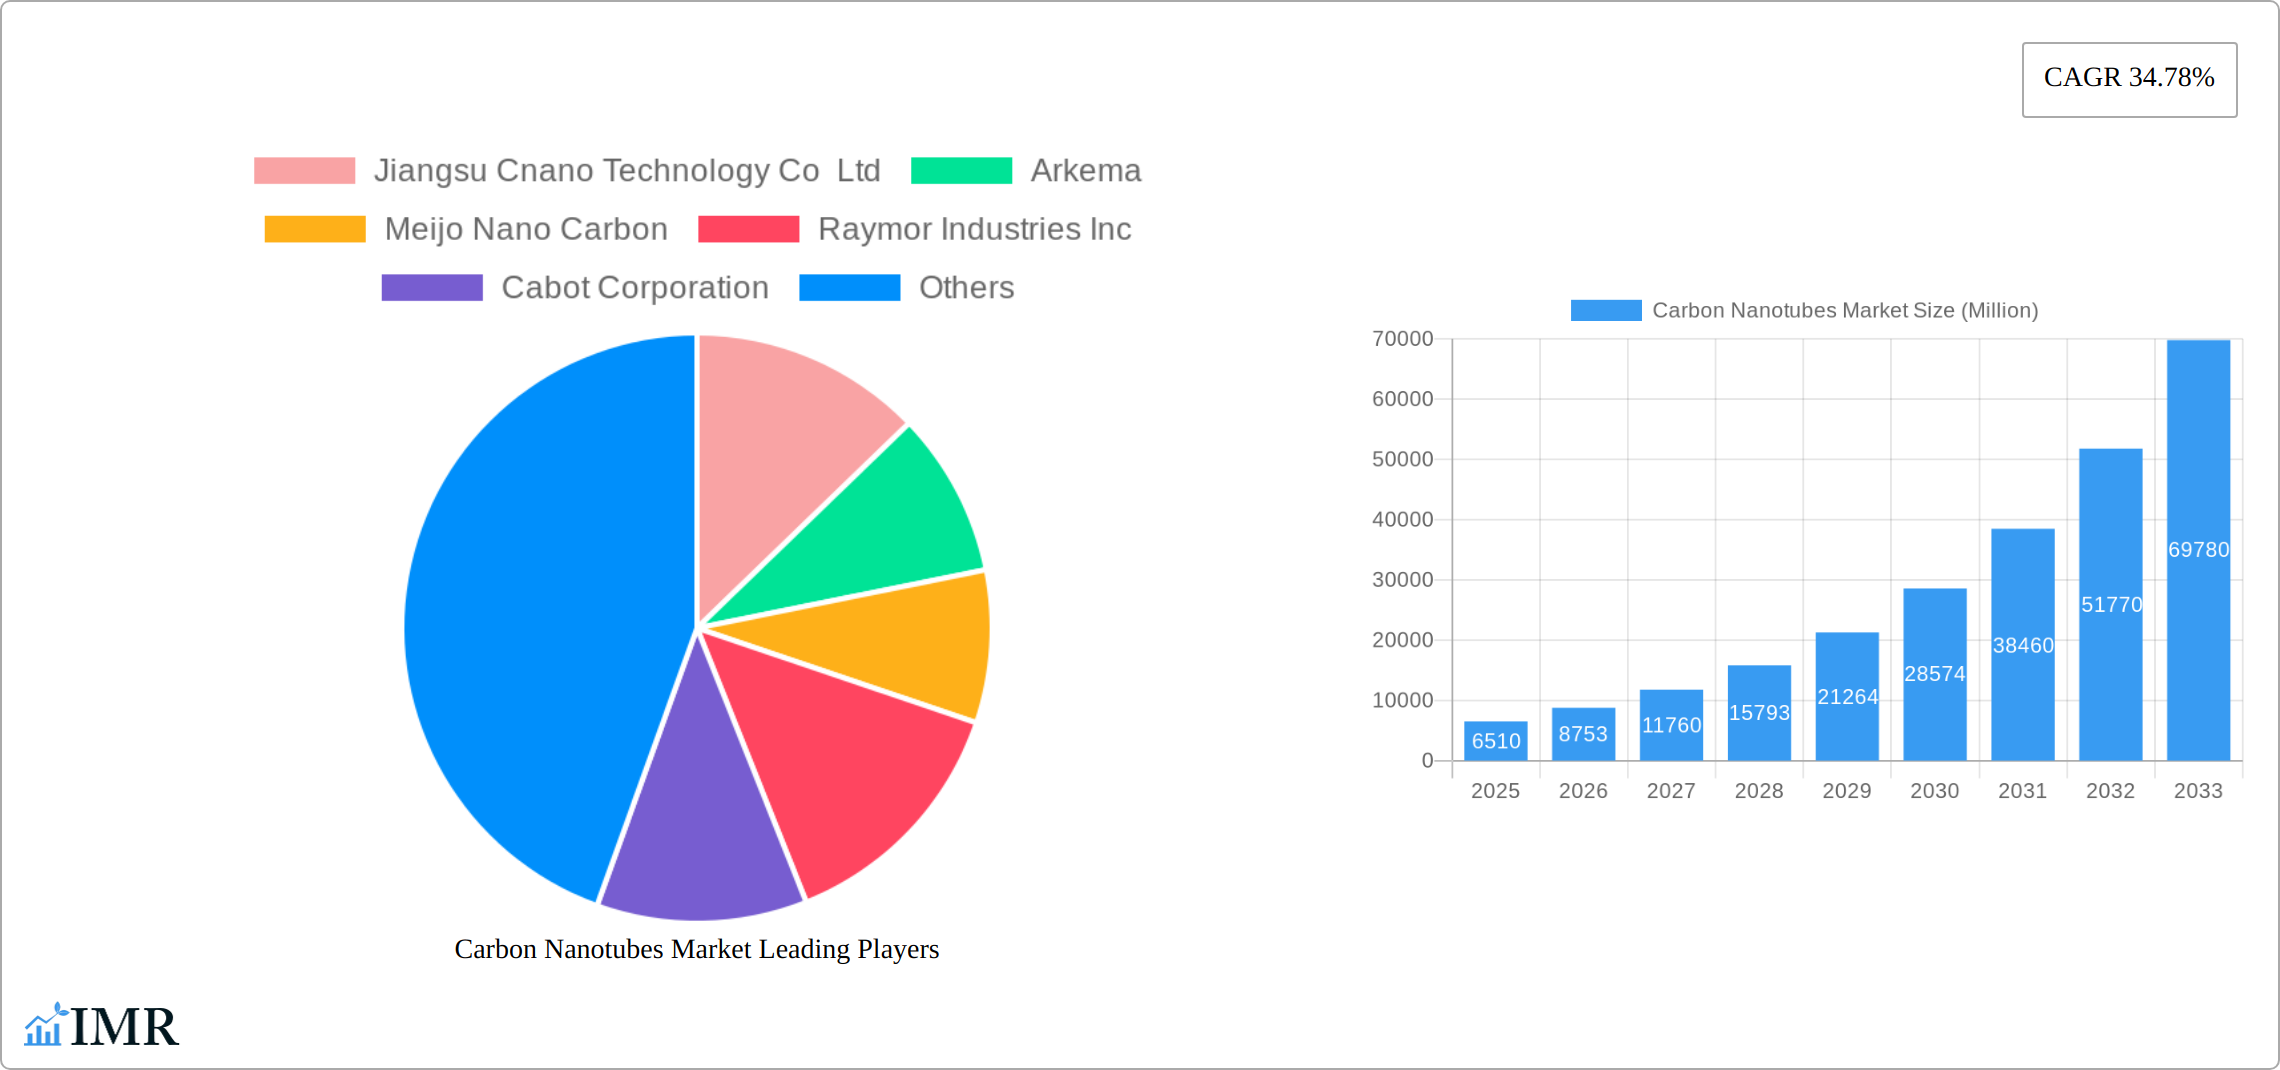
The global carbon nanotubes (CNTs) market is experiencing robust growth, projected to reach \$6.51 billion in 2025 and maintain a Compound Annual Growth Rate (CAGR) of 34.78% from 2025 to 2033. This expansion is driven by the increasing demand for lightweight yet high-strength materials across diverse sectors. The electronics industry, a major consumer of CNTs, utilizes them in advanced semiconductors, flexible displays, and energy storage solutions. The aerospace and defense sectors are leveraging CNTs for improved structural composites in aircraft and spacecraft. Similarly, the automotive industry is adopting CNTs for lighter and more fuel-efficient vehicles. The healthcare sector sees potential in CNTs for drug delivery systems and advanced medical imaging. The energy sector is exploring their use in high-performance batteries and solar cells. Technological advancements in CNT synthesis and processing are further fueling market expansion, enhancing their cost-effectiveness and broadening their applications.
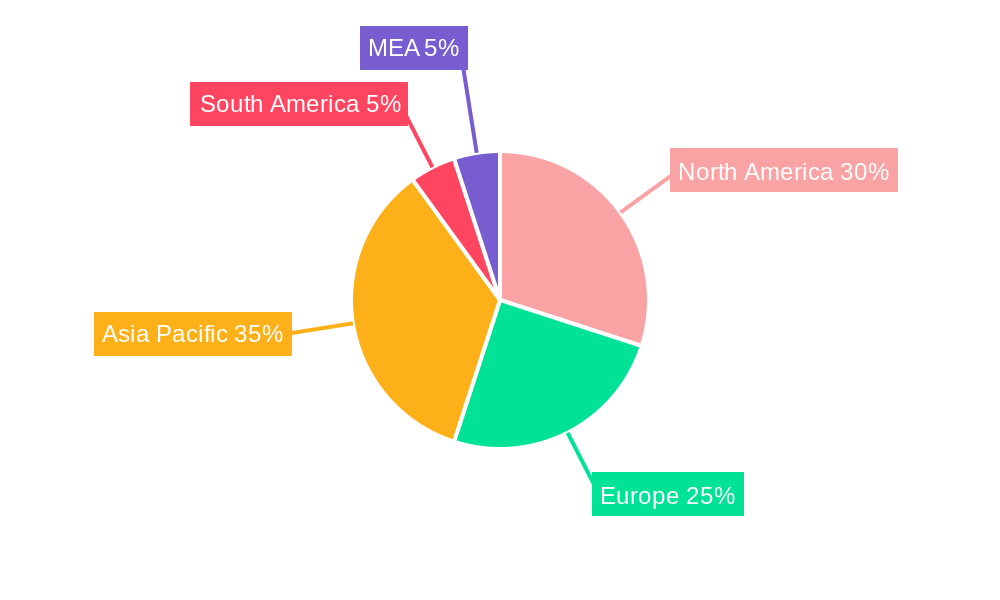
Despite the significant growth potential, the market faces certain restraints. High production costs, especially for high-purity CNTs, remain a challenge. Furthermore, concerns regarding the potential toxicity of CNTs require further investigation and the development of safer handling and disposal methods. However, ongoing research and development efforts are addressing these challenges. The market segmentation reveals that Multi-walled Carbon Nanotubes (MWCNTs) currently hold a larger market share compared to Single-walled Carbon Nanotubes (SWCNTs), though the latter segment is poised for faster growth due to its superior electrical properties. Geographic analysis indicates strong growth potential across Asia-Pacific, driven by increasing industrialization and technological advancements in countries like China and India. North America and Europe are also significant markets, contributing to the overall growth trajectory of the CNT market.
Carbon Nanotubes Market: A Comprehensive Report (2019-2033)
This in-depth report provides a comprehensive analysis of the Carbon Nanotubes market, encompassing market dynamics, growth trends, regional dominance, product landscape, key players, and future outlook. The study period spans from 2019 to 2033, with 2025 serving as the base and estimated year. The report is essential for industry professionals, investors, and researchers seeking a thorough understanding of this rapidly evolving market. The parent market is the advanced materials market, and the child market is the nanomaterials market.
Carbon Nanotubes Market Market Dynamics & Structure
This section delves into the intricate structure and dynamics of the carbon nanotubes market. We analyze market concentration, revealing the dominant players and their respective market shares. Technological innovation is explored, highlighting the ongoing advancements driving market growth, alongside a review of regulatory frameworks and their impact. The analysis also considers competitive product substitutes and their influence on market competition. End-user demographics are examined to identify key consumer segments and their purchasing patterns, complemented by an overview of M&A trends within the industry.
- Market Concentration: The market is moderately concentrated, with key players holding significant shares. The top five players account for approximately xx% of the market in 2025.
- Technological Innovation: Continuous advancements in synthesis methods and functionalization techniques are driving the development of high-performance carbon nanotubes with enhanced properties.
- Regulatory Frameworks: Government regulations concerning the safe handling and disposal of nanomaterials are influencing market dynamics, impacting production and application.
- Competitive Product Substitutes: Graphene and other nanomaterials pose a competitive threat, yet each material offers unique advantages leading to market niche specialization.
- End-User Demographics: The electronics industry remains the largest end-user segment, followed by the aerospace and automotive sectors. Demand is driven by the unique electrical, thermal, and mechanical properties of carbon nanotubes.
- M&A Trends: The past five years have witnessed xx M&A deals, primarily focused on expanding production capacity and securing access to new technologies.
Carbon Nanotubes Market Growth Trends & Insights
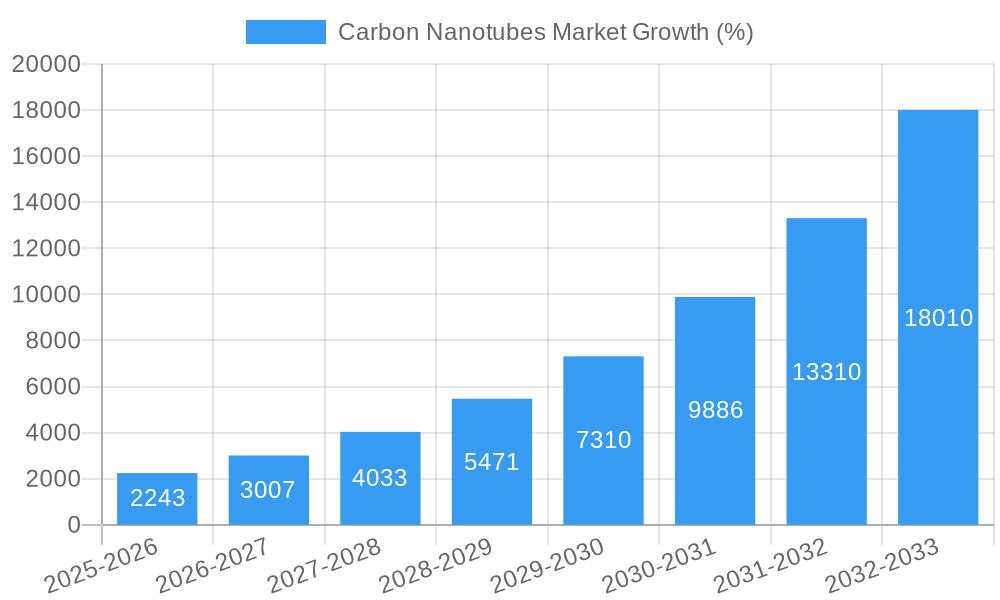
This section leverages extensive data analysis to illustrate the market's growth trajectory. We examine historical data (2019-2024), analyze the current market size (2025), and forecast future growth (2025-2033). The analysis incorporates detailed metrics, including the Compound Annual Growth Rate (CAGR), market penetration rates, and the adoption rates of carbon nanotubes across various applications. Technological disruptions and shifts in consumer behavior are also examined, providing a comprehensive insight into market evolution and future direction. The market is predicted to reach xx Million USD by 2033, exhibiting a CAGR of xx% during the forecast period. Key drivers include increasing demand from the electronics and energy sectors, as well as advancements in manufacturing techniques that reduce costs.
Dominant Regions, Countries, or Segments in Carbon Nanotubes Market
This section pinpoints the leading regions, countries, and segments within the carbon nanotubes market that are driving substantial growth. A detailed analysis of market share and growth potential for each segment – Multi-walled Carbon Nanotubes (MWCNT), Single-walled Carbon Nanotubes (SWCNT), and Other Types – within the “By Type” category, and Electronics, Aerospace and Defense, Automotive, Healthcare, Energy, and Other End-user Industries (Textiles, Plastics and Composites, and Construction) within the "By End-user Industry" category is conducted.
- By Type: MWCNTs currently dominate the market due to their lower cost and ease of production. However, SWCNTs are projected to experience significant growth due to their superior properties.
- By End-user Industry: The Electronics industry holds the largest market share, driven by the increasing demand for high-performance electronic components. The automotive industry presents a significant growth opportunity due to the rising adoption of lightweight and high-strength composites.
- Regional Dominance: Asia Pacific is the leading region, driven by robust economic growth and significant manufacturing capabilities within China and South Korea. North America and Europe also contribute substantially to the market. Key drivers include government initiatives promoting the adoption of advanced materials and investments in R&D.
Carbon Nanotubes Market Product Landscape
The carbon nanotubes market features a diverse range of products tailored to various applications. Innovations focus on enhancing properties like strength, conductivity, and dispersibility. Unique selling propositions include superior electrical conductivity in electronics, enhanced strength-to-weight ratio in composites, and improved thermal management in batteries. Continuous advancements in production techniques are leading to lower costs and increased scalability.
Key Drivers, Barriers & Challenges in Carbon Nanotubes Market
Key Drivers:
- Increasing demand from the electronics industry for high-performance components.
- Growing adoption of carbon nanotubes in energy storage applications.
- Government support and funding for research and development in nanotechnology.
- Advances in production techniques leading to lower costs and increased scalability.
Challenges and Restraints:
- High production costs for SWCNTs compared to MWCNTs.
- Concerns regarding the potential health and environmental impacts of carbon nanotubes.
- Limited standardization and quality control in the market.
- Competition from other advanced materials like graphene.
Emerging Opportunities in Carbon Nanotubes Market
Emerging opportunities lie in exploring untapped applications within diverse sectors. The development of novel functionalized carbon nanotubes could unlock new markets, while advancements in dispersion technologies will enhance their incorporation into existing applications. Growing consumer demand for sustainable and high-performance products will drive further innovation and market expansion.
Growth Accelerators in the Carbon Nanotubes Market Industry
Technological breakthroughs in scalable synthesis methods are pivotal for long-term growth. Strategic partnerships between material producers and end-users are accelerating market adoption. Expansion strategies focusing on emerging markets and diversification into new applications are further driving market growth.
Key Players Shaping the Carbon Nanotubes Market Market
- Jiangsu Cnano Technology Co Ltd
- Arkema
- Meijo Nano Carbon
- Raymor Industries Inc
- Cabot Corporation
- Nanocyl SA
- Showa Denko KK (Resonac Holdings Corporation)
- Ocsial
- Hyperion Catalysis International
- LG Chem
- Nano-C
- CHASM
- Chengdu Organic Chemicals Co Ltd (Timesnano)
- Kumho Petrochemical
Notable Milestones in Carbon Nanotubes Market Sector
- May 2023: LG Chem announced the construction of its fourth CNT plant in South Korea, doubling its annual production capacity to 6,100 tons by 2025. This significantly strengthens LG Chem's position and expands market supply.
- January 2023: Showa Denko KK and Showa Denko Materials Co. Ltd merged to form Resonac Holdings Corporation and Resonac Corporation, creating a larger entity with enhanced capabilities in materials science. This consolidation impacts market competition and innovation.
In-Depth Carbon Nanotubes Market Market Outlook
The carbon nanotubes market holds immense future potential, driven by continuous technological advancements, expanding applications, and increasing demand from diverse sectors. Strategic partnerships and investments in research and development are further reinforcing the industry's growth trajectory. The market is poised for sustained expansion, driven by the unique properties and versatile applications of carbon nanotubes.
Carbon Nanotubes Market Segmentation
-
1. Type
- 1.1. Multi-walled Carbon Nanotubes (MWCNT)
- 1.2. Single-walled Carbon Nanotubes (SWCNT)
- 1.3. Other Ty
-
2. End-user Industry
- 2.1. Electronics
- 2.2. Aerospace and Defense
- 2.3. Automotive
- 2.4. Healthcare
- 2.5. Energy
- 2.6. Other En
Carbon Nanotubes Market Segmentation By Geography
-
1. Asia Pacific
- 1.1. China
- 1.2. India
- 1.3. Japan
- 1.4. South Korea
- 1.5. Rest of Asia Pacific
-
2. North America
- 2.1. United States
- 2.2. Canada
- 2.3. Mexico
-
3. Europe
- 3.1. Germany
- 3.2. United Kingdom
- 3.3. Italy
- 3.4. France
- 3.5. Spain
- 3.6. Rest of Europe
-
4. South America
- 4.1. Brazil
- 4.2. Argentina
- 4.3. Rest of South America
-
5. Middle East and Africa
- 5.1. Saudi Arabia
- 5.2. South Africa
- 5.3. Rest of Middle East and Africa
Carbon Nanotubes Market REPORT HIGHLIGHTS
| Aspects | Details |
|---|---|
| Study Period | 2019-2033 |
| Base Year | 2024 |
| Estimated Year | 2025 |
| Forecast Period | 2025-2033 |
| Historical Period | 2019-2024 |
| Growth Rate | CAGR of 34.78% from 2019-2033 |
| Segmentation |
|
Table of Contents
- 1. Introduction
- 1.1. Research Scope
- 1.2. Market Segmentation
- 1.3. Research Methodology
- 1.4. Definitions and Assumptions
- 2. Executive Summary
- 2.1. Introduction
- 3. Market Dynamics
- 3.1. Introduction
- 3.2. Market Drivers
- 3.2.1. Growing Usage of Carbon Nantotubes in Electric Vehicles; Increasing Demand for Advance Materials in Numerous Applications
- 3.3. Market Restrains
- 3.3.1. Environmental Concerns and Health Safety Issues; Other Restraints
- 3.4. Market Trends
- 3.4.1. Energy Segment to Dominate the Market
- 4. Market Factor Analysis
- 4.1. Porters Five Forces
- 4.2. Supply/Value Chain
- 4.3. PESTEL analysis
- 4.4. Market Entropy
- 4.5. Patent/Trademark Analysis
- 5. Global Carbon Nanotubes Market Analysis, Insights and Forecast, 2019-2031
- 5.1. Market Analysis, Insights and Forecast - by Type
- 5.1.1. Multi-walled Carbon Nanotubes (MWCNT)
- 5.1.2. Single-walled Carbon Nanotubes (SWCNT)
- 5.1.3. Other Ty
- 5.2. Market Analysis, Insights and Forecast - by End-user Industry
- 5.2.1. Electronics
- 5.2.2. Aerospace and Defense
- 5.2.3. Automotive
- 5.2.4. Healthcare
- 5.2.5. Energy
- 5.2.6. Other En
- 5.3. Market Analysis, Insights and Forecast - by Region
- 5.3.1. Asia Pacific
- 5.3.2. North America
- 5.3.3. Europe
- 5.3.4. South America
- 5.3.5. Middle East and Africa
- 5.1. Market Analysis, Insights and Forecast - by Type
- 6. Asia Pacific Carbon Nanotubes Market Analysis, Insights and Forecast, 2019-2031
- 6.1. Market Analysis, Insights and Forecast - by Type
- 6.1.1. Multi-walled Carbon Nanotubes (MWCNT)
- 6.1.2. Single-walled Carbon Nanotubes (SWCNT)
- 6.1.3. Other Ty
- 6.2. Market Analysis, Insights and Forecast - by End-user Industry
- 6.2.1. Electronics
- 6.2.2. Aerospace and Defense
- 6.2.3. Automotive
- 6.2.4. Healthcare
- 6.2.5. Energy
- 6.2.6. Other En
- 6.1. Market Analysis, Insights and Forecast - by Type
- 7. North America Carbon Nanotubes Market Analysis, Insights and Forecast, 2019-2031
- 7.1. Market Analysis, Insights and Forecast - by Type
- 7.1.1. Multi-walled Carbon Nanotubes (MWCNT)
- 7.1.2. Single-walled Carbon Nanotubes (SWCNT)
- 7.1.3. Other Ty
- 7.2. Market Analysis, Insights and Forecast - by End-user Industry
- 7.2.1. Electronics
- 7.2.2. Aerospace and Defense
- 7.2.3. Automotive
- 7.2.4. Healthcare
- 7.2.5. Energy
- 7.2.6. Other En
- 7.1. Market Analysis, Insights and Forecast - by Type
- 8. Europe Carbon Nanotubes Market Analysis, Insights and Forecast, 2019-2031
- 8.1. Market Analysis, Insights and Forecast - by Type
- 8.1.1. Multi-walled Carbon Nanotubes (MWCNT)
- 8.1.2. Single-walled Carbon Nanotubes (SWCNT)
- 8.1.3. Other Ty
- 8.2. Market Analysis, Insights and Forecast - by End-user Industry
- 8.2.1. Electronics
- 8.2.2. Aerospace and Defense
- 8.2.3. Automotive
- 8.2.4. Healthcare
- 8.2.5. Energy
- 8.2.6. Other En
- 8.1. Market Analysis, Insights and Forecast - by Type
- 9. South America Carbon Nanotubes Market Analysis, Insights and Forecast, 2019-2031
- 9.1. Market Analysis, Insights and Forecast - by Type
- 9.1.1. Multi-walled Carbon Nanotubes (MWCNT)
- 9.1.2. Single-walled Carbon Nanotubes (SWCNT)
- 9.1.3. Other Ty
- 9.2. Market Analysis, Insights and Forecast - by End-user Industry
- 9.2.1. Electronics
- 9.2.2. Aerospace and Defense
- 9.2.3. Automotive
- 9.2.4. Healthcare
- 9.2.5. Energy
- 9.2.6. Other En
- 9.1. Market Analysis, Insights and Forecast - by Type
- 10. Middle East and Africa Carbon Nanotubes Market Analysis, Insights and Forecast, 2019-2031
- 10.1. Market Analysis, Insights and Forecast - by Type
- 10.1.1. Multi-walled Carbon Nanotubes (MWCNT)
- 10.1.2. Single-walled Carbon Nanotubes (SWCNT)
- 10.1.3. Other Ty
- 10.2. Market Analysis, Insights and Forecast - by End-user Industry
- 10.2.1. Electronics
- 10.2.2. Aerospace and Defense
- 10.2.3. Automotive
- 10.2.4. Healthcare
- 10.2.5. Energy
- 10.2.6. Other En
- 10.1. Market Analysis, Insights and Forecast - by Type
- 11. North America Carbon Nanotubes Market Analysis, Insights and Forecast, 2019-2031
- 11.1. Market Analysis, Insights and Forecast - By Country/Sub-region
- 11.1.1 United States
- 11.1.2 Canada
- 11.1.3 Mexico
- 12. Europe Carbon Nanotubes Market Analysis, Insights and Forecast, 2019-2031
- 12.1. Market Analysis, Insights and Forecast - By Country/Sub-region
- 12.1.1 Germany
- 12.1.2 France
- 12.1.3 Italy
- 12.1.4 United Kingdom
- 12.1.5 Netherlands
- 12.1.6 Rest of Europe
- 13. Asia Pacific Carbon Nanotubes Market Analysis, Insights and Forecast, 2019-2031
- 13.1. Market Analysis, Insights and Forecast - By Country/Sub-region
- 13.1.1 China
- 13.1.2 Japan
- 13.1.3 India
- 13.1.4 South Korea
- 13.1.5 Taiwan
- 13.1.6 Australia
- 13.1.7 Rest of Asia-Pacific
- 14. South America Carbon Nanotubes Market Analysis, Insights and Forecast, 2019-2031
- 14.1. Market Analysis, Insights and Forecast - By Country/Sub-region
- 14.1.1 Brazil
- 14.1.2 Argentina
- 14.1.3 Rest of South America
- 15. MEA Carbon Nanotubes Market Analysis, Insights and Forecast, 2019-2031
- 15.1. Market Analysis, Insights and Forecast - By Country/Sub-region
- 15.1.1 Middle East
- 15.1.2 Africa
- 16. Competitive Analysis
- 16.1. Global Market Share Analysis 2024
- 16.2. Company Profiles
- 16.2.1 Jiangsu Cnano Technology Co Ltd
- 16.2.1.1. Overview
- 16.2.1.2. Products
- 16.2.1.3. SWOT Analysis
- 16.2.1.4. Recent Developments
- 16.2.1.5. Financials (Based on Availability)
- 16.2.2 Arkema
- 16.2.2.1. Overview
- 16.2.2.2. Products
- 16.2.2.3. SWOT Analysis
- 16.2.2.4. Recent Developments
- 16.2.2.5. Financials (Based on Availability)
- 16.2.3 Meijo Nano Carbon
- 16.2.3.1. Overview
- 16.2.3.2. Products
- 16.2.3.3. SWOT Analysis
- 16.2.3.4. Recent Developments
- 16.2.3.5. Financials (Based on Availability)
- 16.2.4 Raymor Industries Inc
- 16.2.4.1. Overview
- 16.2.4.2. Products
- 16.2.4.3. SWOT Analysis
- 16.2.4.4. Recent Developments
- 16.2.4.5. Financials (Based on Availability)
- 16.2.5 Cabot Corporation
- 16.2.5.1. Overview
- 16.2.5.2. Products
- 16.2.5.3. SWOT Analysis
- 16.2.5.4. Recent Developments
- 16.2.5.5. Financials (Based on Availability)
- 16.2.6 Nanocyl SA
- 16.2.6.1. Overview
- 16.2.6.2. Products
- 16.2.6.3. SWOT Analysis
- 16.2.6.4. Recent Developments
- 16.2.6.5. Financials (Based on Availability)
- 16.2.7 Showa Denko KK (Resonac Holdings Corporation)
- 16.2.7.1. Overview
- 16.2.7.2. Products
- 16.2.7.3. SWOT Analysis
- 16.2.7.4. Recent Developments
- 16.2.7.5. Financials (Based on Availability)
- 16.2.8 Ocsial
- 16.2.8.1. Overview
- 16.2.8.2. Products
- 16.2.8.3. SWOT Analysis
- 16.2.8.4. Recent Developments
- 16.2.8.5. Financials (Based on Availability)
- 16.2.9 Hyperion Catalysis International
- 16.2.9.1. Overview
- 16.2.9.2. Products
- 16.2.9.3. SWOT Analysis
- 16.2.9.4. Recent Developments
- 16.2.9.5. Financials (Based on Availability)
- 16.2.10 LG Chem
- 16.2.10.1. Overview
- 16.2.10.2. Products
- 16.2.10.3. SWOT Analysis
- 16.2.10.4. Recent Developments
- 16.2.10.5. Financials (Based on Availability)
- 16.2.11 Nano-C
- 16.2.11.1. Overview
- 16.2.11.2. Products
- 16.2.11.3. SWOT Analysis
- 16.2.11.4. Recent Developments
- 16.2.11.5. Financials (Based on Availability)
- 16.2.12 CHASM
- 16.2.12.1. Overview
- 16.2.12.2. Products
- 16.2.12.3. SWOT Analysis
- 16.2.12.4. Recent Developments
- 16.2.12.5. Financials (Based on Availability)
- 16.2.13 Chengdu Organic Chemicals Co Ltd (Timesnano)
- 16.2.13.1. Overview
- 16.2.13.2. Products
- 16.2.13.3. SWOT Analysis
- 16.2.13.4. Recent Developments
- 16.2.13.5. Financials (Based on Availability)
- 16.2.14 Kumho Petrochemical
- 16.2.14.1. Overview
- 16.2.14.2. Products
- 16.2.14.3. SWOT Analysis
- 16.2.14.4. Recent Developments
- 16.2.14.5. Financials (Based on Availability)
- 16.2.1 Jiangsu Cnano Technology Co Ltd
List of Figures
- Figure 1: Global Carbon Nanotubes Market Revenue Breakdown (Million, %) by Region 2024 & 2032
- Figure 2: Global Carbon Nanotubes Market Volume Breakdown (K Tons, %) by Region 2024 & 2032
- Figure 3: North America Carbon Nanotubes Market Revenue (Million), by Country 2024 & 2032
- Figure 4: North America Carbon Nanotubes Market Volume (K Tons), by Country 2024 & 2032
- Figure 5: North America Carbon Nanotubes Market Revenue Share (%), by Country 2024 & 2032
- Figure 6: North America Carbon Nanotubes Market Volume Share (%), by Country 2024 & 2032
- Figure 7: Europe Carbon Nanotubes Market Revenue (Million), by Country 2024 & 2032
- Figure 8: Europe Carbon Nanotubes Market Volume (K Tons), by Country 2024 & 2032
- Figure 9: Europe Carbon Nanotubes Market Revenue Share (%), by Country 2024 & 2032
- Figure 10: Europe Carbon Nanotubes Market Volume Share (%), by Country 2024 & 2032
- Figure 11: Asia Pacific Carbon Nanotubes Market Revenue (Million), by Country 2024 & 2032
- Figure 12: Asia Pacific Carbon Nanotubes Market Volume (K Tons), by Country 2024 & 2032
- Figure 13: Asia Pacific Carbon Nanotubes Market Revenue Share (%), by Country 2024 & 2032
- Figure 14: Asia Pacific Carbon Nanotubes Market Volume Share (%), by Country 2024 & 2032
- Figure 15: South America Carbon Nanotubes Market Revenue (Million), by Country 2024 & 2032
- Figure 16: South America Carbon Nanotubes Market Volume (K Tons), by Country 2024 & 2032
- Figure 17: South America Carbon Nanotubes Market Revenue Share (%), by Country 2024 & 2032
- Figure 18: South America Carbon Nanotubes Market Volume Share (%), by Country 2024 & 2032
- Figure 19: MEA Carbon Nanotubes Market Revenue (Million), by Country 2024 & 2032
- Figure 20: MEA Carbon Nanotubes Market Volume (K Tons), by Country 2024 & 2032
- Figure 21: MEA Carbon Nanotubes Market Revenue Share (%), by Country 2024 & 2032
- Figure 22: MEA Carbon Nanotubes Market Volume Share (%), by Country 2024 & 2032
- Figure 23: Asia Pacific Carbon Nanotubes Market Revenue (Million), by Type 2024 & 2032
- Figure 24: Asia Pacific Carbon Nanotubes Market Volume (K Tons), by Type 2024 & 2032
- Figure 25: Asia Pacific Carbon Nanotubes Market Revenue Share (%), by Type 2024 & 2032
- Figure 26: Asia Pacific Carbon Nanotubes Market Volume Share (%), by Type 2024 & 2032
- Figure 27: Asia Pacific Carbon Nanotubes Market Revenue (Million), by End-user Industry 2024 & 2032
- Figure 28: Asia Pacific Carbon Nanotubes Market Volume (K Tons), by End-user Industry 2024 & 2032
- Figure 29: Asia Pacific Carbon Nanotubes Market Revenue Share (%), by End-user Industry 2024 & 2032
- Figure 30: Asia Pacific Carbon Nanotubes Market Volume Share (%), by End-user Industry 2024 & 2032
- Figure 31: Asia Pacific Carbon Nanotubes Market Revenue (Million), by Country 2024 & 2032
- Figure 32: Asia Pacific Carbon Nanotubes Market Volume (K Tons), by Country 2024 & 2032
- Figure 33: Asia Pacific Carbon Nanotubes Market Revenue Share (%), by Country 2024 & 2032
- Figure 34: Asia Pacific Carbon Nanotubes Market Volume Share (%), by Country 2024 & 2032
- Figure 35: North America Carbon Nanotubes Market Revenue (Million), by Type 2024 & 2032
- Figure 36: North America Carbon Nanotubes Market Volume (K Tons), by Type 2024 & 2032
- Figure 37: North America Carbon Nanotubes Market Revenue Share (%), by Type 2024 & 2032
- Figure 38: North America Carbon Nanotubes Market Volume Share (%), by Type 2024 & 2032
- Figure 39: North America Carbon Nanotubes Market Revenue (Million), by End-user Industry 2024 & 2032
- Figure 40: North America Carbon Nanotubes Market Volume (K Tons), by End-user Industry 2024 & 2032
- Figure 41: North America Carbon Nanotubes Market Revenue Share (%), by End-user Industry 2024 & 2032
- Figure 42: North America Carbon Nanotubes Market Volume Share (%), by End-user Industry 2024 & 2032
- Figure 43: North America Carbon Nanotubes Market Revenue (Million), by Country 2024 & 2032
- Figure 44: North America Carbon Nanotubes Market Volume (K Tons), by Country 2024 & 2032
- Figure 45: North America Carbon Nanotubes Market Revenue Share (%), by Country 2024 & 2032
- Figure 46: North America Carbon Nanotubes Market Volume Share (%), by Country 2024 & 2032
- Figure 47: Europe Carbon Nanotubes Market Revenue (Million), by Type 2024 & 2032
- Figure 48: Europe Carbon Nanotubes Market Volume (K Tons), by Type 2024 & 2032
- Figure 49: Europe Carbon Nanotubes Market Revenue Share (%), by Type 2024 & 2032
- Figure 50: Europe Carbon Nanotubes Market Volume Share (%), by Type 2024 & 2032
- Figure 51: Europe Carbon Nanotubes Market Revenue (Million), by End-user Industry 2024 & 2032
- Figure 52: Europe Carbon Nanotubes Market Volume (K Tons), by End-user Industry 2024 & 2032
- Figure 53: Europe Carbon Nanotubes Market Revenue Share (%), by End-user Industry 2024 & 2032
- Figure 54: Europe Carbon Nanotubes Market Volume Share (%), by End-user Industry 2024 & 2032
- Figure 55: Europe Carbon Nanotubes Market Revenue (Million), by Country 2024 & 2032
- Figure 56: Europe Carbon Nanotubes Market Volume (K Tons), by Country 2024 & 2032
- Figure 57: Europe Carbon Nanotubes Market Revenue Share (%), by Country 2024 & 2032
- Figure 58: Europe Carbon Nanotubes Market Volume Share (%), by Country 2024 & 2032
- Figure 59: South America Carbon Nanotubes Market Revenue (Million), by Type 2024 & 2032
- Figure 60: South America Carbon Nanotubes Market Volume (K Tons), by Type 2024 & 2032
- Figure 61: South America Carbon Nanotubes Market Revenue Share (%), by Type 2024 & 2032
- Figure 62: South America Carbon Nanotubes Market Volume Share (%), by Type 2024 & 2032
- Figure 63: South America Carbon Nanotubes Market Revenue (Million), by End-user Industry 2024 & 2032
- Figure 64: South America Carbon Nanotubes Market Volume (K Tons), by End-user Industry 2024 & 2032
- Figure 65: South America Carbon Nanotubes Market Revenue Share (%), by End-user Industry 2024 & 2032
- Figure 66: South America Carbon Nanotubes Market Volume Share (%), by End-user Industry 2024 & 2032
- Figure 67: South America Carbon Nanotubes Market Revenue (Million), by Country 2024 & 2032
- Figure 68: South America Carbon Nanotubes Market Volume (K Tons), by Country 2024 & 2032
- Figure 69: South America Carbon Nanotubes Market Revenue Share (%), by Country 2024 & 2032
- Figure 70: South America Carbon Nanotubes Market Volume Share (%), by Country 2024 & 2032
- Figure 71: Middle East and Africa Carbon Nanotubes Market Revenue (Million), by Type 2024 & 2032
- Figure 72: Middle East and Africa Carbon Nanotubes Market Volume (K Tons), by Type 2024 & 2032
- Figure 73: Middle East and Africa Carbon Nanotubes Market Revenue Share (%), by Type 2024 & 2032
- Figure 74: Middle East and Africa Carbon Nanotubes Market Volume Share (%), by Type 2024 & 2032
- Figure 75: Middle East and Africa Carbon Nanotubes Market Revenue (Million), by End-user Industry 2024 & 2032
- Figure 76: Middle East and Africa Carbon Nanotubes Market Volume (K Tons), by End-user Industry 2024 & 2032
- Figure 77: Middle East and Africa Carbon Nanotubes Market Revenue Share (%), by End-user Industry 2024 & 2032
- Figure 78: Middle East and Africa Carbon Nanotubes Market Volume Share (%), by End-user Industry 2024 & 2032
- Figure 79: Middle East and Africa Carbon Nanotubes Market Revenue (Million), by Country 2024 & 2032
- Figure 80: Middle East and Africa Carbon Nanotubes Market Volume (K Tons), by Country 2024 & 2032
- Figure 81: Middle East and Africa Carbon Nanotubes Market Revenue Share (%), by Country 2024 & 2032
- Figure 82: Middle East and Africa Carbon Nanotubes Market Volume Share (%), by Country 2024 & 2032
List of Tables
- Table 1: Global Carbon Nanotubes Market Revenue Million Forecast, by Region 2019 & 2032
- Table 2: Global Carbon Nanotubes Market Volume K Tons Forecast, by Region 2019 & 2032
- Table 3: Global Carbon Nanotubes Market Revenue Million Forecast, by Type 2019 & 2032
- Table 4: Global Carbon Nanotubes Market Volume K Tons Forecast, by Type 2019 & 2032
- Table 5: Global Carbon Nanotubes Market Revenue Million Forecast, by End-user Industry 2019 & 2032
- Table 6: Global Carbon Nanotubes Market Volume K Tons Forecast, by End-user Industry 2019 & 2032
- Table 7: Global Carbon Nanotubes Market Revenue Million Forecast, by Region 2019 & 2032
- Table 8: Global Carbon Nanotubes Market Volume K Tons Forecast, by Region 2019 & 2032
- Table 9: Global Carbon Nanotubes Market Revenue Million Forecast, by Country 2019 & 2032
- Table 10: Global Carbon Nanotubes Market Volume K Tons Forecast, by Country 2019 & 2032
- Table 11: United States Carbon Nanotubes Market Revenue (Million) Forecast, by Application 2019 & 2032
- Table 12: United States Carbon Nanotubes Market Volume (K Tons) Forecast, by Application 2019 & 2032
- Table 13: Canada Carbon Nanotubes Market Revenue (Million) Forecast, by Application 2019 & 2032
- Table 14: Canada Carbon Nanotubes Market Volume (K Tons) Forecast, by Application 2019 & 2032
- Table 15: Mexico Carbon Nanotubes Market Revenue (Million) Forecast, by Application 2019 & 2032
- Table 16: Mexico Carbon Nanotubes Market Volume (K Tons) Forecast, by Application 2019 & 2032
- Table 17: Global Carbon Nanotubes Market Revenue Million Forecast, by Country 2019 & 2032
- Table 18: Global Carbon Nanotubes Market Volume K Tons Forecast, by Country 2019 & 2032
- Table 19: Germany Carbon Nanotubes Market Revenue (Million) Forecast, by Application 2019 & 2032
- Table 20: Germany Carbon Nanotubes Market Volume (K Tons) Forecast, by Application 2019 & 2032
- Table 21: France Carbon Nanotubes Market Revenue (Million) Forecast, by Application 2019 & 2032
- Table 22: France Carbon Nanotubes Market Volume (K Tons) Forecast, by Application 2019 & 2032
- Table 23: Italy Carbon Nanotubes Market Revenue (Million) Forecast, by Application 2019 & 2032
- Table 24: Italy Carbon Nanotubes Market Volume (K Tons) Forecast, by Application 2019 & 2032
- Table 25: United Kingdom Carbon Nanotubes Market Revenue (Million) Forecast, by Application 2019 & 2032
- Table 26: United Kingdom Carbon Nanotubes Market Volume (K Tons) Forecast, by Application 2019 & 2032
- Table 27: Netherlands Carbon Nanotubes Market Revenue (Million) Forecast, by Application 2019 & 2032
- Table 28: Netherlands Carbon Nanotubes Market Volume (K Tons) Forecast, by Application 2019 & 2032
- Table 29: Rest of Europe Carbon Nanotubes Market Revenue (Million) Forecast, by Application 2019 & 2032
- Table 30: Rest of Europe Carbon Nanotubes Market Volume (K Tons) Forecast, by Application 2019 & 2032
- Table 31: Global Carbon Nanotubes Market Revenue Million Forecast, by Country 2019 & 2032
- Table 32: Global Carbon Nanotubes Market Volume K Tons Forecast, by Country 2019 & 2032
- Table 33: China Carbon Nanotubes Market Revenue (Million) Forecast, by Application 2019 & 2032
- Table 34: China Carbon Nanotubes Market Volume (K Tons) Forecast, by Application 2019 & 2032
- Table 35: Japan Carbon Nanotubes Market Revenue (Million) Forecast, by Application 2019 & 2032
- Table 36: Japan Carbon Nanotubes Market Volume (K Tons) Forecast, by Application 2019 & 2032
- Table 37: India Carbon Nanotubes Market Revenue (Million) Forecast, by Application 2019 & 2032
- Table 38: India Carbon Nanotubes Market Volume (K Tons) Forecast, by Application 2019 & 2032
- Table 39: South Korea Carbon Nanotubes Market Revenue (Million) Forecast, by Application 2019 & 2032
- Table 40: South Korea Carbon Nanotubes Market Volume (K Tons) Forecast, by Application 2019 & 2032
- Table 41: Taiwan Carbon Nanotubes Market Revenue (Million) Forecast, by Application 2019 & 2032
- Table 42: Taiwan Carbon Nanotubes Market Volume (K Tons) Forecast, by Application 2019 & 2032
- Table 43: Australia Carbon Nanotubes Market Revenue (Million) Forecast, by Application 2019 & 2032
- Table 44: Australia Carbon Nanotubes Market Volume (K Tons) Forecast, by Application 2019 & 2032
- Table 45: Rest of Asia-Pacific Carbon Nanotubes Market Revenue (Million) Forecast, by Application 2019 & 2032
- Table 46: Rest of Asia-Pacific Carbon Nanotubes Market Volume (K Tons) Forecast, by Application 2019 & 2032
- Table 47: Global Carbon Nanotubes Market Revenue Million Forecast, by Country 2019 & 2032
- Table 48: Global Carbon Nanotubes Market Volume K Tons Forecast, by Country 2019 & 2032
- Table 49: Brazil Carbon Nanotubes Market Revenue (Million) Forecast, by Application 2019 & 2032
- Table 50: Brazil Carbon Nanotubes Market Volume (K Tons) Forecast, by Application 2019 & 2032
- Table 51: Argentina Carbon Nanotubes Market Revenue (Million) Forecast, by Application 2019 & 2032
- Table 52: Argentina Carbon Nanotubes Market Volume (K Tons) Forecast, by Application 2019 & 2032
- Table 53: Rest of South America Carbon Nanotubes Market Revenue (Million) Forecast, by Application 2019 & 2032
- Table 54: Rest of South America Carbon Nanotubes Market Volume (K Tons) Forecast, by Application 2019 & 2032
- Table 55: Global Carbon Nanotubes Market Revenue Million Forecast, by Country 2019 & 2032
- Table 56: Global Carbon Nanotubes Market Volume K Tons Forecast, by Country 2019 & 2032
- Table 57: Middle East Carbon Nanotubes Market Revenue (Million) Forecast, by Application 2019 & 2032
- Table 58: Middle East Carbon Nanotubes Market Volume (K Tons) Forecast, by Application 2019 & 2032
- Table 59: Africa Carbon Nanotubes Market Revenue (Million) Forecast, by Application 2019 & 2032
- Table 60: Africa Carbon Nanotubes Market Volume (K Tons) Forecast, by Application 2019 & 2032
- Table 61: Global Carbon Nanotubes Market Revenue Million Forecast, by Type 2019 & 2032
- Table 62: Global Carbon Nanotubes Market Volume K Tons Forecast, by Type 2019 & 2032
- Table 63: Global Carbon Nanotubes Market Revenue Million Forecast, by End-user Industry 2019 & 2032
- Table 64: Global Carbon Nanotubes Market Volume K Tons Forecast, by End-user Industry 2019 & 2032
- Table 65: Global Carbon Nanotubes Market Revenue Million Forecast, by Country 2019 & 2032
- Table 66: Global Carbon Nanotubes Market Volume K Tons Forecast, by Country 2019 & 2032
- Table 67: China Carbon Nanotubes Market Revenue (Million) Forecast, by Application 2019 & 2032
- Table 68: China Carbon Nanotubes Market Volume (K Tons) Forecast, by Application 2019 & 2032
- Table 69: India Carbon Nanotubes Market Revenue (Million) Forecast, by Application 2019 & 2032
- Table 70: India Carbon Nanotubes Market Volume (K Tons) Forecast, by Application 2019 & 2032
- Table 71: Japan Carbon Nanotubes Market Revenue (Million) Forecast, by Application 2019 & 2032
- Table 72: Japan Carbon Nanotubes Market Volume (K Tons) Forecast, by Application 2019 & 2032
- Table 73: South Korea Carbon Nanotubes Market Revenue (Million) Forecast, by Application 2019 & 2032
- Table 74: South Korea Carbon Nanotubes Market Volume (K Tons) Forecast, by Application 2019 & 2032
- Table 75: Rest of Asia Pacific Carbon Nanotubes Market Revenue (Million) Forecast, by Application 2019 & 2032
- Table 76: Rest of Asia Pacific Carbon Nanotubes Market Volume (K Tons) Forecast, by Application 2019 & 2032
- Table 77: Global Carbon Nanotubes Market Revenue Million Forecast, by Type 2019 & 2032
- Table 78: Global Carbon Nanotubes Market Volume K Tons Forecast, by Type 2019 & 2032
- Table 79: Global Carbon Nanotubes Market Revenue Million Forecast, by End-user Industry 2019 & 2032
- Table 80: Global Carbon Nanotubes Market Volume K Tons Forecast, by End-user Industry 2019 & 2032
- Table 81: Global Carbon Nanotubes Market Revenue Million Forecast, by Country 2019 & 2032
- Table 82: Global Carbon Nanotubes Market Volume K Tons Forecast, by Country 2019 & 2032
- Table 83: United States Carbon Nanotubes Market Revenue (Million) Forecast, by Application 2019 & 2032
- Table 84: United States Carbon Nanotubes Market Volume (K Tons) Forecast, by Application 2019 & 2032
- Table 85: Canada Carbon Nanotubes Market Revenue (Million) Forecast, by Application 2019 & 2032
- Table 86: Canada Carbon Nanotubes Market Volume (K Tons) Forecast, by Application 2019 & 2032
- Table 87: Mexico Carbon Nanotubes Market Revenue (Million) Forecast, by Application 2019 & 2032
- Table 88: Mexico Carbon Nanotubes Market Volume (K Tons) Forecast, by Application 2019 & 2032
- Table 89: Global Carbon Nanotubes Market Revenue Million Forecast, by Type 2019 & 2032
- Table 90: Global Carbon Nanotubes Market Volume K Tons Forecast, by Type 2019 & 2032
- Table 91: Global Carbon Nanotubes Market Revenue Million Forecast, by End-user Industry 2019 & 2032
- Table 92: Global Carbon Nanotubes Market Volume K Tons Forecast, by End-user Industry 2019 & 2032
- Table 93: Global Carbon Nanotubes Market Revenue Million Forecast, by Country 2019 & 2032
- Table 94: Global Carbon Nanotubes Market Volume K Tons Forecast, by Country 2019 & 2032
- Table 95: Germany Carbon Nanotubes Market Revenue (Million) Forecast, by Application 2019 & 2032
- Table 96: Germany Carbon Nanotubes Market Volume (K Tons) Forecast, by Application 2019 & 2032
- Table 97: United Kingdom Carbon Nanotubes Market Revenue (Million) Forecast, by Application 2019 & 2032
- Table 98: United Kingdom Carbon Nanotubes Market Volume (K Tons) Forecast, by Application 2019 & 2032
- Table 99: Italy Carbon Nanotubes Market Revenue (Million) Forecast, by Application 2019 & 2032
- Table 100: Italy Carbon Nanotubes Market Volume (K Tons) Forecast, by Application 2019 & 2032
- Table 101: France Carbon Nanotubes Market Revenue (Million) Forecast, by Application 2019 & 2032
- Table 102: France Carbon Nanotubes Market Volume (K Tons) Forecast, by Application 2019 & 2032
- Table 103: Spain Carbon Nanotubes Market Revenue (Million) Forecast, by Application 2019 & 2032
- Table 104: Spain Carbon Nanotubes Market Volume (K Tons) Forecast, by Application 2019 & 2032
- Table 105: Rest of Europe Carbon Nanotubes Market Revenue (Million) Forecast, by Application 2019 & 2032
- Table 106: Rest of Europe Carbon Nanotubes Market Volume (K Tons) Forecast, by Application 2019 & 2032
- Table 107: Global Carbon Nanotubes Market Revenue Million Forecast, by Type 2019 & 2032
- Table 108: Global Carbon Nanotubes Market Volume K Tons Forecast, by Type 2019 & 2032
- Table 109: Global Carbon Nanotubes Market Revenue Million Forecast, by End-user Industry 2019 & 2032
- Table 110: Global Carbon Nanotubes Market Volume K Tons Forecast, by End-user Industry 2019 & 2032
- Table 111: Global Carbon Nanotubes Market Revenue Million Forecast, by Country 2019 & 2032
- Table 112: Global Carbon Nanotubes Market Volume K Tons Forecast, by Country 2019 & 2032
- Table 113: Brazil Carbon Nanotubes Market Revenue (Million) Forecast, by Application 2019 & 2032
- Table 114: Brazil Carbon Nanotubes Market Volume (K Tons) Forecast, by Application 2019 & 2032
- Table 115: Argentina Carbon Nanotubes Market Revenue (Million) Forecast, by Application 2019 & 2032
- Table 116: Argentina Carbon Nanotubes Market Volume (K Tons) Forecast, by Application 2019 & 2032
- Table 117: Rest of South America Carbon Nanotubes Market Revenue (Million) Forecast, by Application 2019 & 2032
- Table 118: Rest of South America Carbon Nanotubes Market Volume (K Tons) Forecast, by Application 2019 & 2032
- Table 119: Global Carbon Nanotubes Market Revenue Million Forecast, by Type 2019 & 2032
- Table 120: Global Carbon Nanotubes Market Volume K Tons Forecast, by Type 2019 & 2032
- Table 121: Global Carbon Nanotubes Market Revenue Million Forecast, by End-user Industry 2019 & 2032
- Table 122: Global Carbon Nanotubes Market Volume K Tons Forecast, by End-user Industry 2019 & 2032
- Table 123: Global Carbon Nanotubes Market Revenue Million Forecast, by Country 2019 & 2032
- Table 124: Global Carbon Nanotubes Market Volume K Tons Forecast, by Country 2019 & 2032
- Table 125: Saudi Arabia Carbon Nanotubes Market Revenue (Million) Forecast, by Application 2019 & 2032
- Table 126: Saudi Arabia Carbon Nanotubes Market Volume (K Tons) Forecast, by Application 2019 & 2032
- Table 127: South Africa Carbon Nanotubes Market Revenue (Million) Forecast, by Application 2019 & 2032
- Table 128: South Africa Carbon Nanotubes Market Volume (K Tons) Forecast, by Application 2019 & 2032
- Table 129: Rest of Middle East and Africa Carbon Nanotubes Market Revenue (Million) Forecast, by Application 2019 & 2032
- Table 130: Rest of Middle East and Africa Carbon Nanotubes Market Volume (K Tons) Forecast, by Application 2019 & 2032
Frequently Asked Questions
1. What is the projected Compound Annual Growth Rate (CAGR) of the Carbon Nanotubes Market?
The projected CAGR is approximately 34.78%.
2. Which companies are prominent players in the Carbon Nanotubes Market?
Key companies in the market include Jiangsu Cnano Technology Co Ltd, Arkema, Meijo Nano Carbon, Raymor Industries Inc, Cabot Corporation, Nanocyl SA, Showa Denko KK (Resonac Holdings Corporation), Ocsial, Hyperion Catalysis International, LG Chem, Nano-C, CHASM, Chengdu Organic Chemicals Co Ltd (Timesnano), Kumho Petrochemical.
3. What are the main segments of the Carbon Nanotubes Market?
The market segments include Type, End-user Industry.
4. Can you provide details about the market size?
The market size is estimated to be USD 6.51 Million as of 2022.
5. What are some drivers contributing to market growth?
Growing Usage of Carbon Nantotubes in Electric Vehicles; Increasing Demand for Advance Materials in Numerous Applications.
6. What are the notable trends driving market growth?
Energy Segment to Dominate the Market.
7. Are there any restraints impacting market growth?
Environmental Concerns and Health Safety Issues; Other Restraints.
8. Can you provide examples of recent developments in the market?
May 2023: LG CHEM announced the construction of its fourth carbon nanotube (CNT) plant at Daesan, South Korea. The plant is slated for operation in 2025. Through the expansion, the company contributes to doubling LG Chem’s annual CNT production capability to 6,100 tons, strengthening its product portfolio.
9. What pricing options are available for accessing the report?
Pricing options include single-user, multi-user, and enterprise licenses priced at USD 4750, USD 5250, and USD 8750 respectively.
10. Is the market size provided in terms of value or volume?
The market size is provided in terms of value, measured in Million and volume, measured in K Tons.
11. Are there any specific market keywords associated with the report?
Yes, the market keyword associated with the report is "Carbon Nanotubes Market," which aids in identifying and referencing the specific market segment covered.
12. How do I determine which pricing option suits my needs best?
The pricing options vary based on user requirements and access needs. Individual users may opt for single-user licenses, while businesses requiring broader access may choose multi-user or enterprise licenses for cost-effective access to the report.
13. Are there any additional resources or data provided in the Carbon Nanotubes Market report?
While the report offers comprehensive insights, it's advisable to review the specific contents or supplementary materials provided to ascertain if additional resources or data are available.
14. How can I stay updated on further developments or reports in the Carbon Nanotubes Market?
To stay informed about further developments, trends, and reports in the Carbon Nanotubes Market, consider subscribing to industry newsletters, following relevant companies and organizations, or regularly checking reputable industry news sources and publications.
Methodology
Step 1 - Identification of Relevant Samples Size from Population Database


Step 2 - Approaches for Defining Global Market Size (Value, Volume* & Price*)

Note*: In applicable scenarios
Step 3 - Data Sources
Primary Research
- Web Analytics
- Survey Reports
- Research Institute
- Latest Research Reports
- Opinion Leaders
Secondary Research
- Annual Reports
- White Paper
- Latest Press Release
- Industry Association
- Paid Database
- Investor Presentations

Step 4 - Data Triangulation
Involves using different sources of information in order to increase the validity of a study
These sources are likely to be stakeholders in a program - participants, other researchers, program staff, other community members, and so on.
Then we put all data in single framework & apply various statistical tools to find out the dynamic on the market.
During the analysis stage, feedback from the stakeholder groups would be compared to determine areas of agreement as well as areas of divergence
