

Key Insights
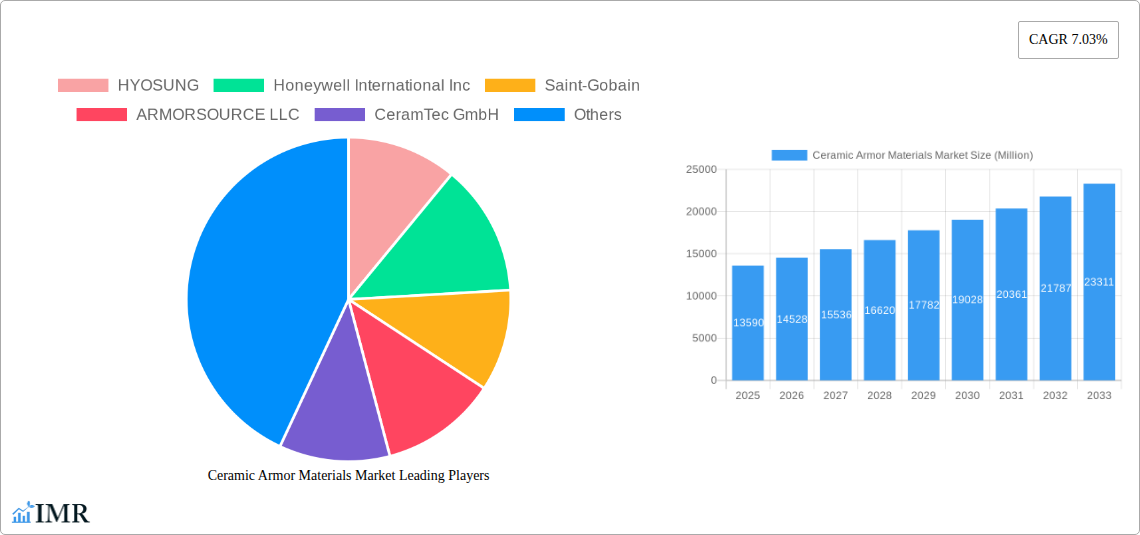
The global Ceramic Armor Materials market, valued at $13.59 billion in 2025, is projected to experience robust growth, exhibiting a Compound Annual Growth Rate (CAGR) of 7.03% from 2025 to 2033. This expansion is driven by several key factors. Firstly, increasing defense budgets globally, particularly in regions experiencing geopolitical instability, fuel demand for advanced armor solutions. Secondly, the continuous development of lighter, stronger, and more effective ceramic composites is improving the performance and reducing the weight of body armor and vehicle protection systems. This is leading to wider adoption across various applications, including military, law enforcement, and civilian sectors. Furthermore, technological advancements in material science are resulting in ceramic armor materials with enhanced ballistic resistance and impact absorption capabilities. This, combined with ongoing research into innovative manufacturing techniques, drives cost-efficiency and improved production scalability. The market's growth trajectory is also influenced by the rise in terrorist activities and cross-border conflicts, increasing the need for reliable personal and vehicle protection.
However, certain restraints hinder market growth. The high cost of advanced ceramic materials and their manufacturing processes limits widespread accessibility, especially in developing economies. Furthermore, the development and testing of new ceramic armor materials require extensive research and development efforts, potentially delaying market penetration. Despite these challenges, the market's segmentation across diverse product types (metal and alloy, ceramic and composite, etc.) and applications (aerospace, body armor, etc.) ensures diversified growth opportunities. The Asia-Pacific region, driven by robust demand from countries like China and India, is anticipated to hold a significant market share, followed by North America and Europe. The presence of established industry players like Honeywell International Inc., Saint-Gobain, and 3M, along with emerging regional manufacturers, further contributes to the market's competitive landscape and dynamic growth.
Ceramic Armor Materials Market: A Comprehensive Market Report (2019-2033)
This comprehensive report provides a detailed analysis of the Ceramic Armor Materials market, encompassing market dynamics, growth trends, regional dominance, product landscape, key players, and future outlook. The study period covers 2019-2033, with 2025 as the base year and forecast period spanning 2025-2033. The report offers valuable insights for industry professionals, investors, and stakeholders seeking to understand and capitalize on the growth opportunities within this dynamic market. The parent market is the broader Advanced Materials market, while the child market is specifically focused on protective materials within the defense and security sectors. The total market size is predicted to reach xx Million by 2033.
Ceramic Armor Materials Market Dynamics & Structure
The Ceramic Armor Materials market is characterized by moderate concentration, with several key players holding significant market share. Technological innovation, particularly in lightweight yet highly protective materials, is a key driver. Stringent regulatory frameworks governing the use of armor materials in various applications, particularly in defense and aerospace, influence market dynamics. Competitive product substitutes, such as advanced polymers and composites, pose a challenge. End-user demographics heavily influence demand, with military and law enforcement agencies being primary consumers. M&A activity within the industry has been moderate, with xx deals recorded between 2019 and 2024, contributing to market consolidation.
- Market Concentration: Moderately concentrated, with top 5 players holding approximately xx% market share in 2024.
- Technological Innovation: Focus on lightweight, high-strength materials, improved ballistic performance, and enhanced flexibility.
- Regulatory Landscape: Stringent safety and performance standards impacting product development and adoption.
- Competitive Substitutes: Advanced polymers, composites, and other protective materials present competitive pressure.
- End-User Demographics: Primarily driven by government and military procurements, alongside increasing demand from private security sectors.
- M&A Trends: Moderate M&A activity observed, leading to consolidation among market players.
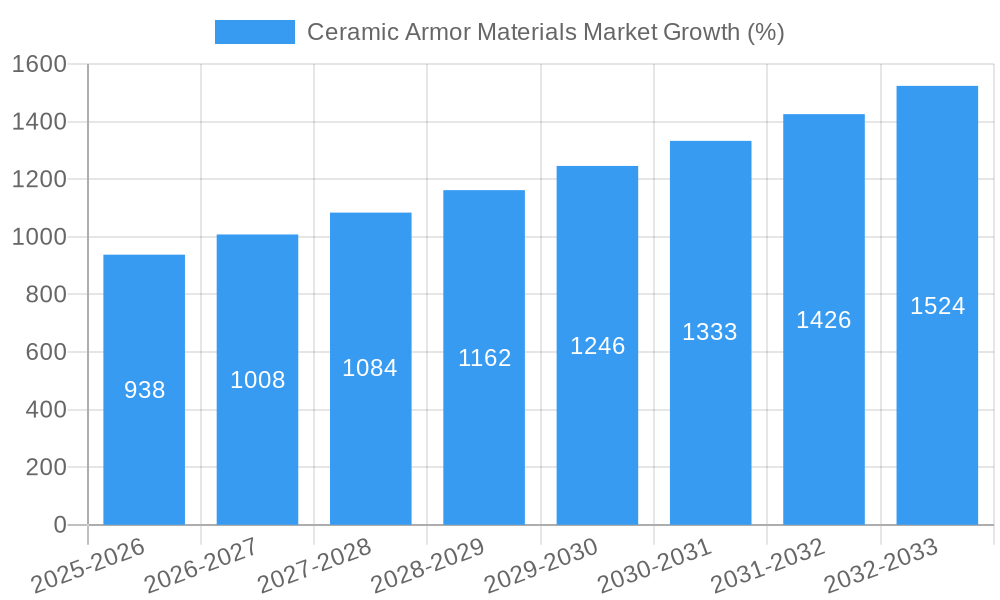
Ceramic Armor Materials Market Growth Trends & Insights
The Ceramic Armor Materials market witnessed steady growth during the historical period (2019-2024), with a CAGR of xx%. This growth is projected to accelerate during the forecast period (2025-2033), driven by increasing defense budgets, growing demand for personal protective equipment, and advancements in material science leading to improved performance and reduced weight. Market penetration is high in developed nations, with significant growth potential in emerging economies. Technological disruptions, such as the development of advanced ceramic composites and hybrid materials, are reshaping the market landscape. Shifting consumer preferences toward lighter, more flexible, and comfortable armor solutions are also driving innovation.
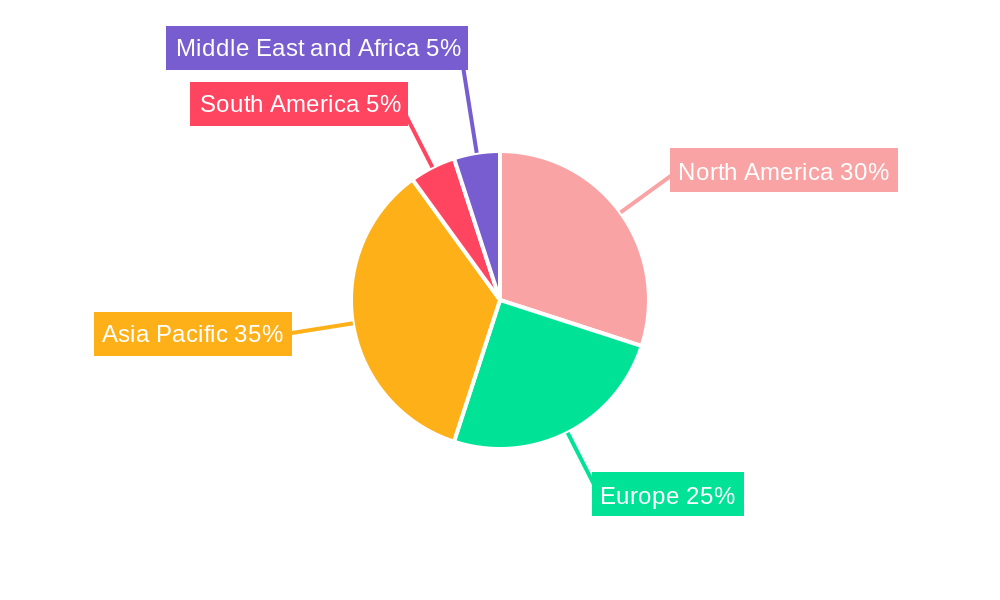
Dominant Regions, Countries, or Segments in Ceramic Armor Materials Market
The North American region holds a dominant position in the Ceramic Armor Materials market, capturing approximately xx% of the global market share in 2024. This dominance is driven by strong defense spending, advanced technological capabilities, and established manufacturing bases. Europe follows as a significant market, exhibiting substantial growth due to increasing demand from law enforcement and security agencies. The Asia-Pacific region exhibits strong growth potential, fueled by expanding military budgets and rising awareness of personal safety.
- Product Type: Ceramic and Composite materials dominate the market, holding xx% market share in 2024, followed by Para-aramid Fiber at xx%.
- Application: Body armor constitutes the largest segment, with a market share of xx% in 2024, driven by increasing demand from law enforcement and military personnel. Vehicle armor is another significant segment, with xx% of the market share.
- Key Drivers: Strong defense spending in North America and Europe, increasing government initiatives to improve personal safety and security, technological advancements improving material performance and reducing weight.
Ceramic Armor Materials Market Product Landscape
The Ceramic Armor Materials market offers a diverse range of products, including metal and alloy-based armor, ceramic and composite materials, para-aramid fibers, ultra-high-molecular-weight polyethylene, and other fiber-based solutions. Recent innovations focus on improving ballistic performance, reducing weight, and enhancing flexibility. Unique selling propositions emphasize higher protection levels at lower weight and improved comfort for the wearer. Advanced manufacturing techniques such as 3D printing are enabling the creation of customized armor solutions.
Key Drivers, Barriers & Challenges in Ceramic Armor Materials Market
Key Drivers:
- Rising global defense spending.
- Growing demand for personal protective equipment (PPE) across various sectors.
- Technological advancements resulting in lighter, stronger, and more flexible armor materials.
- Increasing urbanization and associated security concerns.
Challenges and Restraints:
- High production costs associated with advanced materials.
- Stringent regulatory compliance requirements.
- Potential supply chain disruptions impacting material availability.
- Intense competition among established and emerging players. This competition impacts pricing and profitability, with a estimated xx% decrease in average profit margin between 2019 and 2024.
Emerging Opportunities in Ceramic Armor Materials Market
Emerging opportunities lie in the development of advanced hybrid materials combining the strengths of different materials, expansion into untapped markets such as civilian security and personal protection products, and development of customizable armor solutions using additive manufacturing techniques. Furthermore, increased demand for lightweight and flexible body armor for specialized applications presents a significant growth opportunity.
Growth Accelerators in the Ceramic Armor Materials Market Industry
Strategic partnerships between material suppliers and armor manufacturers to streamline supply chains and develop innovative solutions are accelerating market growth. Technological breakthroughs in material science and manufacturing processes are lowering production costs and enhancing material performance. Expansion into new geographic markets, particularly in developing economies, presents significant growth potential.
Key Players Shaping the Ceramic Armor Materials Market Market
- HYOSUNG
- Honeywell International Inc
- Saint-Gobain
- ARMORSOURCE LLC
- CeramTec GmbH
- Teijin Aramid B V
- 3M
- Tata Steel
- PPG Industries Inc
- ATI
- CoorsTek Inc
- Morgan Advanced Materials
- Schunk Carbon Technology
- DSM
- DuPont
- JPS Composite Materials
- SAFEGUARDARMOR COM
- TenCate Protective Fabrics
- NP Aerospace
Notable Milestones in Ceramic Armor Materials Market Sector
- April 2023: DuPont launched Kevlar and EXO aramid fiber, offering enhanced lightweight, flexibility, and protection in body armor.
- April 2023: NP Aerospace expanded its business units to support growth in personal protection, platform armor, and commercial composites.
In-Depth Ceramic Armor Materials Market Market Outlook
The Ceramic Armor Materials market is poised for continued growth, driven by sustained demand, technological innovation, and strategic expansion. The focus on lightweight, high-performance materials will continue to shape product development. Strategic partnerships and investments in R&D will be crucial for players seeking to maintain a competitive edge and capitalize on the market's considerable potential. The market is expected to experience a CAGR of xx% between 2025 and 2033, reaching a projected value of xx Million by 2033.
Ceramic Armor Materials Market Segmentation
-
1. Product Type
- 1.1. Metal and Alloy
- 1.2. Ceramic and Composite
- 1.3. Para-aramid Fiber
- 1.4. Ultra-high-molecular-weight Polyethylene
- 1.5. Other Product Types (Including Fiber Glass, etc.)
-
2. Application
- 2.1. Aerospace
- 2.2. Body Armor
- 2.3. Civil Armor
- 2.4. Marine Armor
- 2.5. Vehicle Armor
Ceramic Armor Materials Market Segmentation By Geography
-
1. Asia Pacific
- 1.1. China
- 1.2. India
- 1.3. Japan
- 1.4. South Korea
- 1.5. Rest of Asia Pacific
-
2. North America
- 2.1. United States
- 2.2. Canada
- 2.3. Mexico
-
3. Europe
- 3.1. Germany
- 3.2. United Kingdom
- 3.3. France
- 3.4. Italy
- 3.5. Rest of Europe
-
4. South America
- 4.1. Brazil
- 4.2. Argentina
- 4.3. Rest of South America
-
5. Middle East and Africa
- 5.1. South Africa
- 5.2. Saudi Arabia
- 5.3. Rest of Middle East and Africa
Ceramic Armor Materials Market REPORT HIGHLIGHTS
| Aspects | Details |
|---|---|
| Study Period | 2019-2033 |
| Base Year | 2024 |
| Estimated Year | 2025 |
| Forecast Period | 2025-2033 |
| Historical Period | 2019-2024 |
| Growth Rate | CAGR of 7.03% from 2019-2033 |
| Segmentation |
|
Table of Contents
- 1. Introduction
- 1.1. Research Scope
- 1.2. Market Segmentation
- 1.3. Research Methodology
- 1.4. Definitions and Assumptions
- 2. Executive Summary
- 2.1. Introduction
- 3. Market Dynamics
- 3.1. Introduction
- 3.2. Market Drivers
- 3.2.1. Development of Body Armor and Advanced Weapons; Increasing Homeland Security Concerns; Other Drivers
- 3.3. Market Restrains
- 3.3.1. High Cost Of Production Of Defense Products; Others
- 3.4. Market Trends
- 3.4.1. Body Armors Application expected to lead the Market
- 4. Market Factor Analysis
- 4.1. Porters Five Forces
- 4.2. Supply/Value Chain
- 4.3. PESTEL analysis
- 4.4. Market Entropy
- 4.5. Patent/Trademark Analysis
- 5. Global Ceramic Armor Materials Market Analysis, Insights and Forecast, 2019-2031
- 5.1. Market Analysis, Insights and Forecast - by Product Type
- 5.1.1. Metal and Alloy
- 5.1.2. Ceramic and Composite
- 5.1.3. Para-aramid Fiber
- 5.1.4. Ultra-high-molecular-weight Polyethylene
- 5.1.5. Other Product Types (Including Fiber Glass, etc.)
- 5.2. Market Analysis, Insights and Forecast - by Application
- 5.2.1. Aerospace
- 5.2.2. Body Armor
- 5.2.3. Civil Armor
- 5.2.4. Marine Armor
- 5.2.5. Vehicle Armor
- 5.3. Market Analysis, Insights and Forecast - by Region
- 5.3.1. Asia Pacific
- 5.3.2. North America
- 5.3.3. Europe
- 5.3.4. South America
- 5.3.5. Middle East and Africa
- 5.1. Market Analysis, Insights and Forecast - by Product Type
- 6. Asia Pacific Ceramic Armor Materials Market Analysis, Insights and Forecast, 2019-2031
- 6.1. Market Analysis, Insights and Forecast - by Product Type
- 6.1.1. Metal and Alloy
- 6.1.2. Ceramic and Composite
- 6.1.3. Para-aramid Fiber
- 6.1.4. Ultra-high-molecular-weight Polyethylene
- 6.1.5. Other Product Types (Including Fiber Glass, etc.)
- 6.2. Market Analysis, Insights and Forecast - by Application
- 6.2.1. Aerospace
- 6.2.2. Body Armor
- 6.2.3. Civil Armor
- 6.2.4. Marine Armor
- 6.2.5. Vehicle Armor
- 6.1. Market Analysis, Insights and Forecast - by Product Type
- 7. North America Ceramic Armor Materials Market Analysis, Insights and Forecast, 2019-2031
- 7.1. Market Analysis, Insights and Forecast - by Product Type
- 7.1.1. Metal and Alloy
- 7.1.2. Ceramic and Composite
- 7.1.3. Para-aramid Fiber
- 7.1.4. Ultra-high-molecular-weight Polyethylene
- 7.1.5. Other Product Types (Including Fiber Glass, etc.)
- 7.2. Market Analysis, Insights and Forecast - by Application
- 7.2.1. Aerospace
- 7.2.2. Body Armor
- 7.2.3. Civil Armor
- 7.2.4. Marine Armor
- 7.2.5. Vehicle Armor
- 7.1. Market Analysis, Insights and Forecast - by Product Type
- 8. Europe Ceramic Armor Materials Market Analysis, Insights and Forecast, 2019-2031
- 8.1. Market Analysis, Insights and Forecast - by Product Type
- 8.1.1. Metal and Alloy
- 8.1.2. Ceramic and Composite
- 8.1.3. Para-aramid Fiber
- 8.1.4. Ultra-high-molecular-weight Polyethylene
- 8.1.5. Other Product Types (Including Fiber Glass, etc.)
- 8.2. Market Analysis, Insights and Forecast - by Application
- 8.2.1. Aerospace
- 8.2.2. Body Armor
- 8.2.3. Civil Armor
- 8.2.4. Marine Armor
- 8.2.5. Vehicle Armor
- 8.1. Market Analysis, Insights and Forecast - by Product Type
- 9. South America Ceramic Armor Materials Market Analysis, Insights and Forecast, 2019-2031
- 9.1. Market Analysis, Insights and Forecast - by Product Type
- 9.1.1. Metal and Alloy
- 9.1.2. Ceramic and Composite
- 9.1.3. Para-aramid Fiber
- 9.1.4. Ultra-high-molecular-weight Polyethylene
- 9.1.5. Other Product Types (Including Fiber Glass, etc.)
- 9.2. Market Analysis, Insights and Forecast - by Application
- 9.2.1. Aerospace
- 9.2.2. Body Armor
- 9.2.3. Civil Armor
- 9.2.4. Marine Armor
- 9.2.5. Vehicle Armor
- 9.1. Market Analysis, Insights and Forecast - by Product Type
- 10. Middle East and Africa Ceramic Armor Materials Market Analysis, Insights and Forecast, 2019-2031
- 10.1. Market Analysis, Insights and Forecast - by Product Type
- 10.1.1. Metal and Alloy
- 10.1.2. Ceramic and Composite
- 10.1.3. Para-aramid Fiber
- 10.1.4. Ultra-high-molecular-weight Polyethylene
- 10.1.5. Other Product Types (Including Fiber Glass, etc.)
- 10.2. Market Analysis, Insights and Forecast - by Application
- 10.2.1. Aerospace
- 10.2.2. Body Armor
- 10.2.3. Civil Armor
- 10.2.4. Marine Armor
- 10.2.5. Vehicle Armor
- 10.1. Market Analysis, Insights and Forecast - by Product Type
- 11. Asia Pacific Ceramic Armor Materials Market Analysis, Insights and Forecast, 2019-2031
- 11.1. Market Analysis, Insights and Forecast - By Country/Sub-region
- 11.1.1 China
- 11.1.2 India
- 11.1.3 Japan
- 11.1.4 South Korea
- 11.1.5 Rest of Asia Pacific
- 12. North America Ceramic Armor Materials Market Analysis, Insights and Forecast, 2019-2031
- 12.1. Market Analysis, Insights and Forecast - By Country/Sub-region
- 12.1.1 United States
- 12.1.2 Canada
- 12.1.3 Mexico
- 13. Europe Ceramic Armor Materials Market Analysis, Insights and Forecast, 2019-2031
- 13.1. Market Analysis, Insights and Forecast - By Country/Sub-region
- 13.1.1 Germany
- 13.1.2 United Kingdom
- 13.1.3 France
- 13.1.4 Italy
- 13.1.5 Rest of Europe
- 14. South America Ceramic Armor Materials Market Analysis, Insights and Forecast, 2019-2031
- 14.1. Market Analysis, Insights and Forecast - By Country/Sub-region
- 14.1.1 Brazil
- 14.1.2 Argentina
- 14.1.3 Rest of South America
- 15. Middle East and Africa Ceramic Armor Materials Market Analysis, Insights and Forecast, 2019-2031
- 15.1. Market Analysis, Insights and Forecast - By Country/Sub-region
- 15.1.1 South Africa
- 15.1.2 Saudi Arabia
- 15.1.3 Rest of Middle East and Africa
- 16. Competitive Analysis
- 16.1. Global Market Share Analysis 2024
- 16.2. Company Profiles
- 16.2.1 HYOSUNG
- 16.2.1.1. Overview
- 16.2.1.2. Products
- 16.2.1.3. SWOT Analysis
- 16.2.1.4. Recent Developments
- 16.2.1.5. Financials (Based on Availability)
- 16.2.2 Honeywell International Inc
- 16.2.2.1. Overview
- 16.2.2.2. Products
- 16.2.2.3. SWOT Analysis
- 16.2.2.4. Recent Developments
- 16.2.2.5. Financials (Based on Availability)
- 16.2.3 Saint-Gobain
- 16.2.3.1. Overview
- 16.2.3.2. Products
- 16.2.3.3. SWOT Analysis
- 16.2.3.4. Recent Developments
- 16.2.3.5. Financials (Based on Availability)
- 16.2.4 ARMORSOURCE LLC
- 16.2.4.1. Overview
- 16.2.4.2. Products
- 16.2.4.3. SWOT Analysis
- 16.2.4.4. Recent Developments
- 16.2.4.5. Financials (Based on Availability)
- 16.2.5 CeramTec GmbH
- 16.2.5.1. Overview
- 16.2.5.2. Products
- 16.2.5.3. SWOT Analysis
- 16.2.5.4. Recent Developments
- 16.2.5.5. Financials (Based on Availability)
- 16.2.6 Teijin Aramid B V *List Not Exhaustive
- 16.2.6.1. Overview
- 16.2.6.2. Products
- 16.2.6.3. SWOT Analysis
- 16.2.6.4. Recent Developments
- 16.2.6.5. Financials (Based on Availability)
- 16.2.7 3M
- 16.2.7.1. Overview
- 16.2.7.2. Products
- 16.2.7.3. SWOT Analysis
- 16.2.7.4. Recent Developments
- 16.2.7.5. Financials (Based on Availability)
- 16.2.8 Tata Steel
- 16.2.8.1. Overview
- 16.2.8.2. Products
- 16.2.8.3. SWOT Analysis
- 16.2.8.4. Recent Developments
- 16.2.8.5. Financials (Based on Availability)
- 16.2.9 PPG Industries Inc
- 16.2.9.1. Overview
- 16.2.9.2. Products
- 16.2.9.3. SWOT Analysis
- 16.2.9.4. Recent Developments
- 16.2.9.5. Financials (Based on Availability)
- 16.2.10 ATI
- 16.2.10.1. Overview
- 16.2.10.2. Products
- 16.2.10.3. SWOT Analysis
- 16.2.10.4. Recent Developments
- 16.2.10.5. Financials (Based on Availability)
- 16.2.11 CoorsTek Inc
- 16.2.11.1. Overview
- 16.2.11.2. Products
- 16.2.11.3. SWOT Analysis
- 16.2.11.4. Recent Developments
- 16.2.11.5. Financials (Based on Availability)
- 16.2.12 Morgan Advanced Materials
- 16.2.12.1. Overview
- 16.2.12.2. Products
- 16.2.12.3. SWOT Analysis
- 16.2.12.4. Recent Developments
- 16.2.12.5. Financials (Based on Availability)
- 16.2.13 Schunk Carbon Technology
- 16.2.13.1. Overview
- 16.2.13.2. Products
- 16.2.13.3. SWOT Analysis
- 16.2.13.4. Recent Developments
- 16.2.13.5. Financials (Based on Availability)
- 16.2.14 DSM
- 16.2.14.1. Overview
- 16.2.14.2. Products
- 16.2.14.3. SWOT Analysis
- 16.2.14.4. Recent Developments
- 16.2.14.5. Financials (Based on Availability)
- 16.2.15 DuPont
- 16.2.15.1. Overview
- 16.2.15.2. Products
- 16.2.15.3. SWOT Analysis
- 16.2.15.4. Recent Developments
- 16.2.15.5. Financials (Based on Availability)
- 16.2.16 JPS Composite Materials
- 16.2.16.1. Overview
- 16.2.16.2. Products
- 16.2.16.3. SWOT Analysis
- 16.2.16.4. Recent Developments
- 16.2.16.5. Financials (Based on Availability)
- 16.2.17 SAFEGUARDARMOR COM
- 16.2.17.1. Overview
- 16.2.17.2. Products
- 16.2.17.3. SWOT Analysis
- 16.2.17.4. Recent Developments
- 16.2.17.5. Financials (Based on Availability)
- 16.2.18 TenCate Protective Fabrics
- 16.2.18.1. Overview
- 16.2.18.2. Products
- 16.2.18.3. SWOT Analysis
- 16.2.18.4. Recent Developments
- 16.2.18.5. Financials (Based on Availability)
- 16.2.19 NP Aerospace
- 16.2.19.1. Overview
- 16.2.19.2. Products
- 16.2.19.3. SWOT Analysis
- 16.2.19.4. Recent Developments
- 16.2.19.5. Financials (Based on Availability)
- 16.2.1 HYOSUNG
List of Figures
- Figure 1: Global Ceramic Armor Materials Market Revenue Breakdown (Million, %) by Region 2024 & 2032
- Figure 2: Asia Pacific Ceramic Armor Materials Market Revenue (Million), by Country 2024 & 2032
- Figure 3: Asia Pacific Ceramic Armor Materials Market Revenue Share (%), by Country 2024 & 2032
- Figure 4: North America Ceramic Armor Materials Market Revenue (Million), by Country 2024 & 2032
- Figure 5: North America Ceramic Armor Materials Market Revenue Share (%), by Country 2024 & 2032
- Figure 6: Europe Ceramic Armor Materials Market Revenue (Million), by Country 2024 & 2032
- Figure 7: Europe Ceramic Armor Materials Market Revenue Share (%), by Country 2024 & 2032
- Figure 8: South America Ceramic Armor Materials Market Revenue (Million), by Country 2024 & 2032
- Figure 9: South America Ceramic Armor Materials Market Revenue Share (%), by Country 2024 & 2032
- Figure 10: Middle East and Africa Ceramic Armor Materials Market Revenue (Million), by Country 2024 & 2032
- Figure 11: Middle East and Africa Ceramic Armor Materials Market Revenue Share (%), by Country 2024 & 2032
- Figure 12: Asia Pacific Ceramic Armor Materials Market Revenue (Million), by Product Type 2024 & 2032
- Figure 13: Asia Pacific Ceramic Armor Materials Market Revenue Share (%), by Product Type 2024 & 2032
- Figure 14: Asia Pacific Ceramic Armor Materials Market Revenue (Million), by Application 2024 & 2032
- Figure 15: Asia Pacific Ceramic Armor Materials Market Revenue Share (%), by Application 2024 & 2032
- Figure 16: Asia Pacific Ceramic Armor Materials Market Revenue (Million), by Country 2024 & 2032
- Figure 17: Asia Pacific Ceramic Armor Materials Market Revenue Share (%), by Country 2024 & 2032
- Figure 18: North America Ceramic Armor Materials Market Revenue (Million), by Product Type 2024 & 2032
- Figure 19: North America Ceramic Armor Materials Market Revenue Share (%), by Product Type 2024 & 2032
- Figure 20: North America Ceramic Armor Materials Market Revenue (Million), by Application 2024 & 2032
- Figure 21: North America Ceramic Armor Materials Market Revenue Share (%), by Application 2024 & 2032
- Figure 22: North America Ceramic Armor Materials Market Revenue (Million), by Country 2024 & 2032
- Figure 23: North America Ceramic Armor Materials Market Revenue Share (%), by Country 2024 & 2032
- Figure 24: Europe Ceramic Armor Materials Market Revenue (Million), by Product Type 2024 & 2032
- Figure 25: Europe Ceramic Armor Materials Market Revenue Share (%), by Product Type 2024 & 2032
- Figure 26: Europe Ceramic Armor Materials Market Revenue (Million), by Application 2024 & 2032
- Figure 27: Europe Ceramic Armor Materials Market Revenue Share (%), by Application 2024 & 2032
- Figure 28: Europe Ceramic Armor Materials Market Revenue (Million), by Country 2024 & 2032
- Figure 29: Europe Ceramic Armor Materials Market Revenue Share (%), by Country 2024 & 2032
- Figure 30: South America Ceramic Armor Materials Market Revenue (Million), by Product Type 2024 & 2032
- Figure 31: South America Ceramic Armor Materials Market Revenue Share (%), by Product Type 2024 & 2032
- Figure 32: South America Ceramic Armor Materials Market Revenue (Million), by Application 2024 & 2032
- Figure 33: South America Ceramic Armor Materials Market Revenue Share (%), by Application 2024 & 2032
- Figure 34: South America Ceramic Armor Materials Market Revenue (Million), by Country 2024 & 2032
- Figure 35: South America Ceramic Armor Materials Market Revenue Share (%), by Country 2024 & 2032
- Figure 36: Middle East and Africa Ceramic Armor Materials Market Revenue (Million), by Product Type 2024 & 2032
- Figure 37: Middle East and Africa Ceramic Armor Materials Market Revenue Share (%), by Product Type 2024 & 2032
- Figure 38: Middle East and Africa Ceramic Armor Materials Market Revenue (Million), by Application 2024 & 2032
- Figure 39: Middle East and Africa Ceramic Armor Materials Market Revenue Share (%), by Application 2024 & 2032
- Figure 40: Middle East and Africa Ceramic Armor Materials Market Revenue (Million), by Country 2024 & 2032
- Figure 41: Middle East and Africa Ceramic Armor Materials Market Revenue Share (%), by Country 2024 & 2032
List of Tables
- Table 1: Global Ceramic Armor Materials Market Revenue Million Forecast, by Region 2019 & 2032
- Table 2: Global Ceramic Armor Materials Market Revenue Million Forecast, by Product Type 2019 & 2032
- Table 3: Global Ceramic Armor Materials Market Revenue Million Forecast, by Application 2019 & 2032
- Table 4: Global Ceramic Armor Materials Market Revenue Million Forecast, by Region 2019 & 2032
- Table 5: Global Ceramic Armor Materials Market Revenue Million Forecast, by Country 2019 & 2032
- Table 6: China Ceramic Armor Materials Market Revenue (Million) Forecast, by Application 2019 & 2032
- Table 7: India Ceramic Armor Materials Market Revenue (Million) Forecast, by Application 2019 & 2032
- Table 8: Japan Ceramic Armor Materials Market Revenue (Million) Forecast, by Application 2019 & 2032
- Table 9: South Korea Ceramic Armor Materials Market Revenue (Million) Forecast, by Application 2019 & 2032
- Table 10: Rest of Asia Pacific Ceramic Armor Materials Market Revenue (Million) Forecast, by Application 2019 & 2032
- Table 11: Global Ceramic Armor Materials Market Revenue Million Forecast, by Country 2019 & 2032
- Table 12: United States Ceramic Armor Materials Market Revenue (Million) Forecast, by Application 2019 & 2032
- Table 13: Canada Ceramic Armor Materials Market Revenue (Million) Forecast, by Application 2019 & 2032
- Table 14: Mexico Ceramic Armor Materials Market Revenue (Million) Forecast, by Application 2019 & 2032
- Table 15: Global Ceramic Armor Materials Market Revenue Million Forecast, by Country 2019 & 2032
- Table 16: Germany Ceramic Armor Materials Market Revenue (Million) Forecast, by Application 2019 & 2032
- Table 17: United Kingdom Ceramic Armor Materials Market Revenue (Million) Forecast, by Application 2019 & 2032
- Table 18: France Ceramic Armor Materials Market Revenue (Million) Forecast, by Application 2019 & 2032
- Table 19: Italy Ceramic Armor Materials Market Revenue (Million) Forecast, by Application 2019 & 2032
- Table 20: Rest of Europe Ceramic Armor Materials Market Revenue (Million) Forecast, by Application 2019 & 2032
- Table 21: Global Ceramic Armor Materials Market Revenue Million Forecast, by Country 2019 & 2032
- Table 22: Brazil Ceramic Armor Materials Market Revenue (Million) Forecast, by Application 2019 & 2032
- Table 23: Argentina Ceramic Armor Materials Market Revenue (Million) Forecast, by Application 2019 & 2032
- Table 24: Rest of South America Ceramic Armor Materials Market Revenue (Million) Forecast, by Application 2019 & 2032
- Table 25: Global Ceramic Armor Materials Market Revenue Million Forecast, by Country 2019 & 2032
- Table 26: South Africa Ceramic Armor Materials Market Revenue (Million) Forecast, by Application 2019 & 2032
- Table 27: Saudi Arabia Ceramic Armor Materials Market Revenue (Million) Forecast, by Application 2019 & 2032
- Table 28: Rest of Middle East and Africa Ceramic Armor Materials Market Revenue (Million) Forecast, by Application 2019 & 2032
- Table 29: Global Ceramic Armor Materials Market Revenue Million Forecast, by Product Type 2019 & 2032
- Table 30: Global Ceramic Armor Materials Market Revenue Million Forecast, by Application 2019 & 2032
- Table 31: Global Ceramic Armor Materials Market Revenue Million Forecast, by Country 2019 & 2032
- Table 32: China Ceramic Armor Materials Market Revenue (Million) Forecast, by Application 2019 & 2032
- Table 33: India Ceramic Armor Materials Market Revenue (Million) Forecast, by Application 2019 & 2032
- Table 34: Japan Ceramic Armor Materials Market Revenue (Million) Forecast, by Application 2019 & 2032
- Table 35: South Korea Ceramic Armor Materials Market Revenue (Million) Forecast, by Application 2019 & 2032
- Table 36: Rest of Asia Pacific Ceramic Armor Materials Market Revenue (Million) Forecast, by Application 2019 & 2032
- Table 37: Global Ceramic Armor Materials Market Revenue Million Forecast, by Product Type 2019 & 2032
- Table 38: Global Ceramic Armor Materials Market Revenue Million Forecast, by Application 2019 & 2032
- Table 39: Global Ceramic Armor Materials Market Revenue Million Forecast, by Country 2019 & 2032
- Table 40: United States Ceramic Armor Materials Market Revenue (Million) Forecast, by Application 2019 & 2032
- Table 41: Canada Ceramic Armor Materials Market Revenue (Million) Forecast, by Application 2019 & 2032
- Table 42: Mexico Ceramic Armor Materials Market Revenue (Million) Forecast, by Application 2019 & 2032
- Table 43: Global Ceramic Armor Materials Market Revenue Million Forecast, by Product Type 2019 & 2032
- Table 44: Global Ceramic Armor Materials Market Revenue Million Forecast, by Application 2019 & 2032
- Table 45: Global Ceramic Armor Materials Market Revenue Million Forecast, by Country 2019 & 2032
- Table 46: Germany Ceramic Armor Materials Market Revenue (Million) Forecast, by Application 2019 & 2032
- Table 47: United Kingdom Ceramic Armor Materials Market Revenue (Million) Forecast, by Application 2019 & 2032
- Table 48: France Ceramic Armor Materials Market Revenue (Million) Forecast, by Application 2019 & 2032
- Table 49: Italy Ceramic Armor Materials Market Revenue (Million) Forecast, by Application 2019 & 2032
- Table 50: Rest of Europe Ceramic Armor Materials Market Revenue (Million) Forecast, by Application 2019 & 2032
- Table 51: Global Ceramic Armor Materials Market Revenue Million Forecast, by Product Type 2019 & 2032
- Table 52: Global Ceramic Armor Materials Market Revenue Million Forecast, by Application 2019 & 2032
- Table 53: Global Ceramic Armor Materials Market Revenue Million Forecast, by Country 2019 & 2032
- Table 54: Brazil Ceramic Armor Materials Market Revenue (Million) Forecast, by Application 2019 & 2032
- Table 55: Argentina Ceramic Armor Materials Market Revenue (Million) Forecast, by Application 2019 & 2032
- Table 56: Rest of South America Ceramic Armor Materials Market Revenue (Million) Forecast, by Application 2019 & 2032
- Table 57: Global Ceramic Armor Materials Market Revenue Million Forecast, by Product Type 2019 & 2032
- Table 58: Global Ceramic Armor Materials Market Revenue Million Forecast, by Application 2019 & 2032
- Table 59: Global Ceramic Armor Materials Market Revenue Million Forecast, by Country 2019 & 2032
- Table 60: South Africa Ceramic Armor Materials Market Revenue (Million) Forecast, by Application 2019 & 2032
- Table 61: Saudi Arabia Ceramic Armor Materials Market Revenue (Million) Forecast, by Application 2019 & 2032
- Table 62: Rest of Middle East and Africa Ceramic Armor Materials Market Revenue (Million) Forecast, by Application 2019 & 2032
Frequently Asked Questions
1. What is the projected Compound Annual Growth Rate (CAGR) of the Ceramic Armor Materials Market?
The projected CAGR is approximately 7.03%.
2. Which companies are prominent players in the Ceramic Armor Materials Market?
Key companies in the market include HYOSUNG, Honeywell International Inc, Saint-Gobain, ARMORSOURCE LLC, CeramTec GmbH, Teijin Aramid B V *List Not Exhaustive, 3M, Tata Steel, PPG Industries Inc, ATI, CoorsTek Inc, Morgan Advanced Materials, Schunk Carbon Technology, DSM, DuPont, JPS Composite Materials, SAFEGUARDARMOR COM, TenCate Protective Fabrics, NP Aerospace.
3. What are the main segments of the Ceramic Armor Materials Market?
The market segments include Product Type, Application.
4. Can you provide details about the market size?
The market size is estimated to be USD 13.59 Million as of 2022.
5. What are some drivers contributing to market growth?
Development of Body Armor and Advanced Weapons; Increasing Homeland Security Concerns; Other Drivers.
6. What are the notable trends driving market growth?
Body Armors Application expected to lead the Market.
7. Are there any restraints impacting market growth?
High Cost Of Production Of Defense Products; Others.
8. Can you provide examples of recent developments in the market?
In April 2023, DuPont launched its innovative products Kevlar, and EXO aramid fibre, which is developed to serve endless applications in body armour where performance and protection is required in the midst of intense and demanding conditions. These products offer an unprecedented combination of lightness, flexibility and protection.
9. What pricing options are available for accessing the report?
Pricing options include single-user, multi-user, and enterprise licenses priced at USD 4750, USD 5250, and USD 8750 respectively.
10. Is the market size provided in terms of value or volume?
The market size is provided in terms of value, measured in Million.
11. Are there any specific market keywords associated with the report?
Yes, the market keyword associated with the report is "Ceramic Armor Materials Market," which aids in identifying and referencing the specific market segment covered.
12. How do I determine which pricing option suits my needs best?
The pricing options vary based on user requirements and access needs. Individual users may opt for single-user licenses, while businesses requiring broader access may choose multi-user or enterprise licenses for cost-effective access to the report.
13. Are there any additional resources or data provided in the Ceramic Armor Materials Market report?
While the report offers comprehensive insights, it's advisable to review the specific contents or supplementary materials provided to ascertain if additional resources or data are available.
14. How can I stay updated on further developments or reports in the Ceramic Armor Materials Market?
To stay informed about further developments, trends, and reports in the Ceramic Armor Materials Market, consider subscribing to industry newsletters, following relevant companies and organizations, or regularly checking reputable industry news sources and publications.
Methodology
Step 1 - Identification of Relevant Samples Size from Population Database


Step 2 - Approaches for Defining Global Market Size (Value, Volume* & Price*)

Note*: In applicable scenarios
Step 3 - Data Sources
Primary Research
- Web Analytics
- Survey Reports
- Research Institute
- Latest Research Reports
- Opinion Leaders
Secondary Research
- Annual Reports
- White Paper
- Latest Press Release
- Industry Association
- Paid Database
- Investor Presentations

Step 4 - Data Triangulation
Involves using different sources of information in order to increase the validity of a study
These sources are likely to be stakeholders in a program - participants, other researchers, program staff, other community members, and so on.
Then we put all data in single framework & apply various statistical tools to find out the dynamic on the market.
During the analysis stage, feedback from the stakeholder groups would be compared to determine areas of agreement as well as areas of divergence
