

Key Insights
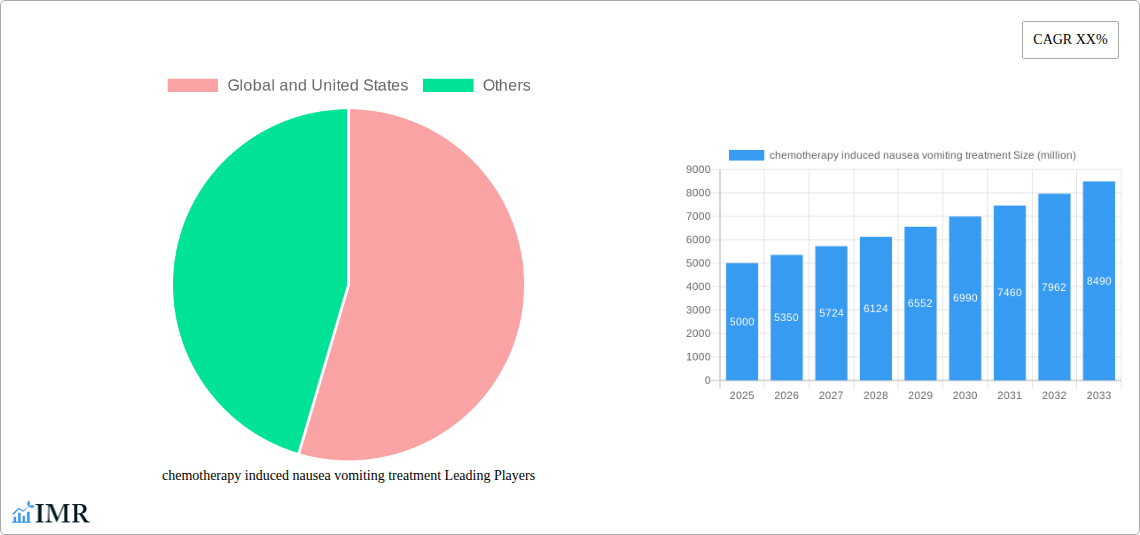
The global market for chemotherapy-induced nausea and vomiting (CINV) treatment is experiencing robust growth, driven by increasing cancer incidence rates and a rising awareness of the debilitating side effects of chemotherapy. The market, estimated at $5 billion in 2025, is projected to achieve a Compound Annual Growth Rate (CAGR) of approximately 7% from 2025 to 2033, reaching a value exceeding $9 billion by 2033. This growth is fueled by several factors, including the development and adoption of more effective antiemetic drugs, such as NK1 receptor antagonists and serotonin 5-HT3 receptor antagonists, offering improved efficacy and tolerability compared to older generations of medications. Furthermore, a shift towards personalized medicine, focusing on tailored treatment strategies based on patient-specific risk factors and chemotherapy regimens, is contributing to enhanced outcomes and market expansion. The market is segmented by drug class (e.g., 5-HT3 receptor antagonists, NK1 receptor antagonists, corticosteroids, dopamine antagonists), administration route (oral, intravenous), and patient demographics (age, cancer type).
Despite the positive growth trajectory, several challenges remain. The high cost of innovative antiemetic drugs poses a significant barrier for some patients, particularly in developing countries. Moreover, drug resistance and the occurrence of treatment-refractory CINV remain significant concerns. Ongoing research focuses on developing novel treatment strategies, including combination therapies and targeted agents, to overcome these limitations and improve patient outcomes. The competitive landscape comprises both established pharmaceutical companies and emerging biotech firms actively involved in research and development, further driving innovation and market dynamics. Regional variations in market penetration exist, with North America and Europe currently holding a larger share due to higher healthcare expenditure and advanced medical infrastructure; however, significant growth potential exists in emerging markets.
Chemotherapy-Induced Nausea and Vomiting (CINV) Treatment Market Report: 2019-2033
This comprehensive report provides a detailed analysis of the global and United States Chemotherapy-Induced Nausea and Vomiting (CINV) Treatment market, offering invaluable insights for industry professionals, investors, and researchers. The study period spans 2019-2033, with 2025 serving as the base and estimated year, and the forecast period encompassing 2025-2033. The historical period covered is 2019-2024. The report segments the market by drug class, route of administration, and end-user (hospitals, clinics, etc.) and offers a granular view of market dynamics, growth trends, and competitive landscapes. The market size is projected to reach xx million units by 2033.
Chemotherapy Induced Nausea Vomiting Treatment Market Dynamics & Structure
The CINV treatment market is characterized by moderate concentration, with a few major players holding significant market share. Technological innovation, particularly in targeted therapies and improved drug delivery systems, is a key driver. Stringent regulatory frameworks and evolving treatment guidelines influence market access and adoption. Competitive pressures arise from the availability of generic drugs and the emergence of novel treatment approaches. The end-user demographic is primarily oncology patients undergoing chemotherapy, with variations in treatment needs based on cancer type and patient characteristics. Mergers and acquisitions (M&A) activity has been moderate, with strategic partnerships driving market consolidation.
- Market Concentration: Moderately concentrated, with top 5 players holding approximately xx% market share in 2024.
- Technological Innovation: Focus on targeted therapies, improved efficacy, and reduced side effects.
- Regulatory Framework: Stringent approval processes and evolving guidelines impact market access.
- Competitive Substitutes: Generic drugs and alternative treatment modalities pose competitive pressures.
- End-User Demographics: Primarily oncology patients receiving chemotherapy, with variations in treatment needs.
- M&A Trends: Moderate M&A activity, with strategic partnerships prevalent. Approximately xx M&A deals were recorded between 2019 and 2024.
Chemotherapy Induced Nausea Vomiting Treatment Growth Trends & Insights
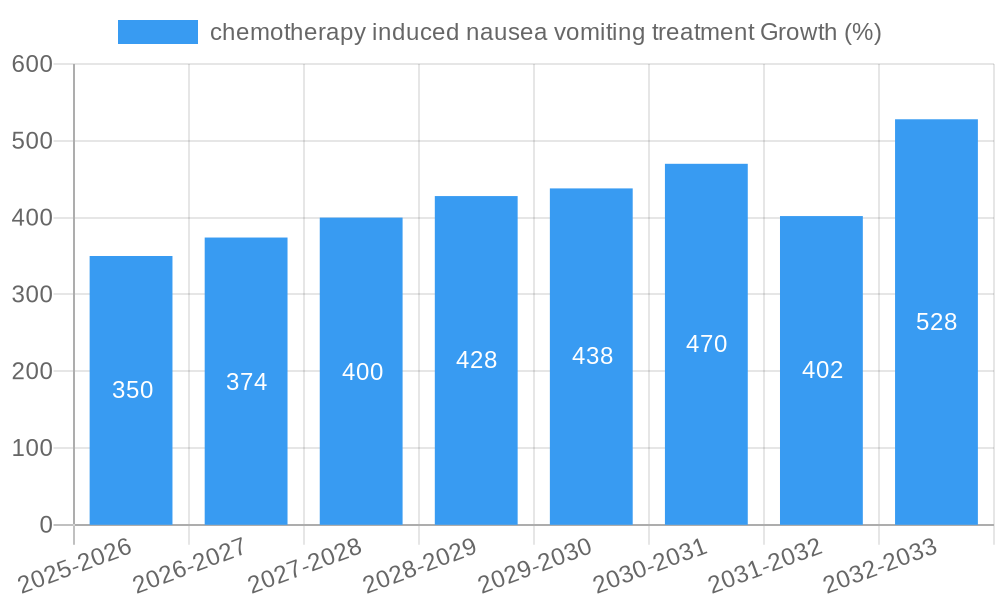
The CINV treatment market witnessed robust growth during the historical period (2019-2024), driven by increasing cancer incidence, rising awareness of CINV management, and the launch of newer, more effective antiemetic drugs. The market size expanded from xx million units in 2019 to xx million units in 2024, exhibiting a CAGR of xx%. Technological advancements, such as the development of NK1 receptor antagonists and serotonin 5-HT3 receptor antagonists, have significantly improved treatment efficacy and patient outcomes. Changes in consumer behavior, reflecting a greater demand for convenient and effective treatment options, are also driving market growth. The market penetration rate for effective antiemetic therapies is estimated at xx% in 2024. Further growth is anticipated during the forecast period, driven by factors outlined in subsequent sections. The projected CAGR for 2025-2033 is xx%.
Dominant Regions, Countries, or Segments in Chemotherapy Induced Nausea Vomiting Treatment
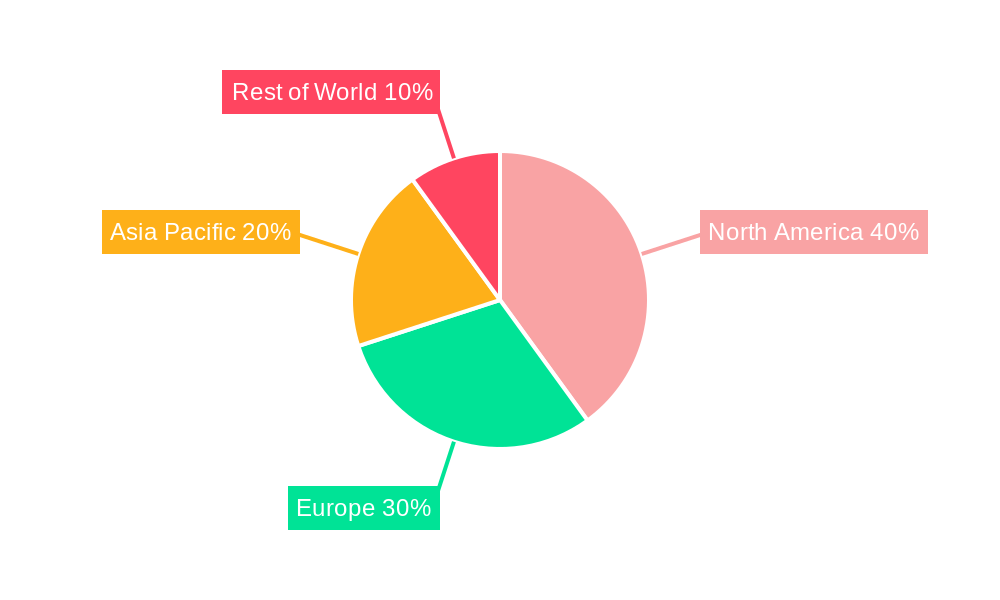
North America, particularly the United States, dominates the CINV treatment market, driven by high cancer incidence rates, advanced healthcare infrastructure, and high spending on healthcare. Europe follows as a significant market, exhibiting strong growth potential. Asia-Pacific is also emerging as a key market, fuelled by rising cancer prevalence and improving healthcare access. Within segments, the 5-HT3 receptor antagonists segment holds the largest market share, due to its wide-spread use and established efficacy.
- North America (US Dominance): High cancer incidence, advanced healthcare infrastructure, high healthcare expenditure.
- Europe: Strong growth potential due to rising cancer prevalence and increasing healthcare awareness.
- Asia-Pacific: Emerging market driven by rising cancer rates and improving healthcare access.
- 5-HT3 Receptor Antagonists: Largest market share due to established efficacy and widespread use.
- NK1 Receptor Antagonists: Significant growth expected due to improved efficacy profiles.
Chemotherapy Induced Nausea Vomiting Treatment Product Landscape
The CINV treatment market features a diverse range of products, including 5-HT3 receptor antagonists (e.g., ondansetron), NK1 receptor antagonists (e.g., aprepitant), corticosteroids (e.g., dexamethasone), and other antiemetics. Innovations focus on improving efficacy, reducing side effects, and developing convenient administration routes (e.g., oral, intravenous). Key selling propositions include superior efficacy, enhanced tolerability, and simplified regimens. Technological advancements in drug delivery systems, such as targeted drug delivery and prolonged-release formulations, are also gaining traction.
Key Drivers, Barriers & Challenges in Chemotherapy Induced Nausea Vomiting Treatment
Key Drivers:
- Rising cancer incidence rates globally.
- Increasing awareness and improved understanding of CINV management.
- Development and launch of novel, more effective antiemetic drugs.
- Favorable reimbursement policies and improved healthcare infrastructure in developed countries.
Key Barriers & Challenges:
- High cost of innovative therapies limiting access in certain regions.
- Potential for drug resistance and the need for combination therapies.
- Stringent regulatory approvals and post-market surveillance requirements.
- Competition from generic drugs and alternative treatment options. The impact of these challenges on market growth is estimated at xx% reduction in the projected market size during the forecast period.
Emerging Opportunities in Chemotherapy Induced Nausea Vomiting Treatment
- Expanding into emerging markets with unmet needs.
- Development of personalized medicine approaches for CINV management.
- Focus on improving patient adherence and compliance through innovative drug delivery systems.
- Exploration of combination therapies to enhance efficacy and reduce side effects.
Growth Accelerators in the Chemotherapy Induced Nausea Vomiting Treatment Industry
Technological advancements in drug delivery, the development of novel drug combinations, and strategic partnerships between pharmaceutical companies and healthcare providers are key growth accelerators. Expansion into underserved markets and a focus on improving patient education and awareness will further stimulate market growth. The anticipated expansion of the oncology market will also significantly benefit the CINV treatment market.
Key Players Shaping the Chemotherapy Induced Nausea Vomiting Treatment Market
Global:
United States:
Notable Milestones in Chemotherapy Induced Nausea Vomiting Treatment Sector
- 2020: FDA approves new formulation of aprepitant.
- 2022: Major pharmaceutical company announces strategic partnership to develop novel CINV therapies.
- 2023: Publication of new clinical trial data highlighting improved efficacy of a combination therapy.
In-Depth Chemotherapy Induced Nausea Vomiting Treatment Market Outlook
The CINV treatment market is poised for continued growth, driven by persistent technological innovations, expanding oncology treatment landscape, and increasing awareness of effective CINV management strategies. Strategic partnerships and the development of personalized therapies represent significant opportunities for market expansion and the improvement of patient outcomes. The market is projected to experience substantial growth in the forecast period, exceeding xx million units by 2033.
chemotherapy induced nausea vomiting treatment Segmentation
- 1. Application
- 2. Types
chemotherapy induced nausea vomiting treatment Segmentation By Geography
-
1. North America
- 1.1. United States
- 1.2. Canada
- 1.3. Mexico
-
2. South America
- 2.1. Brazil
- 2.2. Argentina
- 2.3. Rest of South America
-
3. Europe
- 3.1. United Kingdom
- 3.2. Germany
- 3.3. France
- 3.4. Italy
- 3.5. Spain
- 3.6. Russia
- 3.7. Benelux
- 3.8. Nordics
- 3.9. Rest of Europe
-
4. Middle East & Africa
- 4.1. Turkey
- 4.2. Israel
- 4.3. GCC
- 4.4. North Africa
- 4.5. South Africa
- 4.6. Rest of Middle East & Africa
-
5. Asia Pacific
- 5.1. China
- 5.2. India
- 5.3. Japan
- 5.4. South Korea
- 5.5. ASEAN
- 5.6. Oceania
- 5.7. Rest of Asia Pacific
chemotherapy induced nausea vomiting treatment REPORT HIGHLIGHTS
| Aspects | Details |
|---|---|
| Study Period | 2019-2033 |
| Base Year | 2024 |
| Estimated Year | 2025 |
| Forecast Period | 2025-2033 |
| Historical Period | 2019-2024 |
| Growth Rate | CAGR of XX% from 2019-2033 |
| Segmentation |
|
Table of Contents
- 1. Introduction
- 1.1. Research Scope
- 1.2. Market Segmentation
- 1.3. Research Methodology
- 1.4. Definitions and Assumptions
- 2. Executive Summary
- 2.1. Introduction
- 3. Market Dynamics
- 3.1. Introduction
- 3.2. Market Drivers
- 3.3. Market Restrains
- 3.4. Market Trends
- 4. Market Factor Analysis
- 4.1. Porters Five Forces
- 4.2. Supply/Value Chain
- 4.3. PESTEL analysis
- 4.4. Market Entropy
- 4.5. Patent/Trademark Analysis
- 5. Global chemotherapy induced nausea vomiting treatment Analysis, Insights and Forecast, 2019-2031
- 5.1. Market Analysis, Insights and Forecast - by Application
- 5.2. Market Analysis, Insights and Forecast - by Types
- 5.3. Market Analysis, Insights and Forecast - by Region
- 5.3.1. North America
- 5.3.2. South America
- 5.3.3. Europe
- 5.3.4. Middle East & Africa
- 5.3.5. Asia Pacific
- 5.1. Market Analysis, Insights and Forecast - by Application
- 6. North America chemotherapy induced nausea vomiting treatment Analysis, Insights and Forecast, 2019-2031
- 6.1. Market Analysis, Insights and Forecast - by Application
- 6.2. Market Analysis, Insights and Forecast - by Types
- 6.1. Market Analysis, Insights and Forecast - by Application
- 7. South America chemotherapy induced nausea vomiting treatment Analysis, Insights and Forecast, 2019-2031
- 7.1. Market Analysis, Insights and Forecast - by Application
- 7.2. Market Analysis, Insights and Forecast - by Types
- 7.1. Market Analysis, Insights and Forecast - by Application
- 8. Europe chemotherapy induced nausea vomiting treatment Analysis, Insights and Forecast, 2019-2031
- 8.1. Market Analysis, Insights and Forecast - by Application
- 8.2. Market Analysis, Insights and Forecast - by Types
- 8.1. Market Analysis, Insights and Forecast - by Application
- 9. Middle East & Africa chemotherapy induced nausea vomiting treatment Analysis, Insights and Forecast, 2019-2031
- 9.1. Market Analysis, Insights and Forecast - by Application
- 9.2. Market Analysis, Insights and Forecast - by Types
- 9.1. Market Analysis, Insights and Forecast - by Application
- 10. Asia Pacific chemotherapy induced nausea vomiting treatment Analysis, Insights and Forecast, 2019-2031
- 10.1. Market Analysis, Insights and Forecast - by Application
- 10.2. Market Analysis, Insights and Forecast - by Types
- 10.1. Market Analysis, Insights and Forecast - by Application
- 11. Competitive Analysis
- 11.1. Global Market Share Analysis 2024
- 11.2. Company Profiles
- 11.2.1. Global and United States
List of Figures
- Figure 1: Global chemotherapy induced nausea vomiting treatment Revenue Breakdown (million, %) by Region 2024 & 2032
- Figure 2: North America chemotherapy induced nausea vomiting treatment Revenue (million), by Application 2024 & 2032
- Figure 3: North America chemotherapy induced nausea vomiting treatment Revenue Share (%), by Application 2024 & 2032
- Figure 4: North America chemotherapy induced nausea vomiting treatment Revenue (million), by Types 2024 & 2032
- Figure 5: North America chemotherapy induced nausea vomiting treatment Revenue Share (%), by Types 2024 & 2032
- Figure 6: North America chemotherapy induced nausea vomiting treatment Revenue (million), by Country 2024 & 2032
- Figure 7: North America chemotherapy induced nausea vomiting treatment Revenue Share (%), by Country 2024 & 2032
- Figure 8: South America chemotherapy induced nausea vomiting treatment Revenue (million), by Application 2024 & 2032
- Figure 9: South America chemotherapy induced nausea vomiting treatment Revenue Share (%), by Application 2024 & 2032
- Figure 10: South America chemotherapy induced nausea vomiting treatment Revenue (million), by Types 2024 & 2032
- Figure 11: South America chemotherapy induced nausea vomiting treatment Revenue Share (%), by Types 2024 & 2032
- Figure 12: South America chemotherapy induced nausea vomiting treatment Revenue (million), by Country 2024 & 2032
- Figure 13: South America chemotherapy induced nausea vomiting treatment Revenue Share (%), by Country 2024 & 2032
- Figure 14: Europe chemotherapy induced nausea vomiting treatment Revenue (million), by Application 2024 & 2032
- Figure 15: Europe chemotherapy induced nausea vomiting treatment Revenue Share (%), by Application 2024 & 2032
- Figure 16: Europe chemotherapy induced nausea vomiting treatment Revenue (million), by Types 2024 & 2032
- Figure 17: Europe chemotherapy induced nausea vomiting treatment Revenue Share (%), by Types 2024 & 2032
- Figure 18: Europe chemotherapy induced nausea vomiting treatment Revenue (million), by Country 2024 & 2032
- Figure 19: Europe chemotherapy induced nausea vomiting treatment Revenue Share (%), by Country 2024 & 2032
- Figure 20: Middle East & Africa chemotherapy induced nausea vomiting treatment Revenue (million), by Application 2024 & 2032
- Figure 21: Middle East & Africa chemotherapy induced nausea vomiting treatment Revenue Share (%), by Application 2024 & 2032
- Figure 22: Middle East & Africa chemotherapy induced nausea vomiting treatment Revenue (million), by Types 2024 & 2032
- Figure 23: Middle East & Africa chemotherapy induced nausea vomiting treatment Revenue Share (%), by Types 2024 & 2032
- Figure 24: Middle East & Africa chemotherapy induced nausea vomiting treatment Revenue (million), by Country 2024 & 2032
- Figure 25: Middle East & Africa chemotherapy induced nausea vomiting treatment Revenue Share (%), by Country 2024 & 2032
- Figure 26: Asia Pacific chemotherapy induced nausea vomiting treatment Revenue (million), by Application 2024 & 2032
- Figure 27: Asia Pacific chemotherapy induced nausea vomiting treatment Revenue Share (%), by Application 2024 & 2032
- Figure 28: Asia Pacific chemotherapy induced nausea vomiting treatment Revenue (million), by Types 2024 & 2032
- Figure 29: Asia Pacific chemotherapy induced nausea vomiting treatment Revenue Share (%), by Types 2024 & 2032
- Figure 30: Asia Pacific chemotherapy induced nausea vomiting treatment Revenue (million), by Country 2024 & 2032
- Figure 31: Asia Pacific chemotherapy induced nausea vomiting treatment Revenue Share (%), by Country 2024 & 2032
List of Tables
- Table 1: Global chemotherapy induced nausea vomiting treatment Revenue million Forecast, by Region 2019 & 2032
- Table 2: Global chemotherapy induced nausea vomiting treatment Revenue million Forecast, by Application 2019 & 2032
- Table 3: Global chemotherapy induced nausea vomiting treatment Revenue million Forecast, by Types 2019 & 2032
- Table 4: Global chemotherapy induced nausea vomiting treatment Revenue million Forecast, by Region 2019 & 2032
- Table 5: Global chemotherapy induced nausea vomiting treatment Revenue million Forecast, by Application 2019 & 2032
- Table 6: Global chemotherapy induced nausea vomiting treatment Revenue million Forecast, by Types 2019 & 2032
- Table 7: Global chemotherapy induced nausea vomiting treatment Revenue million Forecast, by Country 2019 & 2032
- Table 8: United States chemotherapy induced nausea vomiting treatment Revenue (million) Forecast, by Application 2019 & 2032
- Table 9: Canada chemotherapy induced nausea vomiting treatment Revenue (million) Forecast, by Application 2019 & 2032
- Table 10: Mexico chemotherapy induced nausea vomiting treatment Revenue (million) Forecast, by Application 2019 & 2032
- Table 11: Global chemotherapy induced nausea vomiting treatment Revenue million Forecast, by Application 2019 & 2032
- Table 12: Global chemotherapy induced nausea vomiting treatment Revenue million Forecast, by Types 2019 & 2032
- Table 13: Global chemotherapy induced nausea vomiting treatment Revenue million Forecast, by Country 2019 & 2032
- Table 14: Brazil chemotherapy induced nausea vomiting treatment Revenue (million) Forecast, by Application 2019 & 2032
- Table 15: Argentina chemotherapy induced nausea vomiting treatment Revenue (million) Forecast, by Application 2019 & 2032
- Table 16: Rest of South America chemotherapy induced nausea vomiting treatment Revenue (million) Forecast, by Application 2019 & 2032
- Table 17: Global chemotherapy induced nausea vomiting treatment Revenue million Forecast, by Application 2019 & 2032
- Table 18: Global chemotherapy induced nausea vomiting treatment Revenue million Forecast, by Types 2019 & 2032
- Table 19: Global chemotherapy induced nausea vomiting treatment Revenue million Forecast, by Country 2019 & 2032
- Table 20: United Kingdom chemotherapy induced nausea vomiting treatment Revenue (million) Forecast, by Application 2019 & 2032
- Table 21: Germany chemotherapy induced nausea vomiting treatment Revenue (million) Forecast, by Application 2019 & 2032
- Table 22: France chemotherapy induced nausea vomiting treatment Revenue (million) Forecast, by Application 2019 & 2032
- Table 23: Italy chemotherapy induced nausea vomiting treatment Revenue (million) Forecast, by Application 2019 & 2032
- Table 24: Spain chemotherapy induced nausea vomiting treatment Revenue (million) Forecast, by Application 2019 & 2032
- Table 25: Russia chemotherapy induced nausea vomiting treatment Revenue (million) Forecast, by Application 2019 & 2032
- Table 26: Benelux chemotherapy induced nausea vomiting treatment Revenue (million) Forecast, by Application 2019 & 2032
- Table 27: Nordics chemotherapy induced nausea vomiting treatment Revenue (million) Forecast, by Application 2019 & 2032
- Table 28: Rest of Europe chemotherapy induced nausea vomiting treatment Revenue (million) Forecast, by Application 2019 & 2032
- Table 29: Global chemotherapy induced nausea vomiting treatment Revenue million Forecast, by Application 2019 & 2032
- Table 30: Global chemotherapy induced nausea vomiting treatment Revenue million Forecast, by Types 2019 & 2032
- Table 31: Global chemotherapy induced nausea vomiting treatment Revenue million Forecast, by Country 2019 & 2032
- Table 32: Turkey chemotherapy induced nausea vomiting treatment Revenue (million) Forecast, by Application 2019 & 2032
- Table 33: Israel chemotherapy induced nausea vomiting treatment Revenue (million) Forecast, by Application 2019 & 2032
- Table 34: GCC chemotherapy induced nausea vomiting treatment Revenue (million) Forecast, by Application 2019 & 2032
- Table 35: North Africa chemotherapy induced nausea vomiting treatment Revenue (million) Forecast, by Application 2019 & 2032
- Table 36: South Africa chemotherapy induced nausea vomiting treatment Revenue (million) Forecast, by Application 2019 & 2032
- Table 37: Rest of Middle East & Africa chemotherapy induced nausea vomiting treatment Revenue (million) Forecast, by Application 2019 & 2032
- Table 38: Global chemotherapy induced nausea vomiting treatment Revenue million Forecast, by Application 2019 & 2032
- Table 39: Global chemotherapy induced nausea vomiting treatment Revenue million Forecast, by Types 2019 & 2032
- Table 40: Global chemotherapy induced nausea vomiting treatment Revenue million Forecast, by Country 2019 & 2032
- Table 41: China chemotherapy induced nausea vomiting treatment Revenue (million) Forecast, by Application 2019 & 2032
- Table 42: India chemotherapy induced nausea vomiting treatment Revenue (million) Forecast, by Application 2019 & 2032
- Table 43: Japan chemotherapy induced nausea vomiting treatment Revenue (million) Forecast, by Application 2019 & 2032
- Table 44: South Korea chemotherapy induced nausea vomiting treatment Revenue (million) Forecast, by Application 2019 & 2032
- Table 45: ASEAN chemotherapy induced nausea vomiting treatment Revenue (million) Forecast, by Application 2019 & 2032
- Table 46: Oceania chemotherapy induced nausea vomiting treatment Revenue (million) Forecast, by Application 2019 & 2032
- Table 47: Rest of Asia Pacific chemotherapy induced nausea vomiting treatment Revenue (million) Forecast, by Application 2019 & 2032
Frequently Asked Questions
1. What is the projected Compound Annual Growth Rate (CAGR) of the chemotherapy induced nausea vomiting treatment?
The projected CAGR is approximately XX%.
2. Which companies are prominent players in the chemotherapy induced nausea vomiting treatment?
Key companies in the market include Global and United States.
3. What are the main segments of the chemotherapy induced nausea vomiting treatment?
The market segments include Application, Types.
4. Can you provide details about the market size?
The market size is estimated to be USD XXX million as of 2022.
5. What are some drivers contributing to market growth?
N/A
6. What are the notable trends driving market growth?
N/A
7. Are there any restraints impacting market growth?
N/A
8. Can you provide examples of recent developments in the market?
N/A
9. What pricing options are available for accessing the report?
Pricing options include single-user, multi-user, and enterprise licenses priced at USD 4350.00, USD 6525.00, and USD 8700.00 respectively.
10. Is the market size provided in terms of value or volume?
The market size is provided in terms of value, measured in million.
11. Are there any specific market keywords associated with the report?
Yes, the market keyword associated with the report is "chemotherapy induced nausea vomiting treatment," which aids in identifying and referencing the specific market segment covered.
12. How do I determine which pricing option suits my needs best?
The pricing options vary based on user requirements and access needs. Individual users may opt for single-user licenses, while businesses requiring broader access may choose multi-user or enterprise licenses for cost-effective access to the report.
13. Are there any additional resources or data provided in the chemotherapy induced nausea vomiting treatment report?
While the report offers comprehensive insights, it's advisable to review the specific contents or supplementary materials provided to ascertain if additional resources or data are available.
14. How can I stay updated on further developments or reports in the chemotherapy induced nausea vomiting treatment?
To stay informed about further developments, trends, and reports in the chemotherapy induced nausea vomiting treatment, consider subscribing to industry newsletters, following relevant companies and organizations, or regularly checking reputable industry news sources and publications.
Methodology
Step 1 - Identification of Relevant Samples Size from Population Database


Step 2 - Approaches for Defining Global Market Size (Value, Volume* & Price*)

Note*: In applicable scenarios
Step 3 - Data Sources
Primary Research
- Web Analytics
- Survey Reports
- Research Institute
- Latest Research Reports
- Opinion Leaders
Secondary Research
- Annual Reports
- White Paper
- Latest Press Release
- Industry Association
- Paid Database
- Investor Presentations

Step 4 - Data Triangulation
Involves using different sources of information in order to increase the validity of a study
These sources are likely to be stakeholders in a program - participants, other researchers, program staff, other community members, and so on.
Then we put all data in single framework & apply various statistical tools to find out the dynamic on the market.
During the analysis stage, feedback from the stakeholder groups would be compared to determine areas of agreement as well as areas of divergence
