

Key Insights
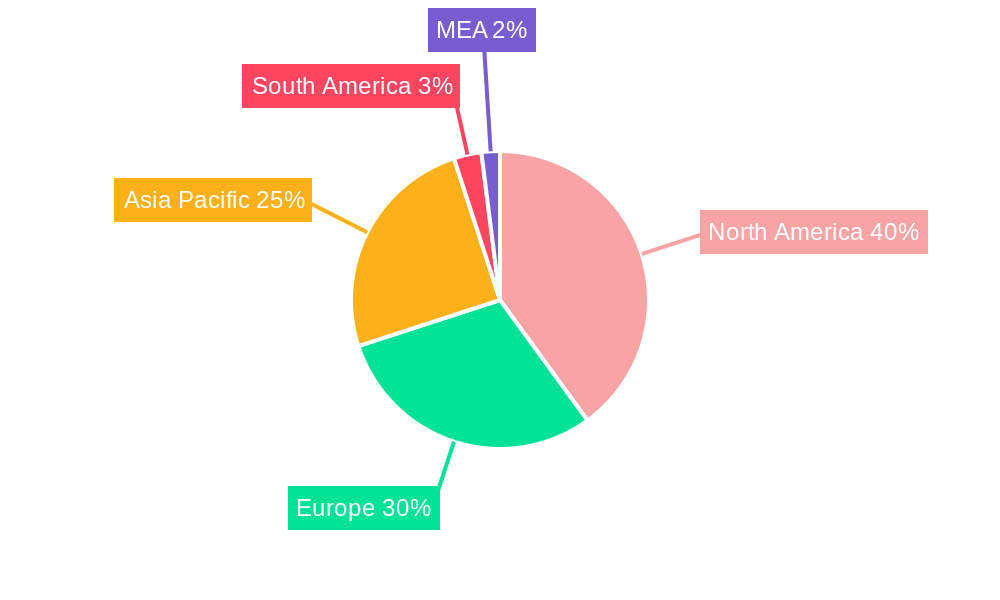
The computer vision market, valued at $12.88 billion in 2025, is projected to experience robust growth, driven by increasing adoption across diverse sectors. A compound annual growth rate (CAGR) of 8.32% from 2025 to 2033 indicates a significant expansion, fueled primarily by advancements in artificial intelligence (AI), machine learning (ML), and deep learning algorithms. The rising demand for automation in manufacturing, logistics, and healthcare is a major catalyst. Specifically, the automotive industry's reliance on advanced driver-assistance systems (ADAS) and autonomous vehicles significantly contributes to market growth. Furthermore, the proliferation of smart cameras and improved processing power are lowering the barriers to entry for computer vision applications, enabling wider adoption across various end-user industries. The software segment is expected to witness faster growth compared to the hardware segment, owing to the continuous development of sophisticated algorithms and software solutions tailored for specific applications. Geographically, North America currently holds a dominant market share, followed by Europe and Asia Pacific. However, the Asia Pacific region is poised for rapid expansion due to increasing investments in technological infrastructure and the presence of a large manufacturing base.
The market segmentation reveals significant opportunities within specific areas. For instance, the healthcare and pharmaceutical industry utilizes computer vision for diagnostics, drug discovery, and robotic surgery, driving substantial demand. Similarly, the food and beverage sector employs computer vision for quality control, product inspection, and process optimization. The competitive landscape is characterized by both established players and emerging startups. Key players like Keyence, Cognex, and MVTec are leveraging their technological expertise and strong market presence to maintain their leadership. While smaller companies are focusing on niche applications and innovative solutions to carve out a market share. However, challenges such as data security concerns, high initial investment costs, and the need for skilled professionals to implement and maintain computer vision systems remain potential restraints on market growth. Nevertheless, ongoing technological innovation and the continuous expansion of applications across various industries will likely overcome these challenges and propel the market toward sustained growth throughout the forecast period.

Computer Vision Industry Market Report: 2019-2033
This comprehensive report provides an in-depth analysis of the Computer Vision industry, encompassing market dynamics, growth trends, regional performance, product landscapes, and key players. With a study period spanning 2019-2033, a base year of 2025, and a forecast period of 2025-2033, this report offers invaluable insights for industry professionals, investors, and strategists. The report analyzes parent markets (imaging technologies) and child markets (specific computer vision applications across various industries) to offer a holistic view of the market.
Computer Vision Industry Market Dynamics & Structure
The Computer Vision industry is experiencing rapid growth fueled by technological advancements, increasing adoption across diverse sectors, and strategic mergers & acquisitions. Market concentration is moderate, with several key players dominating specific segments. Technological innovation, particularly in deep learning and artificial intelligence (AI), drives significant improvements in accuracy, speed, and application versatility. Regulatory frameworks concerning data privacy and AI ethics are evolving, impacting market development. The market faces competition from alternative technologies, such as lidar and radar, although computer vision’s cost-effectiveness and mature technology base provide a strong competitive advantage. End-user demographics are shifting towards industries with high automation needs and data-driven operations. M&A activity is frequent, with larger players acquiring smaller companies to expand their product portfolios and market reach.
- Market Concentration: Moderate, with top 10 players holding approximately xx% market share in 2025.
- Technological Innovation: Deep learning, AI, and improved sensor technologies are key drivers.
- Regulatory Landscape: Data privacy regulations (GDPR, CCPA) and AI ethics guidelines are shaping industry practices.
- Competitive Substitutes: Lidar, radar, and other sensing technologies offer limited competition.
- M&A Activity: xx major deals (in value of millions of $) were recorded between 2019-2024, primarily focused on expanding capabilities and market penetration.
- Innovation Barriers: High R&D costs, talent acquisition, and data availability are significant hurdles.
Computer Vision Industry Growth Trends & Insights
The Computer Vision market is experiencing robust growth, projected to reach xx million units by 2033. The Compound Annual Growth Rate (CAGR) from 2025 to 2033 is estimated at xx%. Adoption rates are accelerating across various end-user industries, driven by increasing automation demands, improved accuracy, and declining costs. Technological disruptions, such as the rise of edge computing and the increasing sophistication of AI algorithms, are transforming the industry landscape. Consumer behavior shifts are evident in the growing preference for automated systems and AI-powered solutions. Market penetration is high in developed economies and rapidly increasing in emerging markets. This growth is fueled by increasing digitalization across industries, leading to the need for advanced automation and process optimization. The report details specific market segmentation and penetration rates by region and by end-user industry, providing a thorough understanding of market dynamics.

Dominant Regions, Countries, or Segments in Computer Vision Industry
North America and Europe currently hold the largest market shares, driven by early adoption of advanced technologies, robust research and development activities, and well-established industrial automation sectors. However, the Asia-Pacific region is projected to experience the fastest growth, driven by significant investments in manufacturing and industrial automation, coupled with a burgeoning consumer electronics market. Within segments, the Hardware segment (including cameras, sensors, and processing units) currently commands a larger market share than the Software segment. PC-based systems are currently more prevalent than Smart Camera-based systems but the latter is expected to grow significantly in the forecast period. The Automotive, Electronics and Semiconductors, and Healthcare and Pharmaceutical end-user industries are key growth drivers, while the Food and Beverage industry presents significant, though currently less saturated, opportunities.
- Key Drivers: Robust R&D, government initiatives supporting digitalization, and high demand from end-user industries.
- North America: High adoption rates in automotive and healthcare drive significant market growth.
- Europe: Strong presence of technology providers and established manufacturing sectors contribute to market leadership.
- Asia-Pacific: Rapid industrialization and growing consumer electronics market fuel exceptional growth potential.
- Hardware Segment: Largest market share due to increasing demand for high-performance imaging devices.
- Automotive End-User Industry: Significant growth due to advanced driver-assistance systems (ADAS) and autonomous vehicle development.
Computer Vision Industry Product Landscape
The Computer Vision industry showcases a diverse range of products, from high-resolution cameras and specialized sensors to sophisticated software platforms and AI-powered analytics tools. Product innovations focus on miniaturization, enhanced processing capabilities, improved accuracy, and real-time performance. Applications span diverse sectors, including automated quality control in manufacturing, medical image analysis, autonomous driving, and retail analytics. Key performance metrics include image resolution, processing speed, accuracy rates, and ease of integration into existing systems. Unique selling propositions often center around specialized algorithms, ease of use, and tailored solutions for specific industry needs. The market has seen significant advancement in low-light imaging, enhanced depth sensing, and integration with cloud-based services.
Key Drivers, Barriers & Challenges in Computer Vision Industry
Key Drivers:
- Increasing automation needs across industries.
- Advancements in AI and deep learning algorithms.
- Decreasing cost of hardware components.
- Growing availability of large datasets for training AI models.
Challenges & Restraints:
- High initial investment costs for implementation.
- Data security and privacy concerns.
- Lack of skilled workforce specializing in computer vision technology.
- Ethical considerations surrounding AI-powered decision-making. These can lead to xx million units lost annually.
Emerging Opportunities in Computer Vision Industry
Emerging opportunities lie in the expansion into untapped markets, such as agriculture, smart cities, and robotics. Innovative applications are emerging in areas like predictive maintenance, personalized medicine, and advanced security systems. Evolving consumer preferences are driving demand for user-friendly, AI-powered solutions. The integration of computer vision with other technologies, such as IoT and blockchain, presents significant growth potential. Moreover, the development of specialized solutions for niche industries is creating new opportunities.
Growth Accelerators in the Computer Vision Industry
Technological breakthroughs, particularly in edge computing and low-power AI, are significantly accelerating market growth. Strategic partnerships between hardware and software providers are streamlining the integration of computer vision solutions into various applications. Market expansion strategies, including penetration into emerging markets and diversification into new application areas, are creating new growth avenues.
Key Players Shaping the Computer Vision Industry Market
- Keyence Corporation
- IDS Imaging Development Systems GmbH (Paul Hartmann AG)
- MVTec Software GmbH
- National Instruments Corporation (Emerson)
- Cognex Corporation
- Teledyne DALSA (Teledyne Technologies Company)
- Isra Vision AG (Atlas Copco Group)
- Omron Corporation
- Toshiba Corporation
- Sony Group Corporation
Notable Milestones in Computer Vision Industry Sector
- October 2023: Keyence Corporation launched its new VS series smart camera vision systems, featuring advanced lens control technology.
- November 2023: Basler AG and MVTec Software GmbH partnered with Siemens to integrate machine vision solutions into automation technologies.
In-Depth Computer Vision Industry Market Outlook
The Computer Vision industry is poised for continued robust growth, driven by technological advancements, increasing adoption across diverse sectors, and strategic collaborations. Future market potential is significant, with untapped opportunities in various applications and emerging markets. Strategic partnerships and investments in research and development will be crucial for companies to capitalize on the long-term growth prospects of this dynamic industry. The continued evolution of AI and related technologies will unlock even more sophisticated and efficient computer vision applications in the years to come.
Computer Vision Industry Segmentation
-
1. Component
-
1.1. Hardware
- 1.1.1. Vision Systems
- 1.1.2. Cameras
- 1.1.3. Optics and Illumination Systems
- 1.1.4. Frame Grabbers
- 1.1.5. Other Types of Hardware
- 1.2. Software
-
1.1. Hardware
-
2. Product
- 2.1. PC-based
- 2.2. Smart Camera-based
-
3. End-user Industry
- 3.1. Food and Beverage
- 3.2. Healthcare and Pharmaceutical
- 3.3. Logistics and Retail
- 3.4. Automotive
- 3.5. Electronics and Semiconductors
- 3.6. Other End-user Industries
Computer Vision Industry Segmentation By Geography
-
1. North America
- 1.1. United States
- 1.2. Canada
-
2. Europe
- 2.1. Germany
- 2.2. United Kingdom
- 2.3. France
- 2.4. Italy
- 2.5. Spain
-
3. Asia
- 3.1. China
- 3.2. Japan
- 3.3. South Korea
- 3.4. India
- 4. Australia and New Zealand
Computer Vision Industry REPORT HIGHLIGHTS
| Aspects | Details |
|---|---|
| Study Period | 2019-2033 |
| Base Year | 2024 |
| Estimated Year | 2025 |
| Forecast Period | 2025-2033 |
| Historical Period | 2019-2024 |
| Growth Rate | CAGR of 8.32% from 2019-2033 |
| Segmentation |
|
Table of Contents
- 1. Introduction
- 1.1. Research Scope
- 1.2. Market Segmentation
- 1.3. Research Methodology
- 1.4. Definitions and Assumptions
- 2. Executive Summary
- 2.1. Introduction
- 3. Market Dynamics
- 3.1. Introduction
- 3.2. Market Drivers
- 3.2.1. Rising Need for Quality Inspections; Increasing Demand for Vision-guided Robotic Systems
- 3.3. Market Restrains
- 3.3.1. Scarcity of Flexible Machine Vision Solutions
- 3.4. Market Trends
- 3.4.1. Cameras to be the Largest Hardware Segment
- 4. Market Factor Analysis
- 4.1. Porters Five Forces
- 4.2. Supply/Value Chain
- 4.3. PESTEL analysis
- 4.4. Market Entropy
- 4.5. Patent/Trademark Analysis
- 5. Global Computer Vision Industry Analysis, Insights and Forecast, 2019-2031
- 5.1. Market Analysis, Insights and Forecast - by Component
- 5.1.1. Hardware
- 5.1.1.1. Vision Systems
- 5.1.1.2. Cameras
- 5.1.1.3. Optics and Illumination Systems
- 5.1.1.4. Frame Grabbers
- 5.1.1.5. Other Types of Hardware
- 5.1.2. Software
- 5.1.1. Hardware
- 5.2. Market Analysis, Insights and Forecast - by Product
- 5.2.1. PC-based
- 5.2.2. Smart Camera-based
- 5.3. Market Analysis, Insights and Forecast - by End-user Industry
- 5.3.1. Food and Beverage
- 5.3.2. Healthcare and Pharmaceutical
- 5.3.3. Logistics and Retail
- 5.3.4. Automotive
- 5.3.5. Electronics and Semiconductors
- 5.3.6. Other End-user Industries
- 5.4. Market Analysis, Insights and Forecast - by Region
- 5.4.1. North America
- 5.4.2. Europe
- 5.4.3. Asia
- 5.4.4. Australia and New Zealand
- 5.1. Market Analysis, Insights and Forecast - by Component
- 6. North America Computer Vision Industry Analysis, Insights and Forecast, 2019-2031
- 6.1. Market Analysis, Insights and Forecast - by Component
- 6.1.1. Hardware
- 6.1.1.1. Vision Systems
- 6.1.1.2. Cameras
- 6.1.1.3. Optics and Illumination Systems
- 6.1.1.4. Frame Grabbers
- 6.1.1.5. Other Types of Hardware
- 6.1.2. Software
- 6.1.1. Hardware
- 6.2. Market Analysis, Insights and Forecast - by Product
- 6.2.1. PC-based
- 6.2.2. Smart Camera-based
- 6.3. Market Analysis, Insights and Forecast - by End-user Industry
- 6.3.1. Food and Beverage
- 6.3.2. Healthcare and Pharmaceutical
- 6.3.3. Logistics and Retail
- 6.3.4. Automotive
- 6.3.5. Electronics and Semiconductors
- 6.3.6. Other End-user Industries
- 6.1. Market Analysis, Insights and Forecast - by Component
- 7. Europe Computer Vision Industry Analysis, Insights and Forecast, 2019-2031
- 7.1. Market Analysis, Insights and Forecast - by Component
- 7.1.1. Hardware
- 7.1.1.1. Vision Systems
- 7.1.1.2. Cameras
- 7.1.1.3. Optics and Illumination Systems
- 7.1.1.4. Frame Grabbers
- 7.1.1.5. Other Types of Hardware
- 7.1.2. Software
- 7.1.1. Hardware
- 7.2. Market Analysis, Insights and Forecast - by Product
- 7.2.1. PC-based
- 7.2.2. Smart Camera-based
- 7.3. Market Analysis, Insights and Forecast - by End-user Industry
- 7.3.1. Food and Beverage
- 7.3.2. Healthcare and Pharmaceutical
- 7.3.3. Logistics and Retail
- 7.3.4. Automotive
- 7.3.5. Electronics and Semiconductors
- 7.3.6. Other End-user Industries
- 7.1. Market Analysis, Insights and Forecast - by Component
- 8. Asia Computer Vision Industry Analysis, Insights and Forecast, 2019-2031
- 8.1. Market Analysis, Insights and Forecast - by Component
- 8.1.1. Hardware
- 8.1.1.1. Vision Systems
- 8.1.1.2. Cameras
- 8.1.1.3. Optics and Illumination Systems
- 8.1.1.4. Frame Grabbers
- 8.1.1.5. Other Types of Hardware
- 8.1.2. Software
- 8.1.1. Hardware
- 8.2. Market Analysis, Insights and Forecast - by Product
- 8.2.1. PC-based
- 8.2.2. Smart Camera-based
- 8.3. Market Analysis, Insights and Forecast - by End-user Industry
- 8.3.1. Food and Beverage
- 8.3.2. Healthcare and Pharmaceutical
- 8.3.3. Logistics and Retail
- 8.3.4. Automotive
- 8.3.5. Electronics and Semiconductors
- 8.3.6. Other End-user Industries
- 8.1. Market Analysis, Insights and Forecast - by Component
- 9. Australia and New Zealand Computer Vision Industry Analysis, Insights and Forecast, 2019-2031
- 9.1. Market Analysis, Insights and Forecast - by Component
- 9.1.1. Hardware
- 9.1.1.1. Vision Systems
- 9.1.1.2. Cameras
- 9.1.1.3. Optics and Illumination Systems
- 9.1.1.4. Frame Grabbers
- 9.1.1.5. Other Types of Hardware
- 9.1.2. Software
- 9.1.1. Hardware
- 9.2. Market Analysis, Insights and Forecast - by Product
- 9.2.1. PC-based
- 9.2.2. Smart Camera-based
- 9.3. Market Analysis, Insights and Forecast - by End-user Industry
- 9.3.1. Food and Beverage
- 9.3.2. Healthcare and Pharmaceutical
- 9.3.3. Logistics and Retail
- 9.3.4. Automotive
- 9.3.5. Electronics and Semiconductors
- 9.3.6. Other End-user Industries
- 9.1. Market Analysis, Insights and Forecast - by Component
- 10. North America Computer Vision Industry Analysis, Insights and Forecast, 2019-2031
- 10.1. Market Analysis, Insights and Forecast - By Country/Sub-region
- 10.1.1 United States
- 10.1.2 Canada
- 10.1.3 Mexico
- 11. Europe Computer Vision Industry Analysis, Insights and Forecast, 2019-2031
- 11.1. Market Analysis, Insights and Forecast - By Country/Sub-region
- 11.1.1 Germany
- 11.1.2 United Kingdom
- 11.1.3 France
- 11.1.4 Spain
- 11.1.5 Italy
- 11.1.6 Spain
- 11.1.7 Belgium
- 11.1.8 Netherland
- 11.1.9 Nordics
- 11.1.10 Rest of Europe
- 12. Asia Pacific Computer Vision Industry Analysis, Insights and Forecast, 2019-2031
- 12.1. Market Analysis, Insights and Forecast - By Country/Sub-region
- 12.1.1 China
- 12.1.2 Japan
- 12.1.3 India
- 12.1.4 South Korea
- 12.1.5 Southeast Asia
- 12.1.6 Australia
- 12.1.7 Indonesia
- 12.1.8 Phillipes
- 12.1.9 Singapore
- 12.1.10 Thailandc
- 12.1.11 Rest of Asia Pacific
- 13. South America Computer Vision Industry Analysis, Insights and Forecast, 2019-2031
- 13.1. Market Analysis, Insights and Forecast - By Country/Sub-region
- 13.1.1 Brazil
- 13.1.2 Argentina
- 13.1.3 Peru
- 13.1.4 Chile
- 13.1.5 Colombia
- 13.1.6 Ecuador
- 13.1.7 Venezuela
- 13.1.8 Rest of South America
- 14. North America Computer Vision Industry Analysis, Insights and Forecast, 2019-2031
- 14.1. Market Analysis, Insights and Forecast - By Country/Sub-region
- 14.1.1 United States
- 14.1.2 Canada
- 14.1.3 Mexico
- 15. MEA Computer Vision Industry Analysis, Insights and Forecast, 2019-2031
- 15.1. Market Analysis, Insights and Forecast - By Country/Sub-region
- 15.1.1 United Arab Emirates
- 15.1.2 Saudi Arabia
- 15.1.3 South Africa
- 15.1.4 Rest of Middle East and Africa
- 16. Competitive Analysis
- 16.1. Global Market Share Analysis 2024
- 16.2. Company Profiles
- 16.2.1 Keyence Corporation
- 16.2.1.1. Overview
- 16.2.1.2. Products
- 16.2.1.3. SWOT Analysis
- 16.2.1.4. Recent Developments
- 16.2.1.5. Financials (Based on Availability)
- 16.2.2 IDS Imaging Development Systems GmbH (Paul Hartmann AG)
- 16.2.2.1. Overview
- 16.2.2.2. Products
- 16.2.2.3. SWOT Analysis
- 16.2.2.4. Recent Developments
- 16.2.2.5. Financials (Based on Availability)
- 16.2.3 MVTec Software GmbH
- 16.2.3.1. Overview
- 16.2.3.2. Products
- 16.2.3.3. SWOT Analysis
- 16.2.3.4. Recent Developments
- 16.2.3.5. Financials (Based on Availability)
- 16.2.4 National Instruments Corporation (Emerson)
- 16.2.4.1. Overview
- 16.2.4.2. Products
- 16.2.4.3. SWOT Analysis
- 16.2.4.4. Recent Developments
- 16.2.4.5. Financials (Based on Availability)
- 16.2.5 Cognex Corporation
- 16.2.5.1. Overview
- 16.2.5.2. Products
- 16.2.5.3. SWOT Analysis
- 16.2.5.4. Recent Developments
- 16.2.5.5. Financials (Based on Availability)
- 16.2.6 Teledyne DALSA (Teledyne Technologies Company)
- 16.2.6.1. Overview
- 16.2.6.2. Products
- 16.2.6.3. SWOT Analysis
- 16.2.6.4. Recent Developments
- 16.2.6.5. Financials (Based on Availability)
- 16.2.7 Isra Vision AG (Atlas Copco Group)
- 16.2.7.1. Overview
- 16.2.7.2. Products
- 16.2.7.3. SWOT Analysis
- 16.2.7.4. Recent Developments
- 16.2.7.5. Financials (Based on Availability)
- 16.2.8 Omron Corporation
- 16.2.8.1. Overview
- 16.2.8.2. Products
- 16.2.8.3. SWOT Analysis
- 16.2.8.4. Recent Developments
- 16.2.8.5. Financials (Based on Availability)
- 16.2.9 Toshiba Corporation
- 16.2.9.1. Overview
- 16.2.9.2. Products
- 16.2.9.3. SWOT Analysis
- 16.2.9.4. Recent Developments
- 16.2.9.5. Financials (Based on Availability)
- 16.2.10 Sony Group Corporation
- 16.2.10.1. Overview
- 16.2.10.2. Products
- 16.2.10.3. SWOT Analysis
- 16.2.10.4. Recent Developments
- 16.2.10.5. Financials (Based on Availability)
- 16.2.1 Keyence Corporation
List of Figures
- Figure 1: Global Computer Vision Industry Revenue Breakdown (Million, %) by Region 2024 & 2032
- Figure 2: North America Computer Vision Industry Revenue (Million), by Country 2024 & 2032
- Figure 3: North America Computer Vision Industry Revenue Share (%), by Country 2024 & 2032
- Figure 4: Europe Computer Vision Industry Revenue (Million), by Country 2024 & 2032
- Figure 5: Europe Computer Vision Industry Revenue Share (%), by Country 2024 & 2032
- Figure 6: Asia Pacific Computer Vision Industry Revenue (Million), by Country 2024 & 2032
- Figure 7: Asia Pacific Computer Vision Industry Revenue Share (%), by Country 2024 & 2032
- Figure 8: South America Computer Vision Industry Revenue (Million), by Country 2024 & 2032
- Figure 9: South America Computer Vision Industry Revenue Share (%), by Country 2024 & 2032
- Figure 10: North America Computer Vision Industry Revenue (Million), by Country 2024 & 2032
- Figure 11: North America Computer Vision Industry Revenue Share (%), by Country 2024 & 2032
- Figure 12: MEA Computer Vision Industry Revenue (Million), by Country 2024 & 2032
- Figure 13: MEA Computer Vision Industry Revenue Share (%), by Country 2024 & 2032
- Figure 14: North America Computer Vision Industry Revenue (Million), by Component 2024 & 2032
- Figure 15: North America Computer Vision Industry Revenue Share (%), by Component 2024 & 2032
- Figure 16: North America Computer Vision Industry Revenue (Million), by Product 2024 & 2032
- Figure 17: North America Computer Vision Industry Revenue Share (%), by Product 2024 & 2032
- Figure 18: North America Computer Vision Industry Revenue (Million), by End-user Industry 2024 & 2032
- Figure 19: North America Computer Vision Industry Revenue Share (%), by End-user Industry 2024 & 2032
- Figure 20: North America Computer Vision Industry Revenue (Million), by Country 2024 & 2032
- Figure 21: North America Computer Vision Industry Revenue Share (%), by Country 2024 & 2032
- Figure 22: Europe Computer Vision Industry Revenue (Million), by Component 2024 & 2032
- Figure 23: Europe Computer Vision Industry Revenue Share (%), by Component 2024 & 2032
- Figure 24: Europe Computer Vision Industry Revenue (Million), by Product 2024 & 2032
- Figure 25: Europe Computer Vision Industry Revenue Share (%), by Product 2024 & 2032
- Figure 26: Europe Computer Vision Industry Revenue (Million), by End-user Industry 2024 & 2032
- Figure 27: Europe Computer Vision Industry Revenue Share (%), by End-user Industry 2024 & 2032
- Figure 28: Europe Computer Vision Industry Revenue (Million), by Country 2024 & 2032
- Figure 29: Europe Computer Vision Industry Revenue Share (%), by Country 2024 & 2032
- Figure 30: Asia Computer Vision Industry Revenue (Million), by Component 2024 & 2032
- Figure 31: Asia Computer Vision Industry Revenue Share (%), by Component 2024 & 2032
- Figure 32: Asia Computer Vision Industry Revenue (Million), by Product 2024 & 2032
- Figure 33: Asia Computer Vision Industry Revenue Share (%), by Product 2024 & 2032
- Figure 34: Asia Computer Vision Industry Revenue (Million), by End-user Industry 2024 & 2032
- Figure 35: Asia Computer Vision Industry Revenue Share (%), by End-user Industry 2024 & 2032
- Figure 36: Asia Computer Vision Industry Revenue (Million), by Country 2024 & 2032
- Figure 37: Asia Computer Vision Industry Revenue Share (%), by Country 2024 & 2032
- Figure 38: Australia and New Zealand Computer Vision Industry Revenue (Million), by Component 2024 & 2032
- Figure 39: Australia and New Zealand Computer Vision Industry Revenue Share (%), by Component 2024 & 2032
- Figure 40: Australia and New Zealand Computer Vision Industry Revenue (Million), by Product 2024 & 2032
- Figure 41: Australia and New Zealand Computer Vision Industry Revenue Share (%), by Product 2024 & 2032
- Figure 42: Australia and New Zealand Computer Vision Industry Revenue (Million), by End-user Industry 2024 & 2032
- Figure 43: Australia and New Zealand Computer Vision Industry Revenue Share (%), by End-user Industry 2024 & 2032
- Figure 44: Australia and New Zealand Computer Vision Industry Revenue (Million), by Country 2024 & 2032
- Figure 45: Australia and New Zealand Computer Vision Industry Revenue Share (%), by Country 2024 & 2032
List of Tables
- Table 1: Global Computer Vision Industry Revenue Million Forecast, by Region 2019 & 2032
- Table 2: Global Computer Vision Industry Revenue Million Forecast, by Component 2019 & 2032
- Table 3: Global Computer Vision Industry Revenue Million Forecast, by Product 2019 & 2032
- Table 4: Global Computer Vision Industry Revenue Million Forecast, by End-user Industry 2019 & 2032
- Table 5: Global Computer Vision Industry Revenue Million Forecast, by Region 2019 & 2032
- Table 6: Global Computer Vision Industry Revenue Million Forecast, by Country 2019 & 2032
- Table 7: United States Computer Vision Industry Revenue (Million) Forecast, by Application 2019 & 2032
- Table 8: Canada Computer Vision Industry Revenue (Million) Forecast, by Application 2019 & 2032
- Table 9: Mexico Computer Vision Industry Revenue (Million) Forecast, by Application 2019 & 2032
- Table 10: Global Computer Vision Industry Revenue Million Forecast, by Country 2019 & 2032
- Table 11: Germany Computer Vision Industry Revenue (Million) Forecast, by Application 2019 & 2032
- Table 12: United Kingdom Computer Vision Industry Revenue (Million) Forecast, by Application 2019 & 2032
- Table 13: France Computer Vision Industry Revenue (Million) Forecast, by Application 2019 & 2032
- Table 14: Spain Computer Vision Industry Revenue (Million) Forecast, by Application 2019 & 2032
- Table 15: Italy Computer Vision Industry Revenue (Million) Forecast, by Application 2019 & 2032
- Table 16: Spain Computer Vision Industry Revenue (Million) Forecast, by Application 2019 & 2032
- Table 17: Belgium Computer Vision Industry Revenue (Million) Forecast, by Application 2019 & 2032
- Table 18: Netherland Computer Vision Industry Revenue (Million) Forecast, by Application 2019 & 2032
- Table 19: Nordics Computer Vision Industry Revenue (Million) Forecast, by Application 2019 & 2032
- Table 20: Rest of Europe Computer Vision Industry Revenue (Million) Forecast, by Application 2019 & 2032
- Table 21: Global Computer Vision Industry Revenue Million Forecast, by Country 2019 & 2032
- Table 22: China Computer Vision Industry Revenue (Million) Forecast, by Application 2019 & 2032
- Table 23: Japan Computer Vision Industry Revenue (Million) Forecast, by Application 2019 & 2032
- Table 24: India Computer Vision Industry Revenue (Million) Forecast, by Application 2019 & 2032
- Table 25: South Korea Computer Vision Industry Revenue (Million) Forecast, by Application 2019 & 2032
- Table 26: Southeast Asia Computer Vision Industry Revenue (Million) Forecast, by Application 2019 & 2032
- Table 27: Australia Computer Vision Industry Revenue (Million) Forecast, by Application 2019 & 2032
- Table 28: Indonesia Computer Vision Industry Revenue (Million) Forecast, by Application 2019 & 2032
- Table 29: Phillipes Computer Vision Industry Revenue (Million) Forecast, by Application 2019 & 2032
- Table 30: Singapore Computer Vision Industry Revenue (Million) Forecast, by Application 2019 & 2032
- Table 31: Thailandc Computer Vision Industry Revenue (Million) Forecast, by Application 2019 & 2032
- Table 32: Rest of Asia Pacific Computer Vision Industry Revenue (Million) Forecast, by Application 2019 & 2032
- Table 33: Global Computer Vision Industry Revenue Million Forecast, by Country 2019 & 2032
- Table 34: Brazil Computer Vision Industry Revenue (Million) Forecast, by Application 2019 & 2032
- Table 35: Argentina Computer Vision Industry Revenue (Million) Forecast, by Application 2019 & 2032
- Table 36: Peru Computer Vision Industry Revenue (Million) Forecast, by Application 2019 & 2032
- Table 37: Chile Computer Vision Industry Revenue (Million) Forecast, by Application 2019 & 2032
- Table 38: Colombia Computer Vision Industry Revenue (Million) Forecast, by Application 2019 & 2032
- Table 39: Ecuador Computer Vision Industry Revenue (Million) Forecast, by Application 2019 & 2032
- Table 40: Venezuela Computer Vision Industry Revenue (Million) Forecast, by Application 2019 & 2032
- Table 41: Rest of South America Computer Vision Industry Revenue (Million) Forecast, by Application 2019 & 2032
- Table 42: Global Computer Vision Industry Revenue Million Forecast, by Country 2019 & 2032
- Table 43: United States Computer Vision Industry Revenue (Million) Forecast, by Application 2019 & 2032
- Table 44: Canada Computer Vision Industry Revenue (Million) Forecast, by Application 2019 & 2032
- Table 45: Mexico Computer Vision Industry Revenue (Million) Forecast, by Application 2019 & 2032
- Table 46: Global Computer Vision Industry Revenue Million Forecast, by Country 2019 & 2032
- Table 47: United Arab Emirates Computer Vision Industry Revenue (Million) Forecast, by Application 2019 & 2032
- Table 48: Saudi Arabia Computer Vision Industry Revenue (Million) Forecast, by Application 2019 & 2032
- Table 49: South Africa Computer Vision Industry Revenue (Million) Forecast, by Application 2019 & 2032
- Table 50: Rest of Middle East and Africa Computer Vision Industry Revenue (Million) Forecast, by Application 2019 & 2032
- Table 51: Global Computer Vision Industry Revenue Million Forecast, by Component 2019 & 2032
- Table 52: Global Computer Vision Industry Revenue Million Forecast, by Product 2019 & 2032
- Table 53: Global Computer Vision Industry Revenue Million Forecast, by End-user Industry 2019 & 2032
- Table 54: Global Computer Vision Industry Revenue Million Forecast, by Country 2019 & 2032
- Table 55: United States Computer Vision Industry Revenue (Million) Forecast, by Application 2019 & 2032
- Table 56: Canada Computer Vision Industry Revenue (Million) Forecast, by Application 2019 & 2032
- Table 57: Global Computer Vision Industry Revenue Million Forecast, by Component 2019 & 2032
- Table 58: Global Computer Vision Industry Revenue Million Forecast, by Product 2019 & 2032
- Table 59: Global Computer Vision Industry Revenue Million Forecast, by End-user Industry 2019 & 2032
- Table 60: Global Computer Vision Industry Revenue Million Forecast, by Country 2019 & 2032
- Table 61: Germany Computer Vision Industry Revenue (Million) Forecast, by Application 2019 & 2032
- Table 62: United Kingdom Computer Vision Industry Revenue (Million) Forecast, by Application 2019 & 2032
- Table 63: France Computer Vision Industry Revenue (Million) Forecast, by Application 2019 & 2032
- Table 64: Italy Computer Vision Industry Revenue (Million) Forecast, by Application 2019 & 2032
- Table 65: Spain Computer Vision Industry Revenue (Million) Forecast, by Application 2019 & 2032
- Table 66: Global Computer Vision Industry Revenue Million Forecast, by Component 2019 & 2032
- Table 67: Global Computer Vision Industry Revenue Million Forecast, by Product 2019 & 2032
- Table 68: Global Computer Vision Industry Revenue Million Forecast, by End-user Industry 2019 & 2032
- Table 69: Global Computer Vision Industry Revenue Million Forecast, by Country 2019 & 2032
- Table 70: China Computer Vision Industry Revenue (Million) Forecast, by Application 2019 & 2032
- Table 71: Japan Computer Vision Industry Revenue (Million) Forecast, by Application 2019 & 2032
- Table 72: South Korea Computer Vision Industry Revenue (Million) Forecast, by Application 2019 & 2032
- Table 73: India Computer Vision Industry Revenue (Million) Forecast, by Application 2019 & 2032
- Table 74: Global Computer Vision Industry Revenue Million Forecast, by Component 2019 & 2032
- Table 75: Global Computer Vision Industry Revenue Million Forecast, by Product 2019 & 2032
- Table 76: Global Computer Vision Industry Revenue Million Forecast, by End-user Industry 2019 & 2032
- Table 77: Global Computer Vision Industry Revenue Million Forecast, by Country 2019 & 2032
Frequently Asked Questions
1. What is the projected Compound Annual Growth Rate (CAGR) of the Computer Vision Industry?
The projected CAGR is approximately 8.32%.
2. Which companies are prominent players in the Computer Vision Industry?
Key companies in the market include Keyence Corporation, IDS Imaging Development Systems GmbH (Paul Hartmann AG), MVTec Software GmbH, National Instruments Corporation (Emerson), Cognex Corporation, Teledyne DALSA (Teledyne Technologies Company), Isra Vision AG (Atlas Copco Group), Omron Corporation, Toshiba Corporation, Sony Group Corporation.
3. What are the main segments of the Computer Vision Industry?
The market segments include Component, Product, End-user Industry.
4. Can you provide details about the market size?
The market size is estimated to be USD 12.88 Million as of 2022.
5. What are some drivers contributing to market growth?
Rising Need for Quality Inspections; Increasing Demand for Vision-guided Robotic Systems.
6. What are the notable trends driving market growth?
Cameras to be the Largest Hardware Segment.
7. Are there any restraints impacting market growth?
Scarcity of Flexible Machine Vision Solutions.
8. Can you provide examples of recent developments in the market?
November 2023: Basler AG and MVTec Software GmbH partnered with Siemens to bring machine vision solutions directly to customers’ machines and systems. The new partnerships between Basler AG and Siemens enable customers to integrate machine vision apps directly into their automation technology. Siemens’ experience with industrial automation and digitization, combined with MVTec’s expertise in machine vision, reduces the complexity for customers. It significantly reduces the barrier to entry for machine vision solutions.
9. What pricing options are available for accessing the report?
Pricing options include single-user, multi-user, and enterprise licenses priced at USD 4750, USD 5250, and USD 8750 respectively.
10. Is the market size provided in terms of value or volume?
The market size is provided in terms of value, measured in Million.
11. Are there any specific market keywords associated with the report?
Yes, the market keyword associated with the report is "Computer Vision Industry," which aids in identifying and referencing the specific market segment covered.
12. How do I determine which pricing option suits my needs best?
The pricing options vary based on user requirements and access needs. Individual users may opt for single-user licenses, while businesses requiring broader access may choose multi-user or enterprise licenses for cost-effective access to the report.
13. Are there any additional resources or data provided in the Computer Vision Industry report?
While the report offers comprehensive insights, it's advisable to review the specific contents or supplementary materials provided to ascertain if additional resources or data are available.
14. How can I stay updated on further developments or reports in the Computer Vision Industry?
To stay informed about further developments, trends, and reports in the Computer Vision Industry, consider subscribing to industry newsletters, following relevant companies and organizations, or regularly checking reputable industry news sources and publications.
Methodology
Step 1 - Identification of Relevant Samples Size from Population Database


Step 2 - Approaches for Defining Global Market Size (Value, Volume* & Price*)

Note*: In applicable scenarios
Step 3 - Data Sources
Primary Research
- Web Analytics
- Survey Reports
- Research Institute
- Latest Research Reports
- Opinion Leaders
Secondary Research
- Annual Reports
- White Paper
- Latest Press Release
- Industry Association
- Paid Database
- Investor Presentations

Step 4 - Data Triangulation
Involves using different sources of information in order to increase the validity of a study
These sources are likely to be stakeholders in a program - participants, other researchers, program staff, other community members, and so on.
Then we put all data in single framework & apply various statistical tools to find out the dynamic on the market.
During the analysis stage, feedback from the stakeholder groups would be compared to determine areas of agreement as well as areas of divergence
