

Key Insights
The Connected TV (CTV) market is experiencing robust growth, projected to reach a substantial size by 2033. The market's expansion is fueled by several key factors. The increasing adoption of smart TVs with higher resolutions (4K, 8K, and Ultra HD) is a significant driver, offering consumers an enhanced viewing experience. The rise of streaming services and the consequent demand for convenient access to content through streaming media players like Amazon Fire TV, Apple TV, and Roku are further accelerating market growth. The proliferation of affordable smart TVs and streaming devices in emerging economies like India and China is also contributing significantly to the market expansion. Competition among established players like Samsung, LG, Sony, and newer entrants like Xiaomi is fostering innovation and driving down prices, making CTV technology more accessible to a wider consumer base. Furthermore, advancements in technologies like HDR (High Dynamic Range) and improved internet speeds are enhancing the overall CTV user experience, leading to increased adoption.
However, certain challenges remain. The market faces constraints related to the cost of high-resolution displays and the need for reliable high-speed internet access, particularly in less developed regions. The ongoing evolution of streaming technology and the emergence of new platforms also present challenges for manufacturers and content providers alike. Nonetheless, the overall trend indicates a continued positive outlook for the CTV market, driven by ongoing technological advancements and increasing consumer demand for high-quality, on-demand entertainment. The strategic partnerships between content providers and hardware manufacturers, along with ongoing innovations in user interfaces and personalized content recommendations, are further shaping the future of the CTV market.
This in-depth report provides a comprehensive analysis of the Connected TV market, encompassing market dynamics, growth trends, regional dominance, product landscape, key players, and future outlook. The study period covers 2019-2033, with 2025 as the base and estimated year. The forecast period is 2025-2033, and the historical period is 2019-2024. This report is essential for industry professionals seeking to understand and capitalize on the evolving landscape of the Connected TV market, encompassing both the Smart TV and Streaming Media Player segments.
Connected TV Market Market Dynamics & Structure
The Connected TV market exhibits a dynamic interplay of factors influencing its structure and growth. Market concentration is moderate, with key players like Samsung, LG, and Sony holding significant shares, but a diverse range of manufacturers and streaming service providers contributing to a competitive landscape. Technological innovation, particularly in display resolution (4K, 8K, OLED), processing power, and smart features, is a major driver. Regulatory frameworks concerning data privacy and content accessibility also shape market dynamics. The rise of streaming services acts as a significant competitive substitute for traditional broadcast television. End-user demographics are expanding, with younger generations demonstrating higher adoption rates. Furthermore, M&A activity within the industry is moderate, with strategic acquisitions aiming to expand product portfolios and technological capabilities.
- Market Concentration: Moderate, with top players holding xx% market share.
- Technological Innovation: Rapid advancements in display technology, processing power, and smart features.
- Regulatory Frameworks: Data privacy regulations and content licensing impact market strategies.
- Competitive Substitutes: Streaming services pose a major challenge to traditional television.
- End-User Demographics: Younger generations are key drivers of adoption.
- M&A Activity: xx major deals in the past 5 years, focused on technology and content acquisitions.
Connected TV Market Growth Trends & Insights
The Connected TV market has experienced significant growth throughout the historical period, driven by increased internet penetration, affordability of smart TVs, and the rise of streaming services. The market size has grown from xx million units in 2019 to xx million units in 2024, exhibiting a Compound Annual Growth Rate (CAGR) of xx%. Adoption rates are particularly high in regions with robust internet infrastructure and disposable income. Technological disruptions, such as the transition to higher resolutions (4K, 8K) and the integration of AI-powered features, are shaping consumer preferences. Consumers are increasingly demanding seamless streaming experiences, personalized content recommendations, and voice-controlled functionalities. Market penetration continues to increase, with a projected xx% penetration rate by 2033. The shift toward connected devices is profoundly impacting consumer viewing habits, reducing reliance on traditional cable and satellite television.

Dominant Regions, Countries, or Segments in Connected TV Market
North America and Asia (particularly China) currently dominate the Connected TV market. North America benefits from high internet penetration, disposable incomes, and early adoption of smart technologies. China's massive population and rapidly growing middle class contribute significantly to market size. Within the segments, Smart TVs hold the largest market share, followed by Streaming Media Players. The growth of higher-resolution displays (4K, 8K) is a key driver within the Smart TV segment.
- North America: High adoption rates driven by high internet penetration and disposable income.
- Asia (China): Massive market size fueled by large population and growing middle class.
- Smart TVs: Dominates the market with a xx% share.
- Streaming Media Players: Significant growth expected due to increasing demand for streaming content.
- 4K and 8K Resolutions: Market share for 4K is rapidly increasing, with 8K adoption gradually growing.
Connected TV Market Product Landscape
The Connected TV market offers a diverse range of products, including smart TVs with varying screen sizes, resolutions (4K, 8K, OLED), and smart features, as well as streaming media players offering diverse content libraries and functionalities. Key innovations include improved picture quality, voice control, AI-powered features, and seamless integration with other smart home devices. These advancements enhance user experience and create unique selling propositions. Performance metrics focus on display resolution, processing speed, and user interface intuitiveness. The market is seeing a trend towards larger screen sizes and enhanced audio capabilities.
Key Drivers, Barriers & Challenges in Connected TV Market
Key Drivers:
- Increased Internet Penetration: Expanding internet access fuels the adoption of connected devices.
- Rise of Streaming Services: The abundance of on-demand content is a major driving factor.
- Technological Advancements: Higher resolutions and smart features enhance consumer appeal.
- Falling Prices of Smart TVs: Increased affordability makes the technology accessible to a wider audience.
Key Challenges:
- Supply Chain Disruptions: Global events can impact component availability and lead times. This can affect the production of xx million units per year, impacting market growth.
- Regulatory Hurdles: Data privacy and content licensing regulations pose challenges.
- Competition: Intense competition among manufacturers and streaming providers puts pressure on margins.
Emerging Opportunities in Connected TV Market
- Expansion in Developing Markets: Untapped potential exists in regions with growing internet penetration.
- Integration with Smart Home Ecosystems: Opportunities for seamless integration with other smart devices.
- Growth of Interactive Advertising: Innovative advertising models can generate new revenue streams.
- Personalized Content Experiences: AI-powered recommendations enhance viewer engagement.
Growth Accelerators in the Connected TV Market Industry
Technological advancements, strategic partnerships, and expansion into new markets are key growth accelerators. The development of more energy-efficient displays, the integration of advanced AI features, and the expansion into emerging markets like Africa and Latin America will be crucial in driving long-term growth. Strategic partnerships between manufacturers and content providers create mutually beneficial ecosystems.
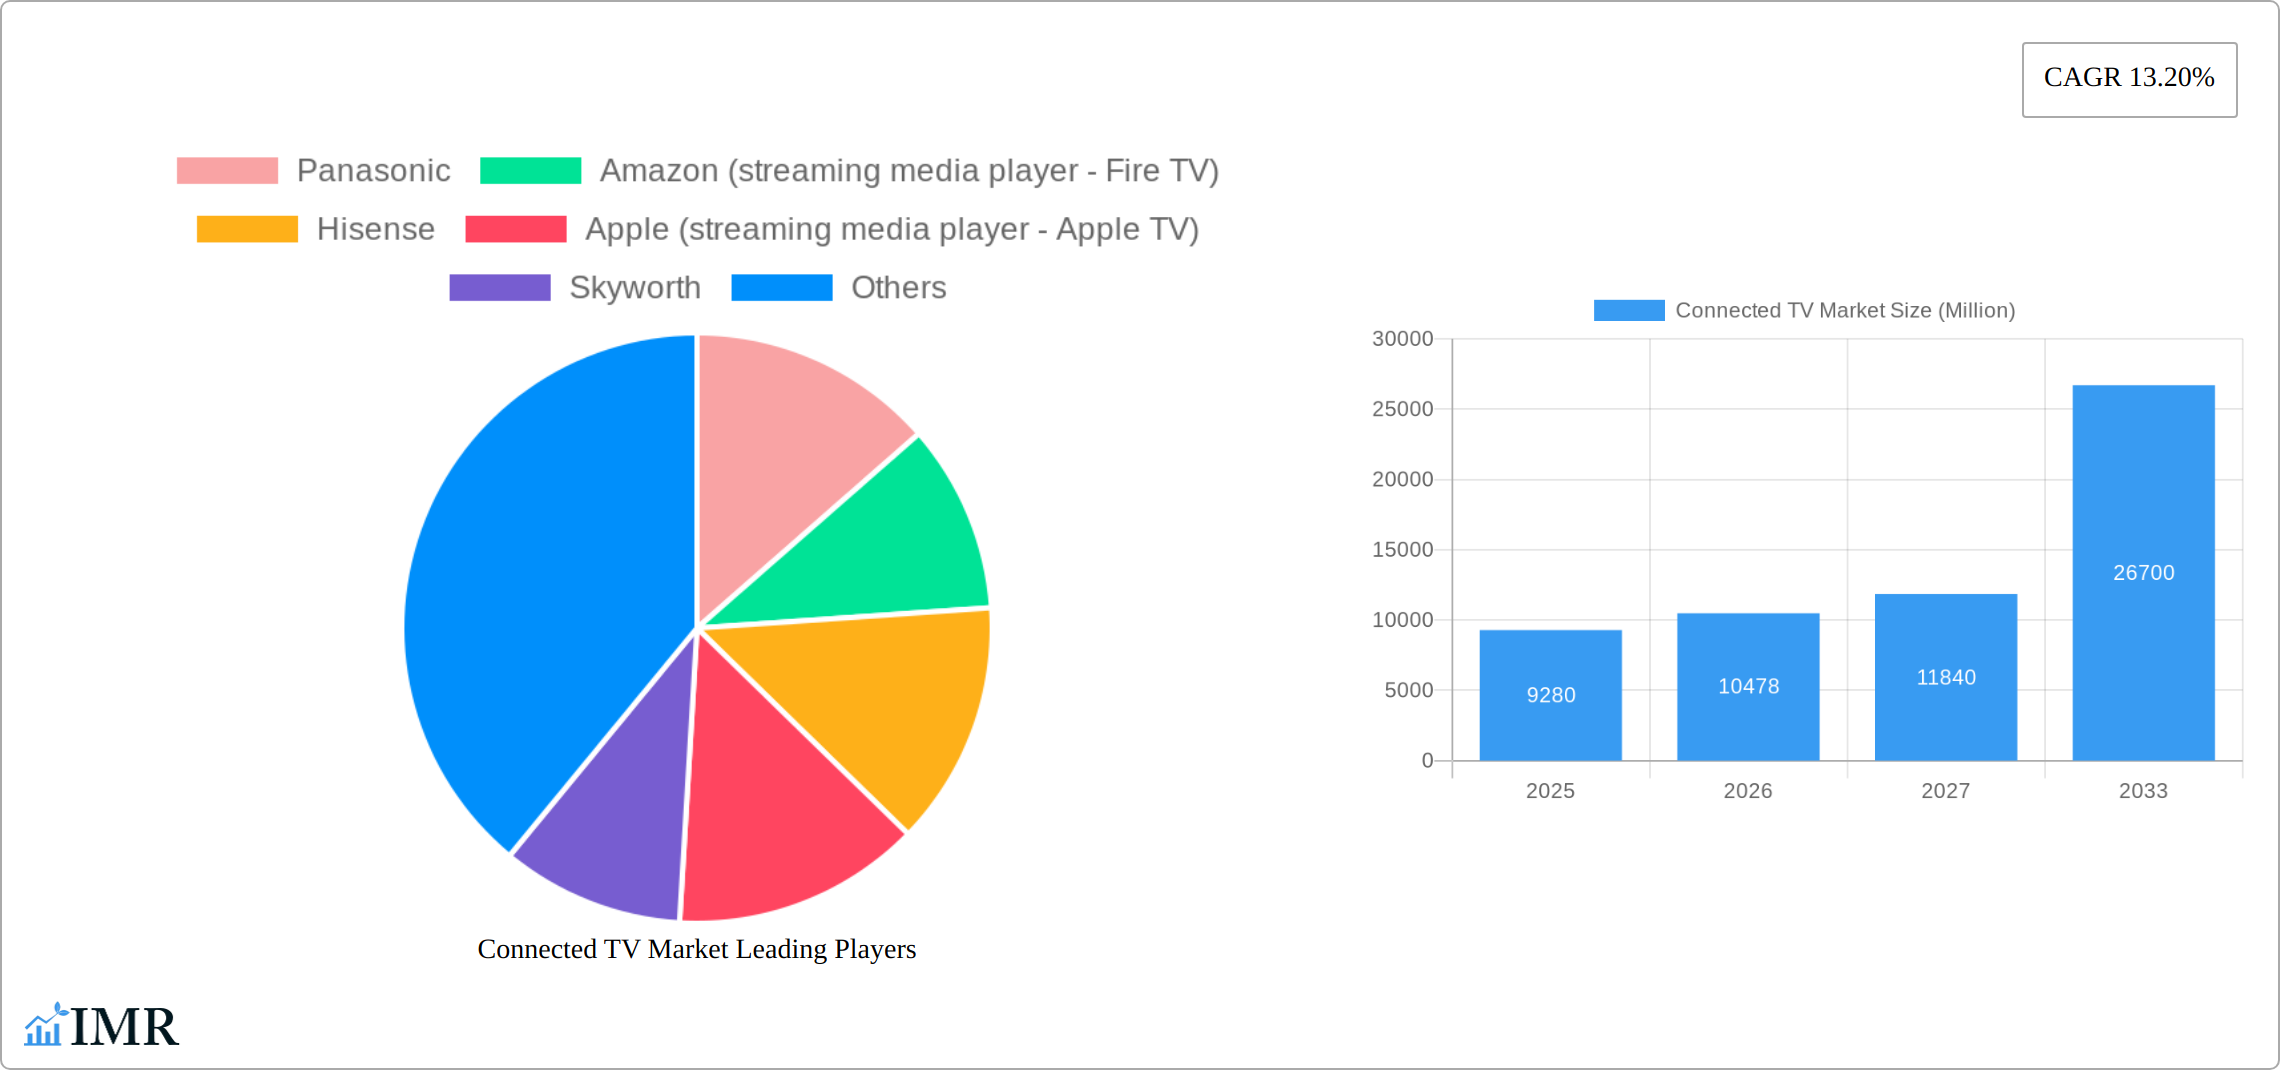
Key Players Shaping the Connected TV Market Market
- Panasonic
- Amazon (streaming media player - Fire TV)
- Hisense
- Apple (streaming media player - Apple TV)
- Skyworth
- Google (Chromecast)
- Sharp Electronics
- Xiaomi Corporation
- TCL
- Haier Group
- Vizio Inc
- Roku (streaming media player - Roku)
- Samsung Corporation
- LG Electronics
- Sony Corporation
Notable Milestones in Connected TV Market Sector
- May 2023: Blaupunkt and Flipkart partnered to launch the 40-inch Android TV Sigma series.
- May 2023: Hisense launched its ULED X and U8 TV products in the UAE, increasing brand awareness by 25 percentage points.
- November 2022: Samsung launched the Samsung Crystal 55AU7700 55-inch 4K Smart LED TV in India.
In-Depth Connected TV Market Market Outlook
The Connected TV market is poised for continued growth, driven by technological innovation, increasing internet penetration, and shifting consumer preferences. Opportunities exist in expanding into new markets, integrating with smart home ecosystems, and developing innovative advertising models. Strategic partnerships and investments in R&D will be crucial for companies to capitalize on future market potential. The market is expected to reach xx million units by 2033.
Connected TV Market Segmentation
-
1. Device
-
1.1. Smart TV
- 1.1.1. Smart TV
- 1.1.2. Smart TV
- 1.1.3. Key shif
- 1.2. Streamin
-
1.1. Smart TV
Connected TV Market Segmentation By Geography
-
1. North America
- 1.1. United States
- 1.2. Canada
-
2. Europe
- 2.1. United Kingdom
- 2.2. Germany
- 2.3. France
-
3. Asia
- 3.1. China
- 3.2. India
- 3.3. Japan
- 3.4. Australia and New Zealand
- 4. Latin America
- 5. Middle East and Africa

Connected TV Market REPORT HIGHLIGHTS
| Aspects | Details |
|---|---|
| Study Period | 2019-2033 |
| Base Year | 2024 |
| Estimated Year | 2025 |
| Forecast Period | 2025-2033 |
| Historical Period | 2019-2024 |
| Growth Rate | CAGR of 13.20% from 2019-2033 |
| Segmentation |
|
Table of Contents
- 1. Introduction
- 1.1. Research Scope
- 1.2. Market Segmentation
- 1.3. Research Methodology
- 1.4. Definitions and Assumptions
- 2. Executive Summary
- 2.1. Introduction
- 3. Market Dynamics
- 3.1. Introduction
- 3.2. Market Drivers
- 3.2.1. Growing internet penetration and anticipated shift from conventional TVs; Industry collaborations and favorable market conditions (shift from internet TV to smart TV)
- 3.3. Market Restrains
- 3.3.1. The Need for High Investment in Content Creation and Broadcasting; Bandwidth Allocation for 4K Resolution
- 3.4. Market Trends
- 3.4.1. Smart TV Accounts for the Largest Market Share
- 4. Market Factor Analysis
- 4.1. Porters Five Forces
- 4.2. Supply/Value Chain
- 4.3. PESTEL analysis
- 4.4. Market Entropy
- 4.5. Patent/Trademark Analysis
- 5. Global Connected TV Market Analysis, Insights and Forecast, 2019-2031
- 5.1. Market Analysis, Insights and Forecast - by Device
- 5.1.1. Smart TV
- 5.1.1.1. Smart TV
- 5.1.1.2. Smart TV
- 5.1.1.3. Key shif
- 5.1.2. Streamin
- 5.1.1. Smart TV
- 5.2. Market Analysis, Insights and Forecast - by Region
- 5.2.1. North America
- 5.2.2. Europe
- 5.2.3. Asia
- 5.2.4. Latin America
- 5.2.5. Middle East and Africa
- 5.1. Market Analysis, Insights and Forecast - by Device
- 6. North America Connected TV Market Analysis, Insights and Forecast, 2019-2031
- 6.1. Market Analysis, Insights and Forecast - by Device
- 6.1.1. Smart TV
- 6.1.1.1. Smart TV
- 6.1.1.2. Smart TV
- 6.1.1.3. Key shif
- 6.1.2. Streamin
- 6.1.1. Smart TV
- 6.1. Market Analysis, Insights and Forecast - by Device
- 7. Europe Connected TV Market Analysis, Insights and Forecast, 2019-2031
- 7.1. Market Analysis, Insights and Forecast - by Device
- 7.1.1. Smart TV
- 7.1.1.1. Smart TV
- 7.1.1.2. Smart TV
- 7.1.1.3. Key shif
- 7.1.2. Streamin
- 7.1.1. Smart TV
- 7.1. Market Analysis, Insights and Forecast - by Device
- 8. Asia Connected TV Market Analysis, Insights and Forecast, 2019-2031
- 8.1. Market Analysis, Insights and Forecast - by Device
- 8.1.1. Smart TV
- 8.1.1.1. Smart TV
- 8.1.1.2. Smart TV
- 8.1.1.3. Key shif
- 8.1.2. Streamin
- 8.1.1. Smart TV
- 8.1. Market Analysis, Insights and Forecast - by Device
- 9. Latin America Connected TV Market Analysis, Insights and Forecast, 2019-2031
- 9.1. Market Analysis, Insights and Forecast - by Device
- 9.1.1. Smart TV
- 9.1.1.1. Smart TV
- 9.1.1.2. Smart TV
- 9.1.1.3. Key shif
- 9.1.2. Streamin
- 9.1.1. Smart TV
- 9.1. Market Analysis, Insights and Forecast - by Device
- 10. Middle East and Africa Connected TV Market Analysis, Insights and Forecast, 2019-2031
- 10.1. Market Analysis, Insights and Forecast - by Device
- 10.1.1. Smart TV
- 10.1.1.1. Smart TV
- 10.1.1.2. Smart TV
- 10.1.1.3. Key shif
- 10.1.2. Streamin
- 10.1.1. Smart TV
- 10.1. Market Analysis, Insights and Forecast - by Device
- 11. North America Connected TV Market Analysis, Insights and Forecast, 2019-2031
- 11.1. Market Analysis, Insights and Forecast - By Country/Sub-region
- 11.1.1 United States
- 11.1.2 Canada
- 12. Europe Connected TV Market Analysis, Insights and Forecast, 2019-2031
- 12.1. Market Analysis, Insights and Forecast - By Country/Sub-region
- 12.1.1 United Kingdom
- 12.1.2 Germany
- 12.1.3 France
- 12.1.4 Rest of Europe
- 13. Asia Pacific Connected TV Market Analysis, Insights and Forecast, 2019-2031
- 13.1. Market Analysis, Insights and Forecast - By Country/Sub-region
- 13.1.1 China
- 13.1.2 India
- 13.1.3 Japan
- 13.1.4 Rest of Asia Pacific
- 14. Latin America Connected TV Market Analysis, Insights and Forecast, 2019-2031
- 14.1. Market Analysis, Insights and Forecast - By Country/Sub-region
- 14.1.1.
- 15. Middle East and Africa Connected TV Market Analysis, Insights and Forecast, 2019-2031
- 15.1. Market Analysis, Insights and Forecast - By Country/Sub-region
- 15.1.1.
- 16. Competitive Analysis
- 16.1. Global Market Share Analysis 2024
- 16.2. Company Profiles
- 16.2.1 Panasonic
- 16.2.1.1. Overview
- 16.2.1.2. Products
- 16.2.1.3. SWOT Analysis
- 16.2.1.4. Recent Developments
- 16.2.1.5. Financials (Based on Availability)
- 16.2.2 Amazon (streaming media player - Fire TV)
- 16.2.2.1. Overview
- 16.2.2.2. Products
- 16.2.2.3. SWOT Analysis
- 16.2.2.4. Recent Developments
- 16.2.2.5. Financials (Based on Availability)
- 16.2.3 Hisense
- 16.2.3.1. Overview
- 16.2.3.2. Products
- 16.2.3.3. SWOT Analysis
- 16.2.3.4. Recent Developments
- 16.2.3.5. Financials (Based on Availability)
- 16.2.4 Apple (streaming media player - Apple TV)
- 16.2.4.1. Overview
- 16.2.4.2. Products
- 16.2.4.3. SWOT Analysis
- 16.2.4.4. Recent Developments
- 16.2.4.5. Financials (Based on Availability)
- 16.2.5 Skyworth
- 16.2.5.1. Overview
- 16.2.5.2. Products
- 16.2.5.3. SWOT Analysis
- 16.2.5.4. Recent Developments
- 16.2.5.5. Financials (Based on Availability)
- 16.2.6 Google (Chromecast)*List Not Exhaustive
- 16.2.6.1. Overview
- 16.2.6.2. Products
- 16.2.6.3. SWOT Analysis
- 16.2.6.4. Recent Developments
- 16.2.6.5. Financials (Based on Availability)
- 16.2.7 Sharp Electronics
- 16.2.7.1. Overview
- 16.2.7.2. Products
- 16.2.7.3. SWOT Analysis
- 16.2.7.4. Recent Developments
- 16.2.7.5. Financials (Based on Availability)
- 16.2.8 Xiaomi Corporation
- 16.2.8.1. Overview
- 16.2.8.2. Products
- 16.2.8.3. SWOT Analysis
- 16.2.8.4. Recent Developments
- 16.2.8.5. Financials (Based on Availability)
- 16.2.9 TCL
- 16.2.9.1. Overview
- 16.2.9.2. Products
- 16.2.9.3. SWOT Analysis
- 16.2.9.4. Recent Developments
- 16.2.9.5. Financials (Based on Availability)
- 16.2.10 Haier Group
- 16.2.10.1. Overview
- 16.2.10.2. Products
- 16.2.10.3. SWOT Analysis
- 16.2.10.4. Recent Developments
- 16.2.10.5. Financials (Based on Availability)
- 16.2.11 Vizio Inc
- 16.2.11.1. Overview
- 16.2.11.2. Products
- 16.2.11.3. SWOT Analysis
- 16.2.11.4. Recent Developments
- 16.2.11.5. Financials (Based on Availability)
- 16.2.12 Roku (streaming media player - Roku)
- 16.2.12.1. Overview
- 16.2.12.2. Products
- 16.2.12.3. SWOT Analysis
- 16.2.12.4. Recent Developments
- 16.2.12.5. Financials (Based on Availability)
- 16.2.13 Samsung Corporation
- 16.2.13.1. Overview
- 16.2.13.2. Products
- 16.2.13.3. SWOT Analysis
- 16.2.13.4. Recent Developments
- 16.2.13.5. Financials (Based on Availability)
- 16.2.14 LG Electronics
- 16.2.14.1. Overview
- 16.2.14.2. Products
- 16.2.14.3. SWOT Analysis
- 16.2.14.4. Recent Developments
- 16.2.14.5. Financials (Based on Availability)
- 16.2.15 Sony Corporation
- 16.2.15.1. Overview
- 16.2.15.2. Products
- 16.2.15.3. SWOT Analysis
- 16.2.15.4. Recent Developments
- 16.2.15.5. Financials (Based on Availability)
- 16.2.1 Panasonic
List of Figures
- Figure 1: Global Connected TV Market Revenue Breakdown (Million, %) by Region 2024 & 2032
- Figure 2: North America Connected TV Market Revenue (Million), by Country 2024 & 2032
- Figure 3: North America Connected TV Market Revenue Share (%), by Country 2024 & 2032
- Figure 4: Europe Connected TV Market Revenue (Million), by Country 2024 & 2032
- Figure 5: Europe Connected TV Market Revenue Share (%), by Country 2024 & 2032
- Figure 6: Asia Pacific Connected TV Market Revenue (Million), by Country 2024 & 2032
- Figure 7: Asia Pacific Connected TV Market Revenue Share (%), by Country 2024 & 2032
- Figure 8: Latin America Connected TV Market Revenue (Million), by Country 2024 & 2032
- Figure 9: Latin America Connected TV Market Revenue Share (%), by Country 2024 & 2032
- Figure 10: Middle East and Africa Connected TV Market Revenue (Million), by Country 2024 & 2032
- Figure 11: Middle East and Africa Connected TV Market Revenue Share (%), by Country 2024 & 2032
- Figure 12: North America Connected TV Market Revenue (Million), by Device 2024 & 2032
- Figure 13: North America Connected TV Market Revenue Share (%), by Device 2024 & 2032
- Figure 14: North America Connected TV Market Revenue (Million), by Country 2024 & 2032
- Figure 15: North America Connected TV Market Revenue Share (%), by Country 2024 & 2032
- Figure 16: Europe Connected TV Market Revenue (Million), by Device 2024 & 2032
- Figure 17: Europe Connected TV Market Revenue Share (%), by Device 2024 & 2032
- Figure 18: Europe Connected TV Market Revenue (Million), by Country 2024 & 2032
- Figure 19: Europe Connected TV Market Revenue Share (%), by Country 2024 & 2032
- Figure 20: Asia Connected TV Market Revenue (Million), by Device 2024 & 2032
- Figure 21: Asia Connected TV Market Revenue Share (%), by Device 2024 & 2032
- Figure 22: Asia Connected TV Market Revenue (Million), by Country 2024 & 2032
- Figure 23: Asia Connected TV Market Revenue Share (%), by Country 2024 & 2032
- Figure 24: Latin America Connected TV Market Revenue (Million), by Device 2024 & 2032
- Figure 25: Latin America Connected TV Market Revenue Share (%), by Device 2024 & 2032
- Figure 26: Latin America Connected TV Market Revenue (Million), by Country 2024 & 2032
- Figure 27: Latin America Connected TV Market Revenue Share (%), by Country 2024 & 2032
- Figure 28: Middle East and Africa Connected TV Market Revenue (Million), by Device 2024 & 2032
- Figure 29: Middle East and Africa Connected TV Market Revenue Share (%), by Device 2024 & 2032
- Figure 30: Middle East and Africa Connected TV Market Revenue (Million), by Country 2024 & 2032
- Figure 31: Middle East and Africa Connected TV Market Revenue Share (%), by Country 2024 & 2032
List of Tables
- Table 1: Global Connected TV Market Revenue Million Forecast, by Region 2019 & 2032
- Table 2: Global Connected TV Market Revenue Million Forecast, by Device 2019 & 2032
- Table 3: Global Connected TV Market Revenue Million Forecast, by Region 2019 & 2032
- Table 4: Global Connected TV Market Revenue Million Forecast, by Country 2019 & 2032
- Table 5: United States Connected TV Market Revenue (Million) Forecast, by Application 2019 & 2032
- Table 6: Canada Connected TV Market Revenue (Million) Forecast, by Application 2019 & 2032
- Table 7: Global Connected TV Market Revenue Million Forecast, by Country 2019 & 2032
- Table 8: United Kingdom Connected TV Market Revenue (Million) Forecast, by Application 2019 & 2032
- Table 9: Germany Connected TV Market Revenue (Million) Forecast, by Application 2019 & 2032
- Table 10: France Connected TV Market Revenue (Million) Forecast, by Application 2019 & 2032
- Table 11: Rest of Europe Connected TV Market Revenue (Million) Forecast, by Application 2019 & 2032
- Table 12: Global Connected TV Market Revenue Million Forecast, by Country 2019 & 2032
- Table 13: China Connected TV Market Revenue (Million) Forecast, by Application 2019 & 2032
- Table 14: India Connected TV Market Revenue (Million) Forecast, by Application 2019 & 2032
- Table 15: Japan Connected TV Market Revenue (Million) Forecast, by Application 2019 & 2032
- Table 16: Rest of Asia Pacific Connected TV Market Revenue (Million) Forecast, by Application 2019 & 2032
- Table 17: Global Connected TV Market Revenue Million Forecast, by Country 2019 & 2032
- Table 18: Connected TV Market Revenue (Million) Forecast, by Application 2019 & 2032
- Table 19: Global Connected TV Market Revenue Million Forecast, by Country 2019 & 2032
- Table 20: Connected TV Market Revenue (Million) Forecast, by Application 2019 & 2032
- Table 21: Global Connected TV Market Revenue Million Forecast, by Device 2019 & 2032
- Table 22: Global Connected TV Market Revenue Million Forecast, by Country 2019 & 2032
- Table 23: United States Connected TV Market Revenue (Million) Forecast, by Application 2019 & 2032
- Table 24: Canada Connected TV Market Revenue (Million) Forecast, by Application 2019 & 2032
- Table 25: Global Connected TV Market Revenue Million Forecast, by Device 2019 & 2032
- Table 26: Global Connected TV Market Revenue Million Forecast, by Country 2019 & 2032
- Table 27: United Kingdom Connected TV Market Revenue (Million) Forecast, by Application 2019 & 2032
- Table 28: Germany Connected TV Market Revenue (Million) Forecast, by Application 2019 & 2032
- Table 29: France Connected TV Market Revenue (Million) Forecast, by Application 2019 & 2032
- Table 30: Global Connected TV Market Revenue Million Forecast, by Device 2019 & 2032
- Table 31: Global Connected TV Market Revenue Million Forecast, by Country 2019 & 2032
- Table 32: China Connected TV Market Revenue (Million) Forecast, by Application 2019 & 2032
- Table 33: India Connected TV Market Revenue (Million) Forecast, by Application 2019 & 2032
- Table 34: Japan Connected TV Market Revenue (Million) Forecast, by Application 2019 & 2032
- Table 35: Australia and New Zealand Connected TV Market Revenue (Million) Forecast, by Application 2019 & 2032
- Table 36: Global Connected TV Market Revenue Million Forecast, by Device 2019 & 2032
- Table 37: Global Connected TV Market Revenue Million Forecast, by Country 2019 & 2032
- Table 38: Global Connected TV Market Revenue Million Forecast, by Device 2019 & 2032
- Table 39: Global Connected TV Market Revenue Million Forecast, by Country 2019 & 2032
Frequently Asked Questions
1. What is the projected Compound Annual Growth Rate (CAGR) of the Connected TV Market?
The projected CAGR is approximately 13.20%.
2. Which companies are prominent players in the Connected TV Market?
Key companies in the market include Panasonic, Amazon (streaming media player - Fire TV), Hisense, Apple (streaming media player - Apple TV), Skyworth, Google (Chromecast)*List Not Exhaustive, Sharp Electronics, Xiaomi Corporation, TCL, Haier Group, Vizio Inc, Roku (streaming media player - Roku), Samsung Corporation, LG Electronics, Sony Corporation.
3. What are the main segments of the Connected TV Market?
The market segments include Device.
4. Can you provide details about the market size?
The market size is estimated to be USD 9.28 Million as of 2022.
5. What are some drivers contributing to market growth?
Growing internet penetration and anticipated shift from conventional TVs; Industry collaborations and favorable market conditions (shift from internet TV to smart TV).
6. What are the notable trends driving market growth?
Smart TV Accounts for the Largest Market Share.
7. Are there any restraints impacting market growth?
The Need for High Investment in Content Creation and Broadcasting; Bandwidth Allocation for 4K Resolution.
8. Can you provide examples of recent developments in the market?
May 2023: Blaupunkt and Flipkart announced a partnership to launch the 40-inch Android TV Sigma series. The new Blaupunkt Sigma Series Android TV has a bezel-less design, 512 MB RAM, 4 GB ROM, two bottom-firing built-in speakers with surround sound technology, and 3 HDMI and 2 USB ports.
9. What pricing options are available for accessing the report?
Pricing options include single-user, multi-user, and enterprise licenses priced at USD 4750, USD 5250, and USD 8750 respectively.
10. Is the market size provided in terms of value or volume?
The market size is provided in terms of value, measured in Million.
11. Are there any specific market keywords associated with the report?
Yes, the market keyword associated with the report is "Connected TV Market," which aids in identifying and referencing the specific market segment covered.
12. How do I determine which pricing option suits my needs best?
The pricing options vary based on user requirements and access needs. Individual users may opt for single-user licenses, while businesses requiring broader access may choose multi-user or enterprise licenses for cost-effective access to the report.
13. Are there any additional resources or data provided in the Connected TV Market report?
While the report offers comprehensive insights, it's advisable to review the specific contents or supplementary materials provided to ascertain if additional resources or data are available.
14. How can I stay updated on further developments or reports in the Connected TV Market?
To stay informed about further developments, trends, and reports in the Connected TV Market, consider subscribing to industry newsletters, following relevant companies and organizations, or regularly checking reputable industry news sources and publications.
Methodology
Step 1 - Identification of Relevant Samples Size from Population Database


Step 2 - Approaches for Defining Global Market Size (Value, Volume* & Price*)

Note*: In applicable scenarios
Step 3 - Data Sources
Primary Research
- Web Analytics
- Survey Reports
- Research Institute
- Latest Research Reports
- Opinion Leaders
Secondary Research
- Annual Reports
- White Paper
- Latest Press Release
- Industry Association
- Paid Database
- Investor Presentations

Step 4 - Data Triangulation
Involves using different sources of information in order to increase the validity of a study
These sources are likely to be stakeholders in a program - participants, other researchers, program staff, other community members, and so on.
Then we put all data in single framework & apply various statistical tools to find out the dynamic on the market.
During the analysis stage, feedback from the stakeholder groups would be compared to determine areas of agreement as well as areas of divergence
