

Key Insights
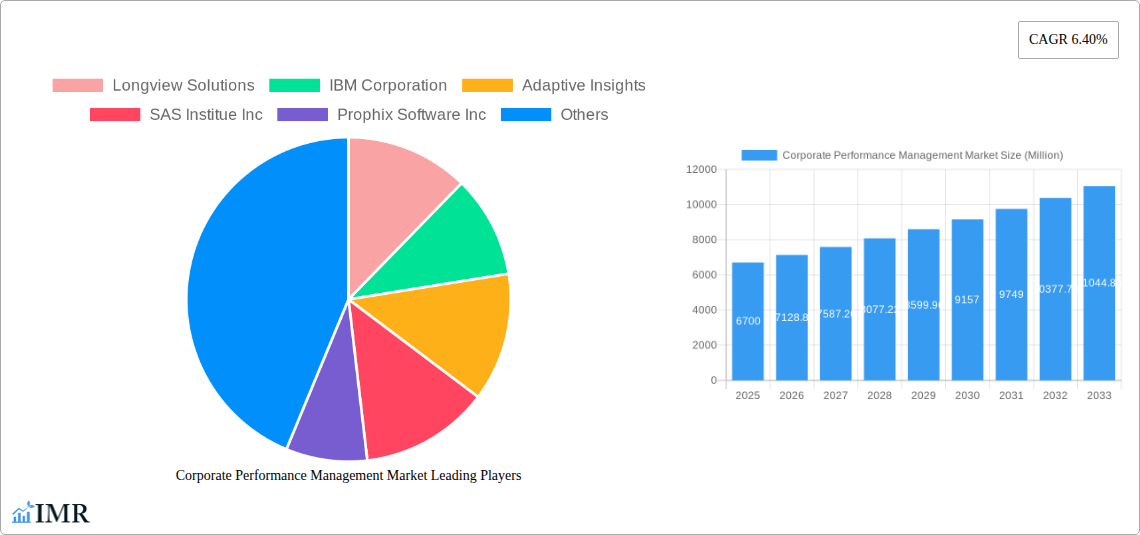
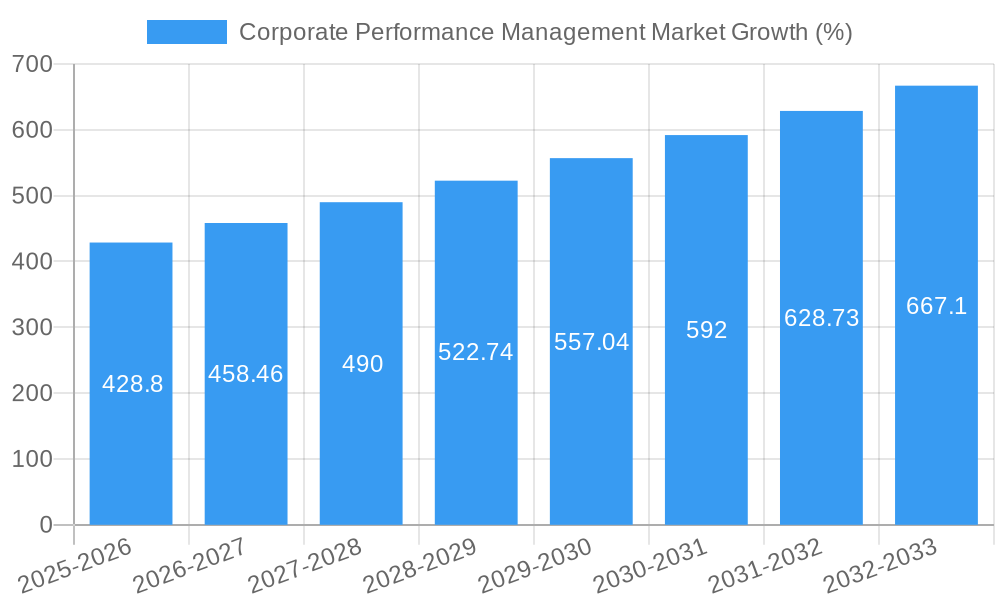
The Corporate Performance Management (CPM) market, valued at $6.70 billion in 2025, is projected to experience robust growth, driven by increasing demand for data-driven decision-making and the need for enhanced operational efficiency across various industries. The market's Compound Annual Growth Rate (CAGR) of 6.40% from 2025 to 2033 indicates a significant expansion potential. Key drivers include the growing adoption of cloud-based CPM solutions, offering scalability and cost-effectiveness, coupled with the increasing complexity of business operations requiring sophisticated performance monitoring and analysis tools. Furthermore, the rise of advanced analytics capabilities integrated within CPM platforms empowers businesses to gain deeper insights into their performance, enabling proactive adjustments to strategies and improved resource allocation. The market is segmented by deployment mode (on-premises and cloud), organization size (SMEs and large enterprises), and end-user industry (retail, BFSI, manufacturing, energy and power, and others). The cloud deployment segment is expected to dominate due to its flexibility and accessibility. Large enterprises are likely to represent a larger portion of the market owing to their higher investment capacity and greater need for comprehensive performance management solutions. Competition among established players like IBM, Oracle, and SAP, alongside emerging specialized vendors, fuels innovation and caters to diverse market requirements.
The sustained growth trajectory of the CPM market is also influenced by several key trends. These include the increasing adoption of artificial intelligence (AI) and machine learning (ML) for predictive analytics within CPM systems, improving forecasting accuracy and operational optimization. Furthermore, the integration of CPM solutions with other enterprise resource planning (ERP) and business intelligence (BI) systems is enhancing data consolidation and creating a holistic view of organizational performance. While the market faces certain restraints, such as the high initial investment cost for implementing CPM solutions and the need for skilled personnel to effectively manage and interpret the data generated, these challenges are expected to be outweighed by the significant benefits offered by enhanced performance management. Geographic expansion, particularly in emerging markets of Asia and the Middle East and Africa, presents additional growth opportunities for CPM vendors. The ongoing focus on improving business agility and resilience against economic fluctuations further solidifies the importance and ongoing growth of the CPM market.
Corporate Performance Management (CPM) Market: A Comprehensive Report (2019-2033)
This comprehensive report provides an in-depth analysis of the Corporate Performance Management (CPM) market, encompassing market dynamics, growth trends, regional segmentation, product landscape, key players, and future outlook. The study covers the period 2019-2033, with 2025 as the base year and a forecast period of 2025-2033. The market is segmented by deployment mode (On-Premises, Cloud), organization size (Small and Medium Enterprises, Large Enterprises), and end-user industry (Retail, BFSI, Manufacturing, Energy and Power, Other End-user Industries). The report offers invaluable insights for businesses, investors, and industry professionals seeking to understand and navigate this dynamic market. The market size is projected to reach xx Million by 2033.
Corporate Performance Management Market Market Dynamics & Structure
The Corporate Performance Management (CPM) market is characterized by a moderately consolidated landscape with key players such as IBM Corporation, Oracle Corporation, and SAP SE holding significant market share. However, the emergence of agile and innovative solutions from companies like Anaplan Inc. and Adaptive Insights is increasing competition. Technological advancements, particularly in cloud computing and AI, are major drivers of market growth, enabling real-time data analysis and improved decision-making. Regulatory compliance requirements, especially in BFSI and other heavily regulated industries, are also influencing CPM adoption. The market witnesses continuous mergers and acquisitions (M&A) activity, with an estimated xx M&A deals in the historical period (2019-2024). Innovation barriers include the high cost of implementation, integration complexities, and the need for specialized expertise.
- Market Concentration: Moderately consolidated, with top players holding xx% market share in 2025.
- Technological Innovation: Cloud computing, AI, and machine learning are key drivers.
- Regulatory Frameworks: Compliance requirements drive adoption, particularly in regulated sectors.
- Competitive Substitutes: Limited direct substitutes, but alternative BI tools pose some competition.
- End-User Demographics: Large enterprises dominate the market, but SME adoption is growing.
- M&A Trends: Significant M&A activity observed, with xx deals in 2019-2024, indicating market consolidation.
Corporate Performance Management Market Growth Trends & Insights
The CPM market exhibited a CAGR of xx% during the historical period (2019-2024) and is projected to maintain a CAGR of xx% during the forecast period (2025-2033). This growth is fueled by increasing demand for data-driven decision-making, the need for improved operational efficiency, and the rising adoption of cloud-based CPM solutions. Technological disruptions, such as the rise of advanced analytics and real-time dashboards, are transforming the market landscape. Consumer behavior is shifting towards more integrated and user-friendly CPM solutions that offer seamless integration with existing enterprise systems. Market penetration is currently at xx% and is expected to reach xx% by 2033. The shift towards cloud-based solutions is a key factor influencing market growth. The increased adoption of SaaS models is driving this trend, as it offers greater flexibility, scalability, and cost-effectiveness compared to on-premise solutions.
Dominant Regions, Countries, or Segments in Corporate Performance Management Market
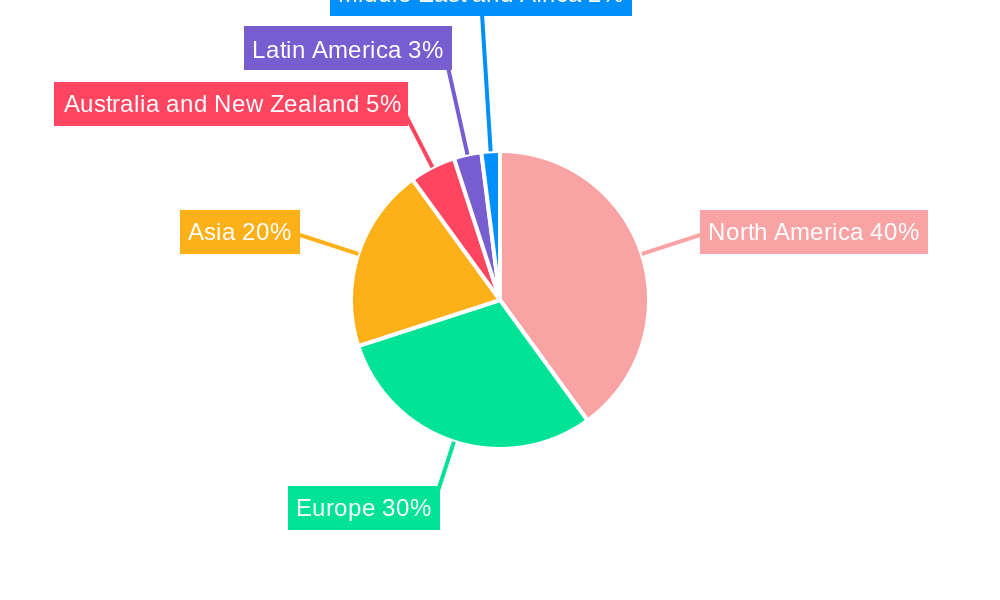
North America currently holds the largest market share, driven by high technology adoption, robust economic growth, and the presence of key market players. However, the Asia-Pacific region is expected to witness the fastest growth rate during the forecast period, fueled by increasing digitalization and economic expansion in countries like China and India. Within the segments, the Cloud deployment mode is experiencing significant growth due to its scalability, cost-effectiveness, and accessibility. Large enterprises constitute the largest segment by organization size, owing to their higher budgets and advanced technological requirements. The BFSI sector dominates end-user industries due to stringent regulatory compliance requirements and the need for robust risk management.
- Leading Region: North America (holds xx% market share in 2025)
- Fastest-Growing Region: Asia-Pacific (projected CAGR of xx% during 2025-2033)
- Dominant Deployment Mode: Cloud (projected to hold xx% market share by 2033)
- Largest Organization Size Segment: Large Enterprises (holds xx% market share in 2025)
- Leading End-User Industry: BFSI (holds xx% market share in 2025)
- Key Drivers: Economic growth, digital transformation, and regulatory compliance.
Corporate Performance Management Market Product Landscape
The CPM market offers a wide array of products, including budgeting and forecasting software, performance management dashboards, financial consolidation and reporting tools, and integrated business planning (IBP) solutions. Recent innovations focus on enhancing user experience, integrating AI-powered analytics, and providing real-time insights. Many solutions emphasize ease of use, data visualization, and seamless integration with other enterprise applications. Key features include advanced analytics, predictive modeling, and mobile accessibility.
Key Drivers, Barriers & Challenges in Corporate Performance Management Market
Key Drivers: Increased demand for data-driven decision-making, the need for improved operational efficiency, rising adoption of cloud-based solutions, and stringent regulatory compliance requirements are key drivers.
Challenges and Restraints: High implementation costs, integration complexities, lack of skilled professionals, and data security concerns are major challenges. Supply chain disruptions can impact the availability of software and services, and regulatory changes can necessitate costly system updates. Competitive pressures from both established players and new entrants also create significant challenges. The estimated impact of these challenges on market growth is xx% reduction in growth rate by 2033.
Emerging Opportunities in Corporate Performance Management Market
Emerging opportunities lie in the untapped potential of SMEs, the growing demand for specialized industry solutions, and the expansion of CPM applications beyond finance into other business functions. The increasing adoption of AI and machine learning opens up possibilities for predictive analytics and proactive decision-making. The integration of CPM with other enterprise applications, such as ERP and CRM systems, represents a significant growth opportunity.
Growth Accelerators in the Corporate Performance Management Market Industry
Technological breakthroughs in areas such as AI, machine learning, and cloud computing are driving market growth. Strategic partnerships between CPM vendors and other technology providers are creating innovative solutions. The expansion into new geographic markets and the development of industry-specific solutions are further accelerating market expansion.
Key Players Shaping the Corporate Performance Management Market Market
- Longview Solutions
- IBM Corporation
- Adaptive Insights
- SAS Institute Inc
- Prophix Software Inc
- Anaplan Inc
- Oracle Corporation
- Tagetik Software S.r.l
- Host Analytics
- Board International
- Axiom Software
- SAP SE
Notable Milestones in Corporate Performance Management Market Sector
- 2020-Q4: Anaplan Inc. launches a new AI-powered forecasting feature.
- 2021-Q2: IBM Corporation acquires a smaller CPM vendor, enhancing its product portfolio.
- 2022-Q3: Oracle Corporation releases a major update to its CPM suite with improved cloud integration.
- 2023-Q1: Several key players announce strategic partnerships to expand their market reach.
In-Depth Corporate Performance Management Market Market Outlook
The CPM market is poised for continued growth, driven by technological advancements and the increasing adoption of data-driven decision-making. Opportunities exist for vendors to focus on developing innovative solutions that leverage AI and machine learning to provide greater insights and improved efficiency. Strategic partnerships and expansion into new markets will be critical for success in this dynamic market. The market's future is bright, with significant potential for growth and innovation in the coming years.
Corporate Performance Management Market Segmentation
-
1. Mode of Deployment
- 1.1. On-Premises
- 1.2. Cloud
-
2. Size of Organization
- 2.1. Small and Medium Enterprises
- 2.2. Large Enterprises
-
3. End-user Industry
- 3.1. Retail
- 3.2. BFSI
- 3.3. Manufacturing
- 3.4. Energy and Power
- 3.5. Other End-user Industries
Corporate Performance Management Market Segmentation By Geography
- 1. North America
- 2. Europe
- 3. Asia
- 4. Australia and New Zealand
- 5. Latin America
- 6. Middle East and Africa
Corporate Performance Management Market REPORT HIGHLIGHTS
| Aspects | Details |
|---|---|
| Study Period | 2019-2033 |
| Base Year | 2024 |
| Estimated Year | 2025 |
| Forecast Period | 2025-2033 |
| Historical Period | 2019-2024 |
| Growth Rate | CAGR of 6.40% from 2019-2033 |
| Segmentation |
|
Table of Contents
- 1. Introduction
- 1.1. Research Scope
- 1.2. Market Segmentation
- 1.3. Research Methodology
- 1.4. Definitions and Assumptions
- 2. Executive Summary
- 2.1. Introduction
- 3. Market Dynamics
- 3.1. Introduction
- 3.2. Market Drivers
- 3.2.1. Proliferation of Data Driven Decision Making; Growing Focus on Organizational Compliance
- 3.3. Market Restrains
- 3.3.1. Rise of Cloud-based Cyber Threats
- 3.4. Market Trends
- 3.4.1. Cloud Segment is Expected to Hold a Significant Share of the Market
- 4. Market Factor Analysis
- 4.1. Porters Five Forces
- 4.2. Supply/Value Chain
- 4.3. PESTEL analysis
- 4.4. Market Entropy
- 4.5. Patent/Trademark Analysis
- 5. Global Corporate Performance Management Market Analysis, Insights and Forecast, 2019-2031
- 5.1. Market Analysis, Insights and Forecast - by Mode of Deployment
- 5.1.1. On-Premises
- 5.1.2. Cloud
- 5.2. Market Analysis, Insights and Forecast - by Size of Organization
- 5.2.1. Small and Medium Enterprises
- 5.2.2. Large Enterprises
- 5.3. Market Analysis, Insights and Forecast - by End-user Industry
- 5.3.1. Retail
- 5.3.2. BFSI
- 5.3.3. Manufacturing
- 5.3.4. Energy and Power
- 5.3.5. Other End-user Industries
- 5.4. Market Analysis, Insights and Forecast - by Region
- 5.4.1. North America
- 5.4.2. Europe
- 5.4.3. Asia
- 5.4.4. Australia and New Zealand
- 5.4.5. Latin America
- 5.4.6. Middle East and Africa
- 5.1. Market Analysis, Insights and Forecast - by Mode of Deployment
- 6. North America Corporate Performance Management Market Analysis, Insights and Forecast, 2019-2031
- 6.1. Market Analysis, Insights and Forecast - by Mode of Deployment
- 6.1.1. On-Premises
- 6.1.2. Cloud
- 6.2. Market Analysis, Insights and Forecast - by Size of Organization
- 6.2.1. Small and Medium Enterprises
- 6.2.2. Large Enterprises
- 6.3. Market Analysis, Insights and Forecast - by End-user Industry
- 6.3.1. Retail
- 6.3.2. BFSI
- 6.3.3. Manufacturing
- 6.3.4. Energy and Power
- 6.3.5. Other End-user Industries
- 6.1. Market Analysis, Insights and Forecast - by Mode of Deployment
- 7. Europe Corporate Performance Management Market Analysis, Insights and Forecast, 2019-2031
- 7.1. Market Analysis, Insights and Forecast - by Mode of Deployment
- 7.1.1. On-Premises
- 7.1.2. Cloud
- 7.2. Market Analysis, Insights and Forecast - by Size of Organization
- 7.2.1. Small and Medium Enterprises
- 7.2.2. Large Enterprises
- 7.3. Market Analysis, Insights and Forecast - by End-user Industry
- 7.3.1. Retail
- 7.3.2. BFSI
- 7.3.3. Manufacturing
- 7.3.4. Energy and Power
- 7.3.5. Other End-user Industries
- 7.1. Market Analysis, Insights and Forecast - by Mode of Deployment
- 8. Asia Corporate Performance Management Market Analysis, Insights and Forecast, 2019-2031
- 8.1. Market Analysis, Insights and Forecast - by Mode of Deployment
- 8.1.1. On-Premises
- 8.1.2. Cloud
- 8.2. Market Analysis, Insights and Forecast - by Size of Organization
- 8.2.1. Small and Medium Enterprises
- 8.2.2. Large Enterprises
- 8.3. Market Analysis, Insights and Forecast - by End-user Industry
- 8.3.1. Retail
- 8.3.2. BFSI
- 8.3.3. Manufacturing
- 8.3.4. Energy and Power
- 8.3.5. Other End-user Industries
- 8.1. Market Analysis, Insights and Forecast - by Mode of Deployment
- 9. Australia and New Zealand Corporate Performance Management Market Analysis, Insights and Forecast, 2019-2031
- 9.1. Market Analysis, Insights and Forecast - by Mode of Deployment
- 9.1.1. On-Premises
- 9.1.2. Cloud
- 9.2. Market Analysis, Insights and Forecast - by Size of Organization
- 9.2.1. Small and Medium Enterprises
- 9.2.2. Large Enterprises
- 9.3. Market Analysis, Insights and Forecast - by End-user Industry
- 9.3.1. Retail
- 9.3.2. BFSI
- 9.3.3. Manufacturing
- 9.3.4. Energy and Power
- 9.3.5. Other End-user Industries
- 9.1. Market Analysis, Insights and Forecast - by Mode of Deployment
- 10. Latin America Corporate Performance Management Market Analysis, Insights and Forecast, 2019-2031
- 10.1. Market Analysis, Insights and Forecast - by Mode of Deployment
- 10.1.1. On-Premises
- 10.1.2. Cloud
- 10.2. Market Analysis, Insights and Forecast - by Size of Organization
- 10.2.1. Small and Medium Enterprises
- 10.2.2. Large Enterprises
- 10.3. Market Analysis, Insights and Forecast - by End-user Industry
- 10.3.1. Retail
- 10.3.2. BFSI
- 10.3.3. Manufacturing
- 10.3.4. Energy and Power
- 10.3.5. Other End-user Industries
- 10.1. Market Analysis, Insights and Forecast - by Mode of Deployment
- 11. Middle East and Africa Corporate Performance Management Market Analysis, Insights and Forecast, 2019-2031
- 11.1. Market Analysis, Insights and Forecast - by Mode of Deployment
- 11.1.1. On-Premises
- 11.1.2. Cloud
- 11.2. Market Analysis, Insights and Forecast - by Size of Organization
- 11.2.1. Small and Medium Enterprises
- 11.2.2. Large Enterprises
- 11.3. Market Analysis, Insights and Forecast - by End-user Industry
- 11.3.1. Retail
- 11.3.2. BFSI
- 11.3.3. Manufacturing
- 11.3.4. Energy and Power
- 11.3.5. Other End-user Industries
- 11.1. Market Analysis, Insights and Forecast - by Mode of Deployment
- 12. North America Corporate Performance Management Market Analysis, Insights and Forecast, 2019-2031
- 12.1. Market Analysis, Insights and Forecast - By Country/Sub-region
- 12.1.1.
- 13. Europe Corporate Performance Management Market Analysis, Insights and Forecast, 2019-2031
- 13.1. Market Analysis, Insights and Forecast - By Country/Sub-region
- 13.1.1.
- 14. Asia Corporate Performance Management Market Analysis, Insights and Forecast, 2019-2031
- 14.1. Market Analysis, Insights and Forecast - By Country/Sub-region
- 14.1.1.
- 15. Australia and New Zealand Corporate Performance Management Market Analysis, Insights and Forecast, 2019-2031
- 15.1. Market Analysis, Insights and Forecast - By Country/Sub-region
- 15.1.1.
- 16. Latin America Corporate Performance Management Market Analysis, Insights and Forecast, 2019-2031
- 16.1. Market Analysis, Insights and Forecast - By Country/Sub-region
- 16.1.1.
- 17. Middle East and Africa Corporate Performance Management Market Analysis, Insights and Forecast, 2019-2031
- 17.1. Market Analysis, Insights and Forecast - By Country/Sub-region
- 17.1.1.
- 18. Competitive Analysis
- 18.1. Global Market Share Analysis 2024
- 18.2. Company Profiles
- 18.2.1 Longview Solutions
- 18.2.1.1. Overview
- 18.2.1.2. Products
- 18.2.1.3. SWOT Analysis
- 18.2.1.4. Recent Developments
- 18.2.1.5. Financials (Based on Availability)
- 18.2.2 IBM Corporation
- 18.2.2.1. Overview
- 18.2.2.2. Products
- 18.2.2.3. SWOT Analysis
- 18.2.2.4. Recent Developments
- 18.2.2.5. Financials (Based on Availability)
- 18.2.3 Adaptive Insights
- 18.2.3.1. Overview
- 18.2.3.2. Products
- 18.2.3.3. SWOT Analysis
- 18.2.3.4. Recent Developments
- 18.2.3.5. Financials (Based on Availability)
- 18.2.4 SAS Institue Inc
- 18.2.4.1. Overview
- 18.2.4.2. Products
- 18.2.4.3. SWOT Analysis
- 18.2.4.4. Recent Developments
- 18.2.4.5. Financials (Based on Availability)
- 18.2.5 Prophix Software Inc
- 18.2.5.1. Overview
- 18.2.5.2. Products
- 18.2.5.3. SWOT Analysis
- 18.2.5.4. Recent Developments
- 18.2.5.5. Financials (Based on Availability)
- 18.2.6 Anaplan Inc
- 18.2.6.1. Overview
- 18.2.6.2. Products
- 18.2.6.3. SWOT Analysis
- 18.2.6.4. Recent Developments
- 18.2.6.5. Financials (Based on Availability)
- 18.2.7 Oracle Corporation
- 18.2.7.1. Overview
- 18.2.7.2. Products
- 18.2.7.3. SWOT Analysis
- 18.2.7.4. Recent Developments
- 18.2.7.5. Financials (Based on Availability)
- 18.2.8 Tagetik Software S r l
- 18.2.8.1. Overview
- 18.2.8.2. Products
- 18.2.8.3. SWOT Analysis
- 18.2.8.4. Recent Developments
- 18.2.8.5. Financials (Based on Availability)
- 18.2.9 Host Analytics
- 18.2.9.1. Overview
- 18.2.9.2. Products
- 18.2.9.3. SWOT Analysis
- 18.2.9.4. Recent Developments
- 18.2.9.5. Financials (Based on Availability)
- 18.2.10 Board International
- 18.2.10.1. Overview
- 18.2.10.2. Products
- 18.2.10.3. SWOT Analysis
- 18.2.10.4. Recent Developments
- 18.2.10.5. Financials (Based on Availability)
- 18.2.11 Axiom Softwar
- 18.2.11.1. Overview
- 18.2.11.2. Products
- 18.2.11.3. SWOT Analysis
- 18.2.11.4. Recent Developments
- 18.2.11.5. Financials (Based on Availability)
- 18.2.12 SAP SE
- 18.2.12.1. Overview
- 18.2.12.2. Products
- 18.2.12.3. SWOT Analysis
- 18.2.12.4. Recent Developments
- 18.2.12.5. Financials (Based on Availability)
- 18.2.1 Longview Solutions
List of Figures
- Figure 1: Global Corporate Performance Management Market Revenue Breakdown (Million, %) by Region 2024 & 2032
- Figure 2: North America Corporate Performance Management Market Revenue (Million), by Country 2024 & 2032
- Figure 3: North America Corporate Performance Management Market Revenue Share (%), by Country 2024 & 2032
- Figure 4: Europe Corporate Performance Management Market Revenue (Million), by Country 2024 & 2032
- Figure 5: Europe Corporate Performance Management Market Revenue Share (%), by Country 2024 & 2032
- Figure 6: Asia Corporate Performance Management Market Revenue (Million), by Country 2024 & 2032
- Figure 7: Asia Corporate Performance Management Market Revenue Share (%), by Country 2024 & 2032
- Figure 8: Australia and New Zealand Corporate Performance Management Market Revenue (Million), by Country 2024 & 2032
- Figure 9: Australia and New Zealand Corporate Performance Management Market Revenue Share (%), by Country 2024 & 2032
- Figure 10: Latin America Corporate Performance Management Market Revenue (Million), by Country 2024 & 2032
- Figure 11: Latin America Corporate Performance Management Market Revenue Share (%), by Country 2024 & 2032
- Figure 12: Middle East and Africa Corporate Performance Management Market Revenue (Million), by Country 2024 & 2032
- Figure 13: Middle East and Africa Corporate Performance Management Market Revenue Share (%), by Country 2024 & 2032
- Figure 14: North America Corporate Performance Management Market Revenue (Million), by Mode of Deployment 2024 & 2032
- Figure 15: North America Corporate Performance Management Market Revenue Share (%), by Mode of Deployment 2024 & 2032
- Figure 16: North America Corporate Performance Management Market Revenue (Million), by Size of Organization 2024 & 2032
- Figure 17: North America Corporate Performance Management Market Revenue Share (%), by Size of Organization 2024 & 2032
- Figure 18: North America Corporate Performance Management Market Revenue (Million), by End-user Industry 2024 & 2032
- Figure 19: North America Corporate Performance Management Market Revenue Share (%), by End-user Industry 2024 & 2032
- Figure 20: North America Corporate Performance Management Market Revenue (Million), by Country 2024 & 2032
- Figure 21: North America Corporate Performance Management Market Revenue Share (%), by Country 2024 & 2032
- Figure 22: Europe Corporate Performance Management Market Revenue (Million), by Mode of Deployment 2024 & 2032
- Figure 23: Europe Corporate Performance Management Market Revenue Share (%), by Mode of Deployment 2024 & 2032
- Figure 24: Europe Corporate Performance Management Market Revenue (Million), by Size of Organization 2024 & 2032
- Figure 25: Europe Corporate Performance Management Market Revenue Share (%), by Size of Organization 2024 & 2032
- Figure 26: Europe Corporate Performance Management Market Revenue (Million), by End-user Industry 2024 & 2032
- Figure 27: Europe Corporate Performance Management Market Revenue Share (%), by End-user Industry 2024 & 2032
- Figure 28: Europe Corporate Performance Management Market Revenue (Million), by Country 2024 & 2032
- Figure 29: Europe Corporate Performance Management Market Revenue Share (%), by Country 2024 & 2032
- Figure 30: Asia Corporate Performance Management Market Revenue (Million), by Mode of Deployment 2024 & 2032
- Figure 31: Asia Corporate Performance Management Market Revenue Share (%), by Mode of Deployment 2024 & 2032
- Figure 32: Asia Corporate Performance Management Market Revenue (Million), by Size of Organization 2024 & 2032
- Figure 33: Asia Corporate Performance Management Market Revenue Share (%), by Size of Organization 2024 & 2032
- Figure 34: Asia Corporate Performance Management Market Revenue (Million), by End-user Industry 2024 & 2032
- Figure 35: Asia Corporate Performance Management Market Revenue Share (%), by End-user Industry 2024 & 2032
- Figure 36: Asia Corporate Performance Management Market Revenue (Million), by Country 2024 & 2032
- Figure 37: Asia Corporate Performance Management Market Revenue Share (%), by Country 2024 & 2032
- Figure 38: Australia and New Zealand Corporate Performance Management Market Revenue (Million), by Mode of Deployment 2024 & 2032
- Figure 39: Australia and New Zealand Corporate Performance Management Market Revenue Share (%), by Mode of Deployment 2024 & 2032
- Figure 40: Australia and New Zealand Corporate Performance Management Market Revenue (Million), by Size of Organization 2024 & 2032
- Figure 41: Australia and New Zealand Corporate Performance Management Market Revenue Share (%), by Size of Organization 2024 & 2032
- Figure 42: Australia and New Zealand Corporate Performance Management Market Revenue (Million), by End-user Industry 2024 & 2032
- Figure 43: Australia and New Zealand Corporate Performance Management Market Revenue Share (%), by End-user Industry 2024 & 2032
- Figure 44: Australia and New Zealand Corporate Performance Management Market Revenue (Million), by Country 2024 & 2032
- Figure 45: Australia and New Zealand Corporate Performance Management Market Revenue Share (%), by Country 2024 & 2032
- Figure 46: Latin America Corporate Performance Management Market Revenue (Million), by Mode of Deployment 2024 & 2032
- Figure 47: Latin America Corporate Performance Management Market Revenue Share (%), by Mode of Deployment 2024 & 2032
- Figure 48: Latin America Corporate Performance Management Market Revenue (Million), by Size of Organization 2024 & 2032
- Figure 49: Latin America Corporate Performance Management Market Revenue Share (%), by Size of Organization 2024 & 2032
- Figure 50: Latin America Corporate Performance Management Market Revenue (Million), by End-user Industry 2024 & 2032
- Figure 51: Latin America Corporate Performance Management Market Revenue Share (%), by End-user Industry 2024 & 2032
- Figure 52: Latin America Corporate Performance Management Market Revenue (Million), by Country 2024 & 2032
- Figure 53: Latin America Corporate Performance Management Market Revenue Share (%), by Country 2024 & 2032
- Figure 54: Middle East and Africa Corporate Performance Management Market Revenue (Million), by Mode of Deployment 2024 & 2032
- Figure 55: Middle East and Africa Corporate Performance Management Market Revenue Share (%), by Mode of Deployment 2024 & 2032
- Figure 56: Middle East and Africa Corporate Performance Management Market Revenue (Million), by Size of Organization 2024 & 2032
- Figure 57: Middle East and Africa Corporate Performance Management Market Revenue Share (%), by Size of Organization 2024 & 2032
- Figure 58: Middle East and Africa Corporate Performance Management Market Revenue (Million), by End-user Industry 2024 & 2032
- Figure 59: Middle East and Africa Corporate Performance Management Market Revenue Share (%), by End-user Industry 2024 & 2032
- Figure 60: Middle East and Africa Corporate Performance Management Market Revenue (Million), by Country 2024 & 2032
- Figure 61: Middle East and Africa Corporate Performance Management Market Revenue Share (%), by Country 2024 & 2032
List of Tables
- Table 1: Global Corporate Performance Management Market Revenue Million Forecast, by Region 2019 & 2032
- Table 2: Global Corporate Performance Management Market Revenue Million Forecast, by Mode of Deployment 2019 & 2032
- Table 3: Global Corporate Performance Management Market Revenue Million Forecast, by Size of Organization 2019 & 2032
- Table 4: Global Corporate Performance Management Market Revenue Million Forecast, by End-user Industry 2019 & 2032
- Table 5: Global Corporate Performance Management Market Revenue Million Forecast, by Region 2019 & 2032
- Table 6: Global Corporate Performance Management Market Revenue Million Forecast, by Country 2019 & 2032
- Table 7: Corporate Performance Management Market Revenue (Million) Forecast, by Application 2019 & 2032
- Table 8: Global Corporate Performance Management Market Revenue Million Forecast, by Country 2019 & 2032
- Table 9: Corporate Performance Management Market Revenue (Million) Forecast, by Application 2019 & 2032
- Table 10: Global Corporate Performance Management Market Revenue Million Forecast, by Country 2019 & 2032
- Table 11: Corporate Performance Management Market Revenue (Million) Forecast, by Application 2019 & 2032
- Table 12: Global Corporate Performance Management Market Revenue Million Forecast, by Country 2019 & 2032
- Table 13: Corporate Performance Management Market Revenue (Million) Forecast, by Application 2019 & 2032
- Table 14: Global Corporate Performance Management Market Revenue Million Forecast, by Country 2019 & 2032
- Table 15: Corporate Performance Management Market Revenue (Million) Forecast, by Application 2019 & 2032
- Table 16: Global Corporate Performance Management Market Revenue Million Forecast, by Country 2019 & 2032
- Table 17: Corporate Performance Management Market Revenue (Million) Forecast, by Application 2019 & 2032
- Table 18: Global Corporate Performance Management Market Revenue Million Forecast, by Mode of Deployment 2019 & 2032
- Table 19: Global Corporate Performance Management Market Revenue Million Forecast, by Size of Organization 2019 & 2032
- Table 20: Global Corporate Performance Management Market Revenue Million Forecast, by End-user Industry 2019 & 2032
- Table 21: Global Corporate Performance Management Market Revenue Million Forecast, by Country 2019 & 2032
- Table 22: Global Corporate Performance Management Market Revenue Million Forecast, by Mode of Deployment 2019 & 2032
- Table 23: Global Corporate Performance Management Market Revenue Million Forecast, by Size of Organization 2019 & 2032
- Table 24: Global Corporate Performance Management Market Revenue Million Forecast, by End-user Industry 2019 & 2032
- Table 25: Global Corporate Performance Management Market Revenue Million Forecast, by Country 2019 & 2032
- Table 26: Global Corporate Performance Management Market Revenue Million Forecast, by Mode of Deployment 2019 & 2032
- Table 27: Global Corporate Performance Management Market Revenue Million Forecast, by Size of Organization 2019 & 2032
- Table 28: Global Corporate Performance Management Market Revenue Million Forecast, by End-user Industry 2019 & 2032
- Table 29: Global Corporate Performance Management Market Revenue Million Forecast, by Country 2019 & 2032
- Table 30: Global Corporate Performance Management Market Revenue Million Forecast, by Mode of Deployment 2019 & 2032
- Table 31: Global Corporate Performance Management Market Revenue Million Forecast, by Size of Organization 2019 & 2032
- Table 32: Global Corporate Performance Management Market Revenue Million Forecast, by End-user Industry 2019 & 2032
- Table 33: Global Corporate Performance Management Market Revenue Million Forecast, by Country 2019 & 2032
- Table 34: Global Corporate Performance Management Market Revenue Million Forecast, by Mode of Deployment 2019 & 2032
- Table 35: Global Corporate Performance Management Market Revenue Million Forecast, by Size of Organization 2019 & 2032
- Table 36: Global Corporate Performance Management Market Revenue Million Forecast, by End-user Industry 2019 & 2032
- Table 37: Global Corporate Performance Management Market Revenue Million Forecast, by Country 2019 & 2032
- Table 38: Global Corporate Performance Management Market Revenue Million Forecast, by Mode of Deployment 2019 & 2032
- Table 39: Global Corporate Performance Management Market Revenue Million Forecast, by Size of Organization 2019 & 2032
- Table 40: Global Corporate Performance Management Market Revenue Million Forecast, by End-user Industry 2019 & 2032
- Table 41: Global Corporate Performance Management Market Revenue Million Forecast, by Country 2019 & 2032
Frequently Asked Questions
1. What is the projected Compound Annual Growth Rate (CAGR) of the Corporate Performance Management Market?
The projected CAGR is approximately 6.40%.
2. Which companies are prominent players in the Corporate Performance Management Market?
Key companies in the market include Longview Solutions, IBM Corporation, Adaptive Insights, SAS Institue Inc, Prophix Software Inc, Anaplan Inc, Oracle Corporation, Tagetik Software S r l, Host Analytics, Board International, Axiom Softwar, SAP SE.
3. What are the main segments of the Corporate Performance Management Market?
The market segments include Mode of Deployment, Size of Organization, End-user Industry.
4. Can you provide details about the market size?
The market size is estimated to be USD 6.70 Million as of 2022.
5. What are some drivers contributing to market growth?
Proliferation of Data Driven Decision Making; Growing Focus on Organizational Compliance.
6. What are the notable trends driving market growth?
Cloud Segment is Expected to Hold a Significant Share of the Market.
7. Are there any restraints impacting market growth?
Rise of Cloud-based Cyber Threats.
8. Can you provide examples of recent developments in the market?
N/A
9. What pricing options are available for accessing the report?
Pricing options include single-user, multi-user, and enterprise licenses priced at USD 4750, USD 5250, and USD 8750 respectively.
10. Is the market size provided in terms of value or volume?
The market size is provided in terms of value, measured in Million.
11. Are there any specific market keywords associated with the report?
Yes, the market keyword associated with the report is "Corporate Performance Management Market," which aids in identifying and referencing the specific market segment covered.
12. How do I determine which pricing option suits my needs best?
The pricing options vary based on user requirements and access needs. Individual users may opt for single-user licenses, while businesses requiring broader access may choose multi-user or enterprise licenses for cost-effective access to the report.
13. Are there any additional resources or data provided in the Corporate Performance Management Market report?
While the report offers comprehensive insights, it's advisable to review the specific contents or supplementary materials provided to ascertain if additional resources or data are available.
14. How can I stay updated on further developments or reports in the Corporate Performance Management Market?
To stay informed about further developments, trends, and reports in the Corporate Performance Management Market, consider subscribing to industry newsletters, following relevant companies and organizations, or regularly checking reputable industry news sources and publications.
Methodology
Step 1 - Identification of Relevant Samples Size from Population Database


Step 2 - Approaches for Defining Global Market Size (Value, Volume* & Price*)

Note*: In applicable scenarios
Step 3 - Data Sources
Primary Research
- Web Analytics
- Survey Reports
- Research Institute
- Latest Research Reports
- Opinion Leaders
Secondary Research
- Annual Reports
- White Paper
- Latest Press Release
- Industry Association
- Paid Database
- Investor Presentations

Step 4 - Data Triangulation
Involves using different sources of information in order to increase the validity of a study
These sources are likely to be stakeholders in a program - participants, other researchers, program staff, other community members, and so on.
Then we put all data in single framework & apply various statistical tools to find out the dynamic on the market.
During the analysis stage, feedback from the stakeholder groups would be compared to determine areas of agreement as well as areas of divergence
