

Key Insights
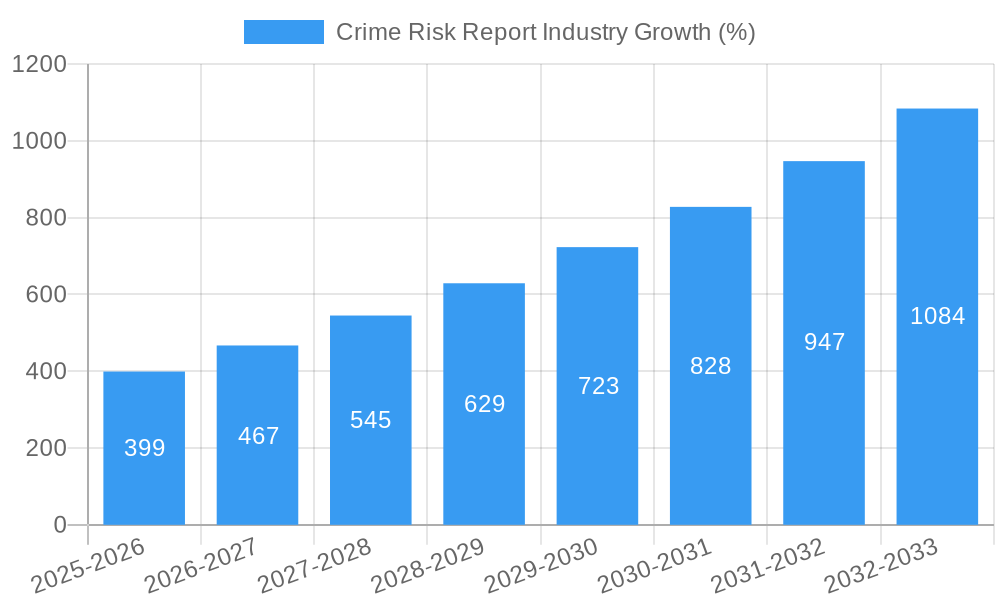
The Crime Risk Report industry is experiencing robust growth, projected to reach a market size of $2.5 billion by 2025, expanding at a Compound Annual Growth Rate (CAGR) of 16% from 2025 to 2033. This surge is fueled by several key drivers. The increasing prevalence of financial crimes, stricter regulatory compliance requirements (like KYC/AML), and the growing need for proactive risk management across sectors like banking, insurance, and real estate are all significantly impacting market demand. Furthermore, the rising adoption of advanced technologies such as artificial intelligence (AI) and machine learning (ML) for enhanced crime risk assessment and predictive analytics is accelerating market expansion. The shift towards cloud-based deployment models offers scalability and cost-effectiveness, further propelling market growth. While data privacy concerns and the complexity of integrating new technologies could pose some challenges, the overall market outlook remains strongly positive, with significant opportunities for existing and emerging players.
The industry's segmentation highlights the diverse applications of crime risk reports. Banking and finance remain dominant segments due to stringent regulatory scrutiny and the high financial stakes involved. However, growth is also observed in insurance and real estate, driven by the need for robust due diligence and fraud prevention. The on-premise deployment model is expected to gradually yield market share to cloud-based solutions as organizations prioritize agility and accessibility. Geographically, North America and Europe currently hold significant market shares, but the Asia-Pacific region is poised for rapid expansion due to increasing digitalization and growing adoption of risk management strategies. The continued evolution of regulatory frameworks and technological advancements will shape the future trajectory of this dynamic market, presenting both challenges and opportunities for stakeholders.

Crime Risk Report Industry: A Comprehensive Market Analysis (2019-2033)
This comprehensive report provides an in-depth analysis of the Crime Risk Report industry, encompassing market dynamics, growth trends, regional segmentation, product landscape, key players, and future outlook. The study period covers 2019-2033, with a base year of 2025 and a forecast period of 2025-2033. The report utilizes both qualitative and quantitative data to offer a holistic view of this rapidly evolving market, valued at xx Million in 2025 and projected to reach xx Million by 2033.
Crime Risk Report Industry Market Dynamics & Structure
The Crime Risk Report industry is characterized by a moderately concentrated market structure, with a few dominant players and several niche providers. Technological innovation, particularly in AI and machine learning, is a key driver, enhancing the accuracy and efficiency of risk assessment. Stringent regulatory frameworks, such as KYC/AML compliance regulations, are shaping market demand. The industry faces competition from alternative risk assessment methods, but the increasing complexity of financial crime necessitates sophisticated solutions. End-users primarily comprise financial institutions (Banking and Insurance), real estate companies, and other sectors needing robust risk management. Mergers and acquisitions (M&A) activity has been moderate, with strategic acquisitions aimed at enhancing technological capabilities and expanding market reach.
- Market Concentration: Moderately concentrated, with top 5 players holding approximately xx% market share in 2025.
- Technological Innovation: AI, Machine Learning, and Big Data analytics are key drivers.
- Regulatory Framework: KYC/AML compliance significantly influences demand.
- Competitive Substitutes: Simpler, less sophisticated risk assessment methods.
- M&A Activity: xx deals recorded between 2019 and 2024, with an average deal value of xx Million.
- Innovation Barriers: High initial investment costs, data security concerns, and integration challenges.
Crime Risk Report Industry Growth Trends & Insights
The Crime Risk Report market has witnessed robust growth over the historical period (2019-2024), driven by increasing regulatory scrutiny, rising instances of financial crime, and the adoption of advanced analytics. The market size expanded from xx Million in 2019 to xx Million in 2024, exhibiting a CAGR of xx%. Technological disruptions, including the increasing use of cloud-based solutions and AI-powered risk assessment tools, are significantly impacting market adoption rates. Consumer behavior shifts towards digitalization and increasing reliance on online transactions have further fueled demand for effective crime risk management solutions. The market penetration rate is estimated at xx% in 2025, with significant growth potential remaining.
Dominant Regions, Countries, or Segments in Crime Risk Report Industry
North America currently dominates the Crime Risk Report market, driven by stringent regulatory frameworks, a high concentration of financial institutions, and early adoption of advanced technologies. Within the application segment, Banking holds the largest share, followed by Insurance and Real Estate. The cloud deployment model is experiencing faster growth compared to on-premise solutions due to scalability and cost-effectiveness.
- North America Dominance: High regulatory pressure, advanced technological infrastructure, and a large financial sector.
- Banking Segment Leadership: Highest risk exposure and stringent compliance requirements.
- Cloud Deployment Growth: Scalability, cost-efficiency, and ease of integration drive adoption.
- European Market Growth: Increasing regulatory compliance and growing digitalization are fueling market expansion.
- Asia-Pacific Potential: High growth potential driven by rapid economic development and increasing financial transactions.
Crime Risk Report Industry Product Landscape
The Crime Risk Report market offers a range of solutions, from basic screening tools to sophisticated AI-powered platforms capable of real-time risk assessment and predictive analytics. Products are differentiated based on features such as data sources, analytical capabilities, integration with existing systems, and user-friendliness. Key technological advancements include enhanced data visualization, improved accuracy in risk scoring, and automated reporting functionalities. Unique selling propositions often include specialized expertise in specific crime types (e.g., fraud, money laundering) and seamless integration with compliance workflows.
Key Drivers, Barriers & Challenges in Crime Risk Report Industry
Key Drivers: Stringent regulatory compliance requirements, increasing sophistication of financial crimes, the need for proactive risk management, and advancements in AI and machine learning.
Challenges & Restraints: High initial investment costs for advanced solutions, data security and privacy concerns, integration complexities with legacy systems, and competition from established players. Furthermore, a shortage of skilled professionals capable of effectively utilizing and interpreting complex risk assessment data poses a significant challenge. Supply chain disruptions can impact product delivery and implementation timelines.
Emerging Opportunities in Crime Risk Report Industry
Untapped markets in developing economies, increasing adoption of open banking APIs, the integration of blockchain technology for enhanced security, and the development of tailored solutions for specific industry verticals represent key opportunities. The expanding use of AI for fraud detection and prevention presents significant potential.
Growth Accelerators in the Crime Risk Report Industry Industry
Technological advancements, strategic partnerships between technology providers and financial institutions, and expansion into new geographic markets are key growth accelerators. The development of innovative solutions to address evolving financial crime techniques will also drive market expansion.
Key Players Shaping the Crime Risk Report Market
- Mphasis Limited
- Fenergo Ltd
- Fiserv Inc
- CoreLogic Inc
- Capco
- Refinitiv US Holdings Inc
- RiskScreen (KYC Global Technologies)
- IBM Corp
- NICE Ltd
- Oracle Corporation
- ACI Worldwide Inc
Notable Milestones in Crime Risk Report Industry Sector
- 2020: Increased regulatory focus on AML compliance leads to significant market growth.
- 2021: Several key players launch AI-powered risk assessment platforms.
- 2022: Significant M&A activity consolidates market share among key players.
- 2023: Focus shifts towards addressing emerging financial crime techniques (e.g., crypto-related crimes).
- 2024: Increased adoption of cloud-based solutions.
In-Depth Crime Risk Report Industry Market Outlook
The Crime Risk Report industry is poised for continued robust growth, driven by persistent regulatory pressure, evolving financial crime landscape, and technological innovation. Strategic partnerships, expansion into new markets, and the development of advanced analytical capabilities will be crucial for success. The market presents significant opportunities for players who can effectively address the evolving needs of financial institutions and other organizations seeking robust crime risk management solutions.
Crime Risk Report Industry Segmentation
-
1. Deployment
- 1.1. On-Premise
- 1.2. Cloud
-
2. Application
- 2.1. Banking
- 2.2. Insurance
- 2.3. Real Estate
- 2.4. Other Applications
Crime Risk Report Industry Segmentation By Geography
-
1. North America
- 1.1. United States
- 1.2. Canada
-
2. Europe
- 2.1. Germany
- 2.2. United Kingdom
- 2.3. Rest of Europe
-
3. Asia Pacific
- 3.1. China
- 3.2. Japan
- 3.3. India
- 3.4. Rest of Asia Pacific
-
4. Rest of the World
- 4.1. Latin America
- 4.2. Middle East

Crime Risk Report Industry REPORT HIGHLIGHTS
| Aspects | Details |
|---|---|
| Study Period | 2019-2033 |
| Base Year | 2024 |
| Estimated Year | 2025 |
| Forecast Period | 2025-2033 |
| Historical Period | 2019-2024 |
| Growth Rate | CAGR of 16.00% from 2019-2033 |
| Segmentation |
|
Table of Contents
- 1. Introduction
- 1.1. Research Scope
- 1.2. Market Segmentation
- 1.3. Research Methodology
- 1.4. Definitions and Assumptions
- 2. Executive Summary
- 2.1. Introduction
- 3. Market Dynamics
- 3.1. Introduction
- 3.2. Market Drivers
- 3.2.1. ; Increased Digitalization in Banking Sector; Concern for Data Security and Fraud Detection
- 3.3. Market Restrains
- 3.3.1. ; Sceptical View on Data Privacy
- 3.4. Market Trends
- 3.4.1. Growth in Digitalization and Cloud Adoption is Influencing the Market Demand
- 4. Market Factor Analysis
- 4.1. Porters Five Forces
- 4.2. Supply/Value Chain
- 4.3. PESTEL analysis
- 4.4. Market Entropy
- 4.5. Patent/Trademark Analysis
- 5. Global Crime Risk Report Industry Analysis, Insights and Forecast, 2019-2031
- 5.1. Market Analysis, Insights and Forecast - by Deployment
- 5.1.1. On-Premise
- 5.1.2. Cloud
- 5.2. Market Analysis, Insights and Forecast - by Application
- 5.2.1. Banking
- 5.2.2. Insurance
- 5.2.3. Real Estate
- 5.2.4. Other Applications
- 5.3. Market Analysis, Insights and Forecast - by Region
- 5.3.1. North America
- 5.3.2. Europe
- 5.3.3. Asia Pacific
- 5.3.4. Rest of the World
- 5.1. Market Analysis, Insights and Forecast - by Deployment
- 6. North America Crime Risk Report Industry Analysis, Insights and Forecast, 2019-2031
- 6.1. Market Analysis, Insights and Forecast - by Deployment
- 6.1.1. On-Premise
- 6.1.2. Cloud
- 6.2. Market Analysis, Insights and Forecast - by Application
- 6.2.1. Banking
- 6.2.2. Insurance
- 6.2.3. Real Estate
- 6.2.4. Other Applications
- 6.1. Market Analysis, Insights and Forecast - by Deployment
- 7. Europe Crime Risk Report Industry Analysis, Insights and Forecast, 2019-2031
- 7.1. Market Analysis, Insights and Forecast - by Deployment
- 7.1.1. On-Premise
- 7.1.2. Cloud
- 7.2. Market Analysis, Insights and Forecast - by Application
- 7.2.1. Banking
- 7.2.2. Insurance
- 7.2.3. Real Estate
- 7.2.4. Other Applications
- 7.1. Market Analysis, Insights and Forecast - by Deployment
- 8. Asia Pacific Crime Risk Report Industry Analysis, Insights and Forecast, 2019-2031
- 8.1. Market Analysis, Insights and Forecast - by Deployment
- 8.1.1. On-Premise
- 8.1.2. Cloud
- 8.2. Market Analysis, Insights and Forecast - by Application
- 8.2.1. Banking
- 8.2.2. Insurance
- 8.2.3. Real Estate
- 8.2.4. Other Applications
- 8.1. Market Analysis, Insights and Forecast - by Deployment
- 9. Rest of the World Crime Risk Report Industry Analysis, Insights and Forecast, 2019-2031
- 9.1. Market Analysis, Insights and Forecast - by Deployment
- 9.1.1. On-Premise
- 9.1.2. Cloud
- 9.2. Market Analysis, Insights and Forecast - by Application
- 9.2.1. Banking
- 9.2.2. Insurance
- 9.2.3. Real Estate
- 9.2.4. Other Applications
- 9.1. Market Analysis, Insights and Forecast - by Deployment
- 10. North America Crime Risk Report Industry Analysis, Insights and Forecast, 2019-2031
- 10.1. Market Analysis, Insights and Forecast - By Country/Sub-region
- 10.1.1. undefined
- 11. Europe Crime Risk Report Industry Analysis, Insights and Forecast, 2019-2031
- 11.1. Market Analysis, Insights and Forecast - By Country/Sub-region
- 11.1.1. undefined
- 12. Asia Pacific Crime Risk Report Industry Analysis, Insights and Forecast, 2019-2031
- 12.1. Market Analysis, Insights and Forecast - By Country/Sub-region
- 12.1.1. undefined
- 13. South America Crime Risk Report Industry Analysis, Insights and Forecast, 2019-2031
- 13.1. Market Analysis, Insights and Forecast - By Country/Sub-region
- 13.1.1. undefined
- 14. North America Crime Risk Report Industry Analysis, Insights and Forecast, 2019-2031
- 14.1. Market Analysis, Insights and Forecast - By Country/Sub-region
- 14.1.1. undefined
- 15. MEA Crime Risk Report Industry Analysis, Insights and Forecast, 2019-2031
- 15.1. Market Analysis, Insights and Forecast - By Country/Sub-region
- 15.1.1. undefined
- 16. Competitive Analysis
- 16.1. Global Market Share Analysis 2024
- 16.2. Company Profiles
- 16.2.1 Mphasis Limited
- 16.2.1.1. Overview
- 16.2.1.2. Products
- 16.2.1.3. SWOT Analysis
- 16.2.1.4. Recent Developments
- 16.2.1.5. Financials (Based on Availability)
- 16.2.2 Fenergo Ltd
- 16.2.2.1. Overview
- 16.2.2.2. Products
- 16.2.2.3. SWOT Analysis
- 16.2.2.4. Recent Developments
- 16.2.2.5. Financials (Based on Availability)
- 16.2.3 Fiserv Inc
- 16.2.3.1. Overview
- 16.2.3.2. Products
- 16.2.3.3. SWOT Analysis
- 16.2.3.4. Recent Developments
- 16.2.3.5. Financials (Based on Availability)
- 16.2.4 CoreLogic Inc
- 16.2.4.1. Overview
- 16.2.4.2. Products
- 16.2.4.3. SWOT Analysis
- 16.2.4.4. Recent Developments
- 16.2.4.5. Financials (Based on Availability)
- 16.2.5 Capco
- 16.2.5.1. Overview
- 16.2.5.2. Products
- 16.2.5.3. SWOT Analysis
- 16.2.5.4. Recent Developments
- 16.2.5.5. Financials (Based on Availability)
- 16.2.6 Refinitiv US Holdings Inc
- 16.2.6.1. Overview
- 16.2.6.2. Products
- 16.2.6.3. SWOT Analysis
- 16.2.6.4. Recent Developments
- 16.2.6.5. Financials (Based on Availability)
- 16.2.7 RiskScreen (KYC Global Technologies)
- 16.2.7.1. Overview
- 16.2.7.2. Products
- 16.2.7.3. SWOT Analysis
- 16.2.7.4. Recent Developments
- 16.2.7.5. Financials (Based on Availability)
- 16.2.8 IBM Corp
- 16.2.8.1. Overview
- 16.2.8.2. Products
- 16.2.8.3. SWOT Analysis
- 16.2.8.4. Recent Developments
- 16.2.8.5. Financials (Based on Availability)
- 16.2.9 NICE Ltd
- 16.2.9.1. Overview
- 16.2.9.2. Products
- 16.2.9.3. SWOT Analysis
- 16.2.9.4. Recent Developments
- 16.2.9.5. Financials (Based on Availability)
- 16.2.10 Oracle Corporation
- 16.2.10.1. Overview
- 16.2.10.2. Products
- 16.2.10.3. SWOT Analysis
- 16.2.10.4. Recent Developments
- 16.2.10.5. Financials (Based on Availability)
- 16.2.11 ACI Worldwide Inc
- 16.2.11.1. Overview
- 16.2.11.2. Products
- 16.2.11.3. SWOT Analysis
- 16.2.11.4. Recent Developments
- 16.2.11.5. Financials (Based on Availability)
- 16.2.1 Mphasis Limited
List of Figures
- Figure 1: Global Crime Risk Report Industry Revenue Breakdown (Million, %) by Region 2024 & 2032
- Figure 2: Global Crime Risk Report Industry Volume Breakdown (K Unit, %) by Region 2024 & 2032
- Figure 3: North America Crime Risk Report Industry Revenue (Million), by Country 2024 & 2032
- Figure 4: North America Crime Risk Report Industry Volume (K Unit), by Country 2024 & 2032
- Figure 5: North America Crime Risk Report Industry Revenue Share (%), by Country 2024 & 2032
- Figure 6: North America Crime Risk Report Industry Volume Share (%), by Country 2024 & 2032
- Figure 7: Europe Crime Risk Report Industry Revenue (Million), by Country 2024 & 2032
- Figure 8: Europe Crime Risk Report Industry Volume (K Unit), by Country 2024 & 2032
- Figure 9: Europe Crime Risk Report Industry Revenue Share (%), by Country 2024 & 2032
- Figure 10: Europe Crime Risk Report Industry Volume Share (%), by Country 2024 & 2032
- Figure 11: Asia Pacific Crime Risk Report Industry Revenue (Million), by Country 2024 & 2032
- Figure 12: Asia Pacific Crime Risk Report Industry Volume (K Unit), by Country 2024 & 2032
- Figure 13: Asia Pacific Crime Risk Report Industry Revenue Share (%), by Country 2024 & 2032
- Figure 14: Asia Pacific Crime Risk Report Industry Volume Share (%), by Country 2024 & 2032
- Figure 15: South America Crime Risk Report Industry Revenue (Million), by Country 2024 & 2032
- Figure 16: South America Crime Risk Report Industry Volume (K Unit), by Country 2024 & 2032
- Figure 17: South America Crime Risk Report Industry Revenue Share (%), by Country 2024 & 2032
- Figure 18: South America Crime Risk Report Industry Volume Share (%), by Country 2024 & 2032
- Figure 19: North America Crime Risk Report Industry Revenue (Million), by Country 2024 & 2032
- Figure 20: North America Crime Risk Report Industry Volume (K Unit), by Country 2024 & 2032
- Figure 21: North America Crime Risk Report Industry Revenue Share (%), by Country 2024 & 2032
- Figure 22: North America Crime Risk Report Industry Volume Share (%), by Country 2024 & 2032
- Figure 23: MEA Crime Risk Report Industry Revenue (Million), by Country 2024 & 2032
- Figure 24: MEA Crime Risk Report Industry Volume (K Unit), by Country 2024 & 2032
- Figure 25: MEA Crime Risk Report Industry Revenue Share (%), by Country 2024 & 2032
- Figure 26: MEA Crime Risk Report Industry Volume Share (%), by Country 2024 & 2032
- Figure 27: North America Crime Risk Report Industry Revenue (Million), by Deployment 2024 & 2032
- Figure 28: North America Crime Risk Report Industry Volume (K Unit), by Deployment 2024 & 2032
- Figure 29: North America Crime Risk Report Industry Revenue Share (%), by Deployment 2024 & 2032
- Figure 30: North America Crime Risk Report Industry Volume Share (%), by Deployment 2024 & 2032
- Figure 31: North America Crime Risk Report Industry Revenue (Million), by Application 2024 & 2032
- Figure 32: North America Crime Risk Report Industry Volume (K Unit), by Application 2024 & 2032
- Figure 33: North America Crime Risk Report Industry Revenue Share (%), by Application 2024 & 2032
- Figure 34: North America Crime Risk Report Industry Volume Share (%), by Application 2024 & 2032
- Figure 35: North America Crime Risk Report Industry Revenue (Million), by Country 2024 & 2032
- Figure 36: North America Crime Risk Report Industry Volume (K Unit), by Country 2024 & 2032
- Figure 37: North America Crime Risk Report Industry Revenue Share (%), by Country 2024 & 2032
- Figure 38: North America Crime Risk Report Industry Volume Share (%), by Country 2024 & 2032
- Figure 39: Europe Crime Risk Report Industry Revenue (Million), by Deployment 2024 & 2032
- Figure 40: Europe Crime Risk Report Industry Volume (K Unit), by Deployment 2024 & 2032
- Figure 41: Europe Crime Risk Report Industry Revenue Share (%), by Deployment 2024 & 2032
- Figure 42: Europe Crime Risk Report Industry Volume Share (%), by Deployment 2024 & 2032
- Figure 43: Europe Crime Risk Report Industry Revenue (Million), by Application 2024 & 2032
- Figure 44: Europe Crime Risk Report Industry Volume (K Unit), by Application 2024 & 2032
- Figure 45: Europe Crime Risk Report Industry Revenue Share (%), by Application 2024 & 2032
- Figure 46: Europe Crime Risk Report Industry Volume Share (%), by Application 2024 & 2032
- Figure 47: Europe Crime Risk Report Industry Revenue (Million), by Country 2024 & 2032
- Figure 48: Europe Crime Risk Report Industry Volume (K Unit), by Country 2024 & 2032
- Figure 49: Europe Crime Risk Report Industry Revenue Share (%), by Country 2024 & 2032
- Figure 50: Europe Crime Risk Report Industry Volume Share (%), by Country 2024 & 2032
- Figure 51: Asia Pacific Crime Risk Report Industry Revenue (Million), by Deployment 2024 & 2032
- Figure 52: Asia Pacific Crime Risk Report Industry Volume (K Unit), by Deployment 2024 & 2032
- Figure 53: Asia Pacific Crime Risk Report Industry Revenue Share (%), by Deployment 2024 & 2032
- Figure 54: Asia Pacific Crime Risk Report Industry Volume Share (%), by Deployment 2024 & 2032
- Figure 55: Asia Pacific Crime Risk Report Industry Revenue (Million), by Application 2024 & 2032
- Figure 56: Asia Pacific Crime Risk Report Industry Volume (K Unit), by Application 2024 & 2032
- Figure 57: Asia Pacific Crime Risk Report Industry Revenue Share (%), by Application 2024 & 2032
- Figure 58: Asia Pacific Crime Risk Report Industry Volume Share (%), by Application 2024 & 2032
- Figure 59: Asia Pacific Crime Risk Report Industry Revenue (Million), by Country 2024 & 2032
- Figure 60: Asia Pacific Crime Risk Report Industry Volume (K Unit), by Country 2024 & 2032
- Figure 61: Asia Pacific Crime Risk Report Industry Revenue Share (%), by Country 2024 & 2032
- Figure 62: Asia Pacific Crime Risk Report Industry Volume Share (%), by Country 2024 & 2032
- Figure 63: Rest of the World Crime Risk Report Industry Revenue (Million), by Deployment 2024 & 2032
- Figure 64: Rest of the World Crime Risk Report Industry Volume (K Unit), by Deployment 2024 & 2032
- Figure 65: Rest of the World Crime Risk Report Industry Revenue Share (%), by Deployment 2024 & 2032
- Figure 66: Rest of the World Crime Risk Report Industry Volume Share (%), by Deployment 2024 & 2032
- Figure 67: Rest of the World Crime Risk Report Industry Revenue (Million), by Application 2024 & 2032
- Figure 68: Rest of the World Crime Risk Report Industry Volume (K Unit), by Application 2024 & 2032
- Figure 69: Rest of the World Crime Risk Report Industry Revenue Share (%), by Application 2024 & 2032
- Figure 70: Rest of the World Crime Risk Report Industry Volume Share (%), by Application 2024 & 2032
- Figure 71: Rest of the World Crime Risk Report Industry Revenue (Million), by Country 2024 & 2032
- Figure 72: Rest of the World Crime Risk Report Industry Volume (K Unit), by Country 2024 & 2032
- Figure 73: Rest of the World Crime Risk Report Industry Revenue Share (%), by Country 2024 & 2032
- Figure 74: Rest of the World Crime Risk Report Industry Volume Share (%), by Country 2024 & 2032
List of Tables
- Table 1: Global Crime Risk Report Industry Revenue Million Forecast, by Region 2019 & 2032
- Table 2: Global Crime Risk Report Industry Volume K Unit Forecast, by Region 2019 & 2032
- Table 3: Global Crime Risk Report Industry Revenue Million Forecast, by Deployment 2019 & 2032
- Table 4: Global Crime Risk Report Industry Volume K Unit Forecast, by Deployment 2019 & 2032
- Table 5: Global Crime Risk Report Industry Revenue Million Forecast, by Application 2019 & 2032
- Table 6: Global Crime Risk Report Industry Volume K Unit Forecast, by Application 2019 & 2032
- Table 7: Global Crime Risk Report Industry Revenue Million Forecast, by Region 2019 & 2032
- Table 8: Global Crime Risk Report Industry Volume K Unit Forecast, by Region 2019 & 2032
- Table 9: Global Crime Risk Report Industry Revenue Million Forecast, by Country 2019 & 2032
- Table 10: Global Crime Risk Report Industry Volume K Unit Forecast, by Country 2019 & 2032
- Table 11: Global Crime Risk Report Industry Revenue Million Forecast, by Country 2019 & 2032
- Table 12: Global Crime Risk Report Industry Volume K Unit Forecast, by Country 2019 & 2032
- Table 13: Global Crime Risk Report Industry Revenue Million Forecast, by Country 2019 & 2032
- Table 14: Global Crime Risk Report Industry Volume K Unit Forecast, by Country 2019 & 2032
- Table 15: Global Crime Risk Report Industry Revenue Million Forecast, by Country 2019 & 2032
- Table 16: Global Crime Risk Report Industry Volume K Unit Forecast, by Country 2019 & 2032
- Table 17: Global Crime Risk Report Industry Revenue Million Forecast, by Country 2019 & 2032
- Table 18: Global Crime Risk Report Industry Volume K Unit Forecast, by Country 2019 & 2032
- Table 19: Global Crime Risk Report Industry Revenue Million Forecast, by Country 2019 & 2032
- Table 20: Global Crime Risk Report Industry Volume K Unit Forecast, by Country 2019 & 2032
- Table 21: Global Crime Risk Report Industry Revenue Million Forecast, by Deployment 2019 & 2032
- Table 22: Global Crime Risk Report Industry Volume K Unit Forecast, by Deployment 2019 & 2032
- Table 23: Global Crime Risk Report Industry Revenue Million Forecast, by Application 2019 & 2032
- Table 24: Global Crime Risk Report Industry Volume K Unit Forecast, by Application 2019 & 2032
- Table 25: Global Crime Risk Report Industry Revenue Million Forecast, by Country 2019 & 2032
- Table 26: Global Crime Risk Report Industry Volume K Unit Forecast, by Country 2019 & 2032
- Table 27: United States Crime Risk Report Industry Revenue (Million) Forecast, by Application 2019 & 2032
- Table 28: United States Crime Risk Report Industry Volume (K Unit) Forecast, by Application 2019 & 2032
- Table 29: Canada Crime Risk Report Industry Revenue (Million) Forecast, by Application 2019 & 2032
- Table 30: Canada Crime Risk Report Industry Volume (K Unit) Forecast, by Application 2019 & 2032
- Table 31: Global Crime Risk Report Industry Revenue Million Forecast, by Deployment 2019 & 2032
- Table 32: Global Crime Risk Report Industry Volume K Unit Forecast, by Deployment 2019 & 2032
- Table 33: Global Crime Risk Report Industry Revenue Million Forecast, by Application 2019 & 2032
- Table 34: Global Crime Risk Report Industry Volume K Unit Forecast, by Application 2019 & 2032
- Table 35: Global Crime Risk Report Industry Revenue Million Forecast, by Country 2019 & 2032
- Table 36: Global Crime Risk Report Industry Volume K Unit Forecast, by Country 2019 & 2032
- Table 37: Germany Crime Risk Report Industry Revenue (Million) Forecast, by Application 2019 & 2032
- Table 38: Germany Crime Risk Report Industry Volume (K Unit) Forecast, by Application 2019 & 2032
- Table 39: United Kingdom Crime Risk Report Industry Revenue (Million) Forecast, by Application 2019 & 2032
- Table 40: United Kingdom Crime Risk Report Industry Volume (K Unit) Forecast, by Application 2019 & 2032
- Table 41: Rest of Europe Crime Risk Report Industry Revenue (Million) Forecast, by Application 2019 & 2032
- Table 42: Rest of Europe Crime Risk Report Industry Volume (K Unit) Forecast, by Application 2019 & 2032
- Table 43: Global Crime Risk Report Industry Revenue Million Forecast, by Deployment 2019 & 2032
- Table 44: Global Crime Risk Report Industry Volume K Unit Forecast, by Deployment 2019 & 2032
- Table 45: Global Crime Risk Report Industry Revenue Million Forecast, by Application 2019 & 2032
- Table 46: Global Crime Risk Report Industry Volume K Unit Forecast, by Application 2019 & 2032
- Table 47: Global Crime Risk Report Industry Revenue Million Forecast, by Country 2019 & 2032
- Table 48: Global Crime Risk Report Industry Volume K Unit Forecast, by Country 2019 & 2032
- Table 49: China Crime Risk Report Industry Revenue (Million) Forecast, by Application 2019 & 2032
- Table 50: China Crime Risk Report Industry Volume (K Unit) Forecast, by Application 2019 & 2032
- Table 51: Japan Crime Risk Report Industry Revenue (Million) Forecast, by Application 2019 & 2032
- Table 52: Japan Crime Risk Report Industry Volume (K Unit) Forecast, by Application 2019 & 2032
- Table 53: India Crime Risk Report Industry Revenue (Million) Forecast, by Application 2019 & 2032
- Table 54: India Crime Risk Report Industry Volume (K Unit) Forecast, by Application 2019 & 2032
- Table 55: Rest of Asia Pacific Crime Risk Report Industry Revenue (Million) Forecast, by Application 2019 & 2032
- Table 56: Rest of Asia Pacific Crime Risk Report Industry Volume (K Unit) Forecast, by Application 2019 & 2032
- Table 57: Global Crime Risk Report Industry Revenue Million Forecast, by Deployment 2019 & 2032
- Table 58: Global Crime Risk Report Industry Volume K Unit Forecast, by Deployment 2019 & 2032
- Table 59: Global Crime Risk Report Industry Revenue Million Forecast, by Application 2019 & 2032
- Table 60: Global Crime Risk Report Industry Volume K Unit Forecast, by Application 2019 & 2032
- Table 61: Global Crime Risk Report Industry Revenue Million Forecast, by Country 2019 & 2032
- Table 62: Global Crime Risk Report Industry Volume K Unit Forecast, by Country 2019 & 2032
- Table 63: Latin America Crime Risk Report Industry Revenue (Million) Forecast, by Application 2019 & 2032
- Table 64: Latin America Crime Risk Report Industry Volume (K Unit) Forecast, by Application 2019 & 2032
- Table 65: Middle East Crime Risk Report Industry Revenue (Million) Forecast, by Application 2019 & 2032
- Table 66: Middle East Crime Risk Report Industry Volume (K Unit) Forecast, by Application 2019 & 2032
Frequently Asked Questions
1. What is the projected Compound Annual Growth Rate (CAGR) of the Crime Risk Report Industry?
The projected CAGR is approximately 16.00%.
2. Which companies are prominent players in the Crime Risk Report Industry?
Key companies in the market include Mphasis Limited, Fenergo Ltd, Fiserv Inc, CoreLogic Inc, Capco, Refinitiv US Holdings Inc, RiskScreen (KYC Global Technologies), IBM Corp, NICE Ltd, Oracle Corporation, ACI Worldwide Inc.
3. What are the main segments of the Crime Risk Report Industry?
The market segments include Deployment, Application.
4. Can you provide details about the market size?
The market size is estimated to be USD XX Million as of 2022.
5. What are some drivers contributing to market growth?
; Increased Digitalization in Banking Sector; Concern for Data Security and Fraud Detection.
6. What are the notable trends driving market growth?
Growth in Digitalization and Cloud Adoption is Influencing the Market Demand.
7. Are there any restraints impacting market growth?
; Sceptical View on Data Privacy.
8. Can you provide examples of recent developments in the market?
N/A
9. What pricing options are available for accessing the report?
Pricing options include single-user, multi-user, and enterprise licenses priced at USD 4750, USD 5250, and USD 8750 respectively.
10. Is the market size provided in terms of value or volume?
The market size is provided in terms of value, measured in Million and volume, measured in K Unit.
11. Are there any specific market keywords associated with the report?
Yes, the market keyword associated with the report is "Crime Risk Report Industry," which aids in identifying and referencing the specific market segment covered.
12. How do I determine which pricing option suits my needs best?
The pricing options vary based on user requirements and access needs. Individual users may opt for single-user licenses, while businesses requiring broader access may choose multi-user or enterprise licenses for cost-effective access to the report.
13. Are there any additional resources or data provided in the Crime Risk Report Industry report?
While the report offers comprehensive insights, it's advisable to review the specific contents or supplementary materials provided to ascertain if additional resources or data are available.
14. How can I stay updated on further developments or reports in the Crime Risk Report Industry?
To stay informed about further developments, trends, and reports in the Crime Risk Report Industry, consider subscribing to industry newsletters, following relevant companies and organizations, or regularly checking reputable industry news sources and publications.
Methodology
Step 1 - Identification of Relevant Samples Size from Population Database


Step 2 - Approaches for Defining Global Market Size (Value, Volume* & Price*)

Note*: In applicable scenarios
Step 3 - Data Sources
Primary Research
- Web Analytics
- Survey Reports
- Research Institute
- Latest Research Reports
- Opinion Leaders
Secondary Research
- Annual Reports
- White Paper
- Latest Press Release
- Industry Association
- Paid Database
- Investor Presentations

Step 4 - Data Triangulation
Involves using different sources of information in order to increase the validity of a study
These sources are likely to be stakeholders in a program - participants, other researchers, program staff, other community members, and so on.
Then we put all data in single framework & apply various statistical tools to find out the dynamic on the market.
During the analysis stage, feedback from the stakeholder groups would be compared to determine areas of agreement as well as areas of divergence
