

Key Insights
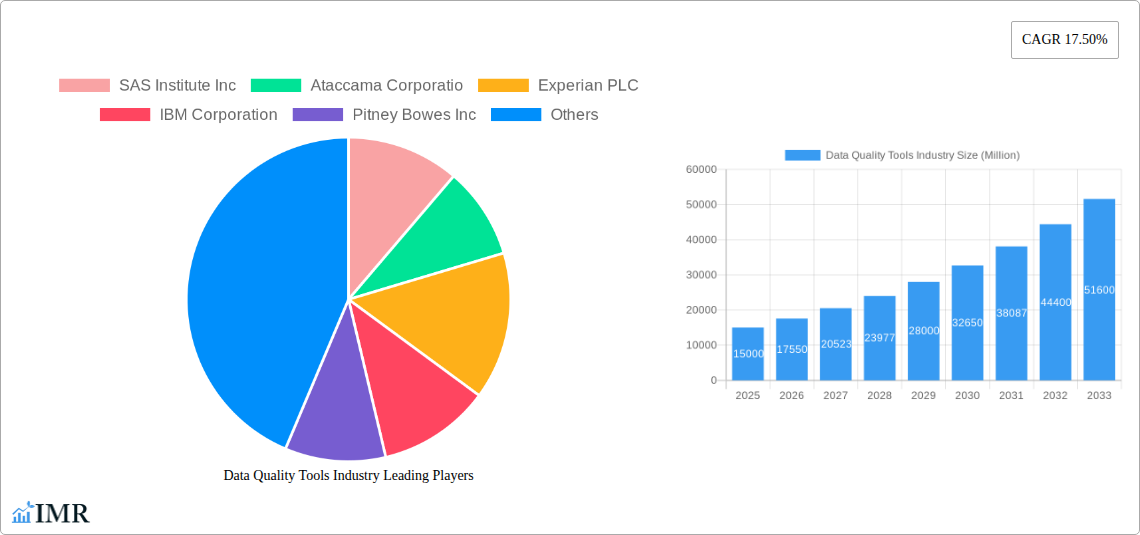
The Data Quality Tools market is experiencing robust growth, projected to reach a substantial size by 2033, driven by a compound annual growth rate (CAGR) of 17.50% from 2025 to 2033. This expansion is fueled by several key factors. The increasing volume and complexity of data generated across various industries necessitate robust data quality management solutions. Businesses across sectors, including BFSI, government, IT & Telecom, retail, and healthcare, are prioritizing data quality to improve decision-making, enhance operational efficiency, and comply with stringent regulatory requirements. The shift towards cloud-based deployments offers scalability and cost-effectiveness, further accelerating market growth. Furthermore, the rising adoption of advanced analytics and big data technologies requires high-quality data as a foundational element, fueling demand for sophisticated data quality tools. The market is segmented by deployment type (cloud-based and on-premise), organization size (SMEs and large enterprises), component (software and services), and end-user vertical, providing a detailed view of growth opportunities across different segments. Large enterprises currently dominate the market share due to their higher investment capacity in data quality initiatives. However, the SME segment is anticipated to witness significant growth in the coming years, driven by the increasing awareness of data quality's importance and the availability of cost-effective cloud-based solutions.
The competitive landscape is characterized by a mix of established players and emerging vendors. Companies such as SAS Institute Inc., Informatica LLC, and IBM Corporation are leading the market with their comprehensive data quality solutions. However, several smaller, specialized vendors are also gaining traction by focusing on niche areas or offering innovative solutions. Geographic growth is expected to be diverse, with North America and Europe maintaining significant market shares initially, followed by robust expansion in the Asia-Pacific region driven by rapid digitalization and economic growth in countries like China and India. While the market faces challenges such as the complexity of implementing data quality solutions and the high initial investment costs, the overall long-term outlook remains highly positive due to the indispensable nature of high-quality data in the contemporary digital economy.
Data Quality Tools Market: A Comprehensive Report (2019-2033)
This comprehensive report provides an in-depth analysis of the Data Quality Tools market, encompassing market dynamics, growth trends, regional segmentation, product landscape, key players, and future outlook. The study period spans from 2019 to 2033, with 2025 serving as the base and estimated year. The forecast period is 2025-2033, and the historical period covers 2019-2024. This report is crucial for industry professionals, investors, and businesses seeking to understand and capitalize on opportunities within this rapidly evolving market. The total market size in 2025 is estimated at xx Million.
Data Quality Tools Industry Market Dynamics & Structure
The Data Quality Tools market is characterized by a moderately concentrated landscape, with several major players holding significant market share. However, the market is witnessing increasing competition from smaller, specialized vendors offering innovative solutions. Technological advancements, particularly in areas like AI and machine learning, are driving significant innovation, enabling more robust and efficient data quality tools. Regulatory frameworks, such as GDPR and CCPA, are further shaping market dynamics by emphasizing data privacy and compliance. The market also sees competitive pressure from substitute solutions, including manual data cleaning processes and less sophisticated data management tools. End-user demographics are shifting, with a growing demand from SMEs and larger enterprises across diverse verticals. M&A activity in this space has been moderate, primarily focused on enhancing capabilities and expanding market reach. The market value in 2024 is estimated at xx Million.
- Market Concentration: Moderately concentrated, with top 10 players holding approximately xx% market share in 2024.
- Technological Innovation: Driven by AI, machine learning, and automation, leading to improved accuracy and efficiency.
- Regulatory Landscape: GDPR, CCPA, and other regulations are increasing the demand for robust data quality tools.
- Competitive Substitutes: Manual data cleaning and basic data management tools present alternative (but less efficient) options.
- M&A Activity: Moderate activity focused on technology acquisition and market expansion. xx deals were recorded in 2024.
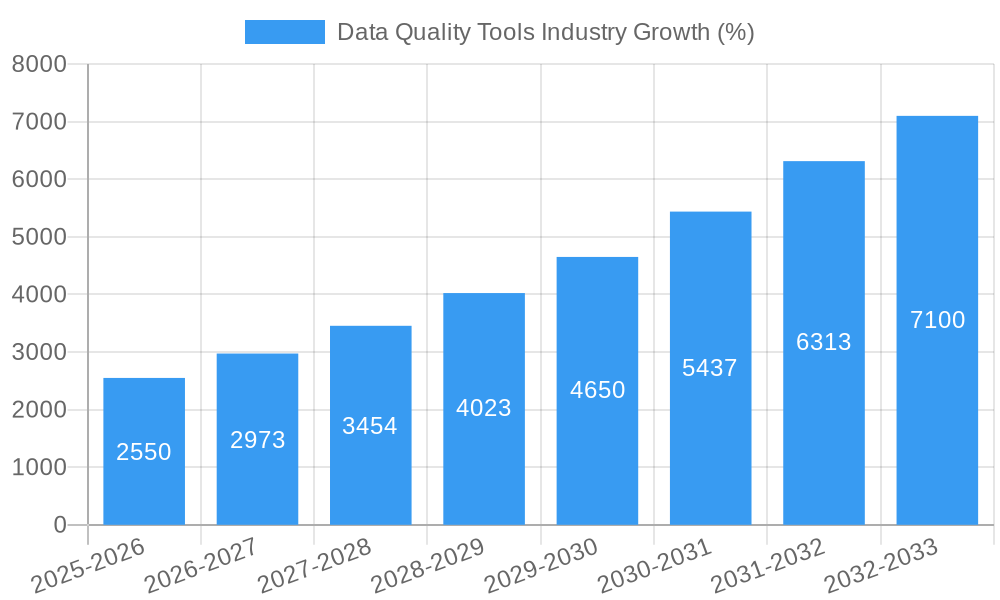
Data Quality Tools Industry Growth Trends & Insights
The Data Quality Tools market exhibits a robust growth trajectory, driven by the exponential growth of data volume and the increasing need for accurate, reliable data across various industries. The market size is projected to experience a CAGR of xx% during the forecast period (2025-2033), reaching an estimated xx Million by 2033. Adoption rates are increasing steadily, particularly among large enterprises and across sectors like BFSI and healthcare, fueled by stringent regulatory compliance requirements and the need for data-driven decision-making. Technological disruptions, such as the rise of cloud-based solutions and AI-powered tools, are further accelerating market growth. Consumer behavior shifts towards data-driven insights are also driving demand. Market penetration is expected to reach xx% by 2033.
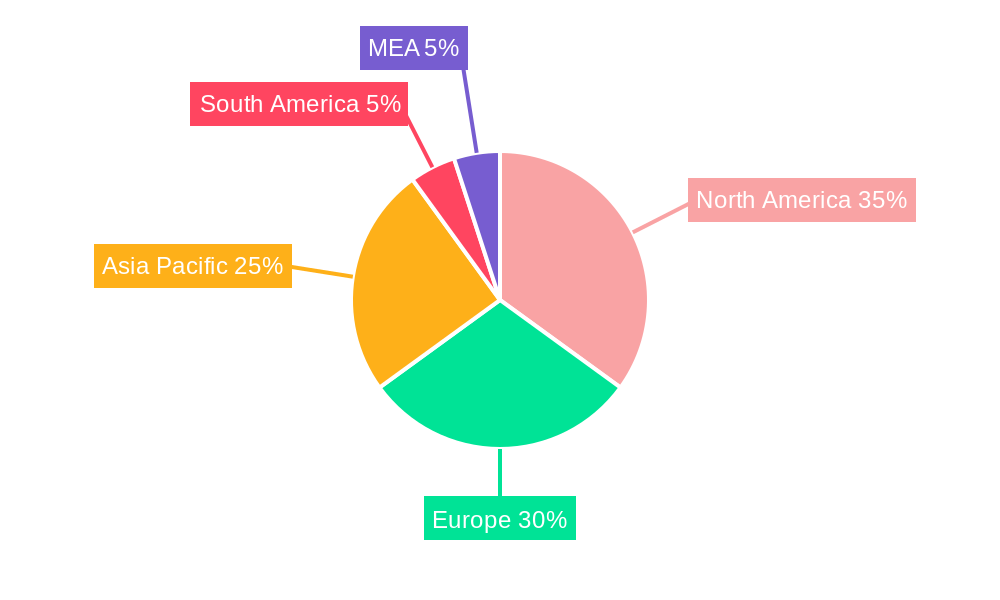
Dominant Regions, Countries, or Segments in Data Quality Tools Industry
The North American region currently dominates the Data Quality Tools market, driven by high technological adoption rates, strong regulatory frameworks, and a large number of data-intensive industries. However, the Asia-Pacific region is projected to witness the fastest growth rate during the forecast period, fueled by rapid digitalization and increasing investment in data infrastructure.
By Deployment Type: The cloud-based segment holds a significant market share and is expected to experience substantial growth due to its scalability, cost-effectiveness, and ease of access.
By Organization Size: Large enterprises are currently the largest consumers of data quality tools, owing to their extensive data needs. However, the SME segment is showing rapid growth as these businesses increasingly recognize the importance of data quality for operations.
By Component: The software segment dominates, but the services segment is experiencing significant growth, driven by the increasing demand for customization, implementation, and support services.
By End-user Vertical: The BFSI and healthcare sectors are major drivers of market growth, due to their stringent data security and compliance requirements and their increasing reliance on data analytics.
- North America: High adoption rates, robust regulatory environment, strong presence of major players.
- Asia-Pacific: Fastest-growing region, driven by digitalization and infrastructure development.
- Europe: Strong regulatory environment (GDPR) drives demand.
- Cloud-based Deployment: Leading segment due to scalability and cost-effectiveness.
- Large Enterprises: Largest consumer segment, followed by rapidly growing SMEs.
- BFSI and Healthcare: Key end-user verticals, due to regulatory needs and data-driven strategies.
Data Quality Tools Industry Product Landscape
Data quality tools are evolving rapidly, incorporating advanced technologies like AI and machine learning to automate data cleansing, profiling, and validation processes. These tools are increasingly integrated with other data management platforms and offer enhanced functionalities such as data governance, data lineage tracking, and real-time data monitoring. Key selling propositions include improved data accuracy, enhanced operational efficiency, reduced compliance risks, and better data-driven decision-making. Advancements include improved automation, better integration capabilities, and enhanced user interfaces for ease of use.
Key Drivers, Barriers & Challenges in Data Quality Tools Industry
Key Drivers:
- Increasing data volume and complexity.
- Growing need for regulatory compliance (GDPR, CCPA).
- Rising demand for data-driven decision-making.
- Technological advancements like AI and ML.
Key Barriers and Challenges:
- High initial investment costs for sophisticated tools.
- Complexity of implementation and integration.
- Lack of skilled professionals to manage and utilize data quality tools.
- Data security and privacy concerns. Estimated cost of data breaches due to poor data quality is xx Million annually.
Emerging Opportunities in Data Quality Tools Industry
- Growing demand for data quality tools in emerging markets.
- Increasing adoption of cloud-based solutions.
- Development of specialized data quality tools for specific industries (e.g., healthcare, finance).
- Growing integration of data quality tools with other data management solutions. The market for integrated solutions is projected to grow by xx% annually.
Growth Accelerators in the Data Quality Tools Industry
Technological advancements, particularly the integration of AI and ML into data quality tools, are driving significant growth. Strategic partnerships between data quality tool vendors and data management platform providers are expanding market reach and enhancing product offerings. Expansion into new geographic markets, particularly in developing economies, presents significant opportunities for growth. Increased focus on data governance and compliance regulations further accelerates market expansion.
Key Players Shaping the Data Quality Tools Industry Market
- SAS Institute Inc
- Ataccama Corporatio
- Experian PLC
- IBM Corporation
- Pitney Bowes Inc
- Information Builders Inc
- Syncsort Inc
- Oracle Corporation
- Informatica LLC
- Talend Inc
- SAP SE
Notable Milestones in Data Quality Tools Industry Sector
- September 2022: DataCebo launches Synthetic Data (SD) Metrics, enhancing synthetic data quality assessment.
- May 2022: Pyramid Analytics secures USD 120 million in Series E funding, boosting development of its AI-powered decision intelligence platform.
In-Depth Data Quality Tools Industry Market Outlook
The Data Quality Tools market is poised for sustained growth, driven by the continued expansion of data volume and complexity, coupled with increasing regulatory scrutiny and a heightened need for data-driven decision-making. Strategic investments in AI and ML technologies will continue to enhance the capabilities of data quality tools, attracting new customers and expanding market penetration. The untapped potential in emerging markets and the growing demand for integrated solutions offer significant long-term growth opportunities for established players and new entrants alike. The market is projected to reach xx Million by 2033, representing significant potential for investors and businesses.
Data Quality Tools Industry Segmentation
-
1. Deployment Type
- 1.1. Cloud-based
- 1.2. On Premise
-
2. Size of the Organization
- 2.1. Small and Medium Enterprises
- 2.2. Large Enterprises
-
3. Component
- 3.1. Software
- 3.2. Services
-
4. End-user Vertical
- 4.1. BFSI
- 4.2. Government
- 4.3. IT & Telecom
- 4.4. Retail and E-commerce
- 4.5. Healthcare
- 4.6. Other End-user Industries
Data Quality Tools Industry Segmentation By Geography
- 1. North America
- 2. Europe
- 3. Asia Pacific
- 4. Latin America
- 5. Middle East and Africa
Data Quality Tools Industry REPORT HIGHLIGHTS
| Aspects | Details |
|---|---|
| Study Period | 2019-2033 |
| Base Year | 2024 |
| Estimated Year | 2025 |
| Forecast Period | 2025-2033 |
| Historical Period | 2019-2024 |
| Growth Rate | CAGR of 17.50% from 2019-2033 |
| Segmentation |
|
Table of Contents
- 1. Introduction
- 1.1. Research Scope
- 1.2. Market Segmentation
- 1.3. Research Methodology
- 1.4. Definitions and Assumptions
- 2. Executive Summary
- 2.1. Introduction
- 3. Market Dynamics
- 3.1. Introduction
- 3.2. Market Drivers
- 3.2.1. Increasing Use of External Data Sources Owing to Mobile Connectivity Growth
- 3.3. Market Restrains
- 3.3.1. Lack of information and Awareness about the Solutions Among Potential Users
- 3.4. Market Trends
- 3.4.1. Healthcare is Expected to Witness Significant Growth
- 4. Market Factor Analysis
- 4.1. Porters Five Forces
- 4.2. Supply/Value Chain
- 4.3. PESTEL analysis
- 4.4. Market Entropy
- 4.5. Patent/Trademark Analysis
- 5. Global Data Quality Tools Industry Analysis, Insights and Forecast, 2019-2031
- 5.1. Market Analysis, Insights and Forecast - by Deployment Type
- 5.1.1. Cloud-based
- 5.1.2. On Premise
- 5.2. Market Analysis, Insights and Forecast - by Size of the Organization
- 5.2.1. Small and Medium Enterprises
- 5.2.2. Large Enterprises
- 5.3. Market Analysis, Insights and Forecast - by Component
- 5.3.1. Software
- 5.3.2. Services
- 5.4. Market Analysis, Insights and Forecast - by End-user Vertical
- 5.4.1. BFSI
- 5.4.2. Government
- 5.4.3. IT & Telecom
- 5.4.4. Retail and E-commerce
- 5.4.5. Healthcare
- 5.4.6. Other End-user Industries
- 5.5. Market Analysis, Insights and Forecast - by Region
- 5.5.1. North America
- 5.5.2. Europe
- 5.5.3. Asia Pacific
- 5.5.4. Latin America
- 5.5.5. Middle East and Africa
- 5.1. Market Analysis, Insights and Forecast - by Deployment Type
- 6. North America Data Quality Tools Industry Analysis, Insights and Forecast, 2019-2031
- 6.1. Market Analysis, Insights and Forecast - by Deployment Type
- 6.1.1. Cloud-based
- 6.1.2. On Premise
- 6.2. Market Analysis, Insights and Forecast - by Size of the Organization
- 6.2.1. Small and Medium Enterprises
- 6.2.2. Large Enterprises
- 6.3. Market Analysis, Insights and Forecast - by Component
- 6.3.1. Software
- 6.3.2. Services
- 6.4. Market Analysis, Insights and Forecast - by End-user Vertical
- 6.4.1. BFSI
- 6.4.2. Government
- 6.4.3. IT & Telecom
- 6.4.4. Retail and E-commerce
- 6.4.5. Healthcare
- 6.4.6. Other End-user Industries
- 6.1. Market Analysis, Insights and Forecast - by Deployment Type
- 7. Europe Data Quality Tools Industry Analysis, Insights and Forecast, 2019-2031
- 7.1. Market Analysis, Insights and Forecast - by Deployment Type
- 7.1.1. Cloud-based
- 7.1.2. On Premise
- 7.2. Market Analysis, Insights and Forecast - by Size of the Organization
- 7.2.1. Small and Medium Enterprises
- 7.2.2. Large Enterprises
- 7.3. Market Analysis, Insights and Forecast - by Component
- 7.3.1. Software
- 7.3.2. Services
- 7.4. Market Analysis, Insights and Forecast - by End-user Vertical
- 7.4.1. BFSI
- 7.4.2. Government
- 7.4.3. IT & Telecom
- 7.4.4. Retail and E-commerce
- 7.4.5. Healthcare
- 7.4.6. Other End-user Industries
- 7.1. Market Analysis, Insights and Forecast - by Deployment Type
- 8. Asia Pacific Data Quality Tools Industry Analysis, Insights and Forecast, 2019-2031
- 8.1. Market Analysis, Insights and Forecast - by Deployment Type
- 8.1.1. Cloud-based
- 8.1.2. On Premise
- 8.2. Market Analysis, Insights and Forecast - by Size of the Organization
- 8.2.1. Small and Medium Enterprises
- 8.2.2. Large Enterprises
- 8.3. Market Analysis, Insights and Forecast - by Component
- 8.3.1. Software
- 8.3.2. Services
- 8.4. Market Analysis, Insights and Forecast - by End-user Vertical
- 8.4.1. BFSI
- 8.4.2. Government
- 8.4.3. IT & Telecom
- 8.4.4. Retail and E-commerce
- 8.4.5. Healthcare
- 8.4.6. Other End-user Industries
- 8.1. Market Analysis, Insights and Forecast - by Deployment Type
- 9. Latin America Data Quality Tools Industry Analysis, Insights and Forecast, 2019-2031
- 9.1. Market Analysis, Insights and Forecast - by Deployment Type
- 9.1.1. Cloud-based
- 9.1.2. On Premise
- 9.2. Market Analysis, Insights and Forecast - by Size of the Organization
- 9.2.1. Small and Medium Enterprises
- 9.2.2. Large Enterprises
- 9.3. Market Analysis, Insights and Forecast - by Component
- 9.3.1. Software
- 9.3.2. Services
- 9.4. Market Analysis, Insights and Forecast - by End-user Vertical
- 9.4.1. BFSI
- 9.4.2. Government
- 9.4.3. IT & Telecom
- 9.4.4. Retail and E-commerce
- 9.4.5. Healthcare
- 9.4.6. Other End-user Industries
- 9.1. Market Analysis, Insights and Forecast - by Deployment Type
- 10. Middle East and Africa Data Quality Tools Industry Analysis, Insights and Forecast, 2019-2031
- 10.1. Market Analysis, Insights and Forecast - by Deployment Type
- 10.1.1. Cloud-based
- 10.1.2. On Premise
- 10.2. Market Analysis, Insights and Forecast - by Size of the Organization
- 10.2.1. Small and Medium Enterprises
- 10.2.2. Large Enterprises
- 10.3. Market Analysis, Insights and Forecast - by Component
- 10.3.1. Software
- 10.3.2. Services
- 10.4. Market Analysis, Insights and Forecast - by End-user Vertical
- 10.4.1. BFSI
- 10.4.2. Government
- 10.4.3. IT & Telecom
- 10.4.4. Retail and E-commerce
- 10.4.5. Healthcare
- 10.4.6. Other End-user Industries
- 10.1. Market Analysis, Insights and Forecast - by Deployment Type
- 11. North America Data Quality Tools Industry Analysis, Insights and Forecast, 2019-2031
- 11.1. Market Analysis, Insights and Forecast - By Country/Sub-region
- 11.1.1 United States
- 11.1.2 Canada
- 11.1.3 Mexico
- 12. Europe Data Quality Tools Industry Analysis, Insights and Forecast, 2019-2031
- 12.1. Market Analysis, Insights and Forecast - By Country/Sub-region
- 12.1.1 Germany
- 12.1.2 United Kingdom
- 12.1.3 France
- 12.1.4 Spain
- 12.1.5 Italy
- 12.1.6 Spain
- 12.1.7 Belgium
- 12.1.8 Netherland
- 12.1.9 Nordics
- 12.1.10 Rest of Europe
- 13. Asia Pacific Data Quality Tools Industry Analysis, Insights and Forecast, 2019-2031
- 13.1. Market Analysis, Insights and Forecast - By Country/Sub-region
- 13.1.1 China
- 13.1.2 Japan
- 13.1.3 India
- 13.1.4 South Korea
- 13.1.5 Southeast Asia
- 13.1.6 Australia
- 13.1.7 Indonesia
- 13.1.8 Phillipes
- 13.1.9 Singapore
- 13.1.10 Thailandc
- 13.1.11 Rest of Asia Pacific
- 14. South America Data Quality Tools Industry Analysis, Insights and Forecast, 2019-2031
- 14.1. Market Analysis, Insights and Forecast - By Country/Sub-region
- 14.1.1 Brazil
- 14.1.2 Argentina
- 14.1.3 Peru
- 14.1.4 Chile
- 14.1.5 Colombia
- 14.1.6 Ecuador
- 14.1.7 Venezuela
- 14.1.8 Rest of South America
- 15. North America Data Quality Tools Industry Analysis, Insights and Forecast, 2019-2031
- 15.1. Market Analysis, Insights and Forecast - By Country/Sub-region
- 15.1.1 United States
- 15.1.2 Canada
- 15.1.3 Mexico
- 16. MEA Data Quality Tools Industry Analysis, Insights and Forecast, 2019-2031
- 16.1. Market Analysis, Insights and Forecast - By Country/Sub-region
- 16.1.1 United Arab Emirates
- 16.1.2 Saudi Arabia
- 16.1.3 South Africa
- 16.1.4 Rest of Middle East and Africa
- 17. Competitive Analysis
- 17.1. Global Market Share Analysis 2024
- 17.2. Company Profiles
- 17.2.1 SAS Institute Inc
- 17.2.1.1. Overview
- 17.2.1.2. Products
- 17.2.1.3. SWOT Analysis
- 17.2.1.4. Recent Developments
- 17.2.1.5. Financials (Based on Availability)
- 17.2.2 Ataccama Corporatio
- 17.2.2.1. Overview
- 17.2.2.2. Products
- 17.2.2.3. SWOT Analysis
- 17.2.2.4. Recent Developments
- 17.2.2.5. Financials (Based on Availability)
- 17.2.3 Experian PLC
- 17.2.3.1. Overview
- 17.2.3.2. Products
- 17.2.3.3. SWOT Analysis
- 17.2.3.4. Recent Developments
- 17.2.3.5. Financials (Based on Availability)
- 17.2.4 IBM Corporation
- 17.2.4.1. Overview
- 17.2.4.2. Products
- 17.2.4.3. SWOT Analysis
- 17.2.4.4. Recent Developments
- 17.2.4.5. Financials (Based on Availability)
- 17.2.5 Pitney Bowes Inc
- 17.2.5.1. Overview
- 17.2.5.2. Products
- 17.2.5.3. SWOT Analysis
- 17.2.5.4. Recent Developments
- 17.2.5.5. Financials (Based on Availability)
- 17.2.6 Information Builders Inc
- 17.2.6.1. Overview
- 17.2.6.2. Products
- 17.2.6.3. SWOT Analysis
- 17.2.6.4. Recent Developments
- 17.2.6.5. Financials (Based on Availability)
- 17.2.7 Syncsort Inc
- 17.2.7.1. Overview
- 17.2.7.2. Products
- 17.2.7.3. SWOT Analysis
- 17.2.7.4. Recent Developments
- 17.2.7.5. Financials (Based on Availability)
- 17.2.8 Oracle Corporation
- 17.2.8.1. Overview
- 17.2.8.2. Products
- 17.2.8.3. SWOT Analysis
- 17.2.8.4. Recent Developments
- 17.2.8.5. Financials (Based on Availability)
- 17.2.9 Informatica LLC
- 17.2.9.1. Overview
- 17.2.9.2. Products
- 17.2.9.3. SWOT Analysis
- 17.2.9.4. Recent Developments
- 17.2.9.5. Financials (Based on Availability)
- 17.2.10 Talend Inc
- 17.2.10.1. Overview
- 17.2.10.2. Products
- 17.2.10.3. SWOT Analysis
- 17.2.10.4. Recent Developments
- 17.2.10.5. Financials (Based on Availability)
- 17.2.11 SAP SE
- 17.2.11.1. Overview
- 17.2.11.2. Products
- 17.2.11.3. SWOT Analysis
- 17.2.11.4. Recent Developments
- 17.2.11.5. Financials (Based on Availability)
- 17.2.1 SAS Institute Inc
List of Figures
- Figure 1: Global Data Quality Tools Industry Revenue Breakdown (Million, %) by Region 2024 & 2032
- Figure 2: North America Data Quality Tools Industry Revenue (Million), by Country 2024 & 2032
- Figure 3: North America Data Quality Tools Industry Revenue Share (%), by Country 2024 & 2032
- Figure 4: Europe Data Quality Tools Industry Revenue (Million), by Country 2024 & 2032
- Figure 5: Europe Data Quality Tools Industry Revenue Share (%), by Country 2024 & 2032
- Figure 6: Asia Pacific Data Quality Tools Industry Revenue (Million), by Country 2024 & 2032
- Figure 7: Asia Pacific Data Quality Tools Industry Revenue Share (%), by Country 2024 & 2032
- Figure 8: South America Data Quality Tools Industry Revenue (Million), by Country 2024 & 2032
- Figure 9: South America Data Quality Tools Industry Revenue Share (%), by Country 2024 & 2032
- Figure 10: North America Data Quality Tools Industry Revenue (Million), by Country 2024 & 2032
- Figure 11: North America Data Quality Tools Industry Revenue Share (%), by Country 2024 & 2032
- Figure 12: MEA Data Quality Tools Industry Revenue (Million), by Country 2024 & 2032
- Figure 13: MEA Data Quality Tools Industry Revenue Share (%), by Country 2024 & 2032
- Figure 14: North America Data Quality Tools Industry Revenue (Million), by Deployment Type 2024 & 2032
- Figure 15: North America Data Quality Tools Industry Revenue Share (%), by Deployment Type 2024 & 2032
- Figure 16: North America Data Quality Tools Industry Revenue (Million), by Size of the Organization 2024 & 2032
- Figure 17: North America Data Quality Tools Industry Revenue Share (%), by Size of the Organization 2024 & 2032
- Figure 18: North America Data Quality Tools Industry Revenue (Million), by Component 2024 & 2032
- Figure 19: North America Data Quality Tools Industry Revenue Share (%), by Component 2024 & 2032
- Figure 20: North America Data Quality Tools Industry Revenue (Million), by End-user Vertical 2024 & 2032
- Figure 21: North America Data Quality Tools Industry Revenue Share (%), by End-user Vertical 2024 & 2032
- Figure 22: North America Data Quality Tools Industry Revenue (Million), by Country 2024 & 2032
- Figure 23: North America Data Quality Tools Industry Revenue Share (%), by Country 2024 & 2032
- Figure 24: Europe Data Quality Tools Industry Revenue (Million), by Deployment Type 2024 & 2032
- Figure 25: Europe Data Quality Tools Industry Revenue Share (%), by Deployment Type 2024 & 2032
- Figure 26: Europe Data Quality Tools Industry Revenue (Million), by Size of the Organization 2024 & 2032
- Figure 27: Europe Data Quality Tools Industry Revenue Share (%), by Size of the Organization 2024 & 2032
- Figure 28: Europe Data Quality Tools Industry Revenue (Million), by Component 2024 & 2032
- Figure 29: Europe Data Quality Tools Industry Revenue Share (%), by Component 2024 & 2032
- Figure 30: Europe Data Quality Tools Industry Revenue (Million), by End-user Vertical 2024 & 2032
- Figure 31: Europe Data Quality Tools Industry Revenue Share (%), by End-user Vertical 2024 & 2032
- Figure 32: Europe Data Quality Tools Industry Revenue (Million), by Country 2024 & 2032
- Figure 33: Europe Data Quality Tools Industry Revenue Share (%), by Country 2024 & 2032
- Figure 34: Asia Pacific Data Quality Tools Industry Revenue (Million), by Deployment Type 2024 & 2032
- Figure 35: Asia Pacific Data Quality Tools Industry Revenue Share (%), by Deployment Type 2024 & 2032
- Figure 36: Asia Pacific Data Quality Tools Industry Revenue (Million), by Size of the Organization 2024 & 2032
- Figure 37: Asia Pacific Data Quality Tools Industry Revenue Share (%), by Size of the Organization 2024 & 2032
- Figure 38: Asia Pacific Data Quality Tools Industry Revenue (Million), by Component 2024 & 2032
- Figure 39: Asia Pacific Data Quality Tools Industry Revenue Share (%), by Component 2024 & 2032
- Figure 40: Asia Pacific Data Quality Tools Industry Revenue (Million), by End-user Vertical 2024 & 2032
- Figure 41: Asia Pacific Data Quality Tools Industry Revenue Share (%), by End-user Vertical 2024 & 2032
- Figure 42: Asia Pacific Data Quality Tools Industry Revenue (Million), by Country 2024 & 2032
- Figure 43: Asia Pacific Data Quality Tools Industry Revenue Share (%), by Country 2024 & 2032
- Figure 44: Latin America Data Quality Tools Industry Revenue (Million), by Deployment Type 2024 & 2032
- Figure 45: Latin America Data Quality Tools Industry Revenue Share (%), by Deployment Type 2024 & 2032
- Figure 46: Latin America Data Quality Tools Industry Revenue (Million), by Size of the Organization 2024 & 2032
- Figure 47: Latin America Data Quality Tools Industry Revenue Share (%), by Size of the Organization 2024 & 2032
- Figure 48: Latin America Data Quality Tools Industry Revenue (Million), by Component 2024 & 2032
- Figure 49: Latin America Data Quality Tools Industry Revenue Share (%), by Component 2024 & 2032
- Figure 50: Latin America Data Quality Tools Industry Revenue (Million), by End-user Vertical 2024 & 2032
- Figure 51: Latin America Data Quality Tools Industry Revenue Share (%), by End-user Vertical 2024 & 2032
- Figure 52: Latin America Data Quality Tools Industry Revenue (Million), by Country 2024 & 2032
- Figure 53: Latin America Data Quality Tools Industry Revenue Share (%), by Country 2024 & 2032
- Figure 54: Middle East and Africa Data Quality Tools Industry Revenue (Million), by Deployment Type 2024 & 2032
- Figure 55: Middle East and Africa Data Quality Tools Industry Revenue Share (%), by Deployment Type 2024 & 2032
- Figure 56: Middle East and Africa Data Quality Tools Industry Revenue (Million), by Size of the Organization 2024 & 2032
- Figure 57: Middle East and Africa Data Quality Tools Industry Revenue Share (%), by Size of the Organization 2024 & 2032
- Figure 58: Middle East and Africa Data Quality Tools Industry Revenue (Million), by Component 2024 & 2032
- Figure 59: Middle East and Africa Data Quality Tools Industry Revenue Share (%), by Component 2024 & 2032
- Figure 60: Middle East and Africa Data Quality Tools Industry Revenue (Million), by End-user Vertical 2024 & 2032
- Figure 61: Middle East and Africa Data Quality Tools Industry Revenue Share (%), by End-user Vertical 2024 & 2032
- Figure 62: Middle East and Africa Data Quality Tools Industry Revenue (Million), by Country 2024 & 2032
- Figure 63: Middle East and Africa Data Quality Tools Industry Revenue Share (%), by Country 2024 & 2032
List of Tables
- Table 1: Global Data Quality Tools Industry Revenue Million Forecast, by Region 2019 & 2032
- Table 2: Global Data Quality Tools Industry Revenue Million Forecast, by Deployment Type 2019 & 2032
- Table 3: Global Data Quality Tools Industry Revenue Million Forecast, by Size of the Organization 2019 & 2032
- Table 4: Global Data Quality Tools Industry Revenue Million Forecast, by Component 2019 & 2032
- Table 5: Global Data Quality Tools Industry Revenue Million Forecast, by End-user Vertical 2019 & 2032
- Table 6: Global Data Quality Tools Industry Revenue Million Forecast, by Region 2019 & 2032
- Table 7: Global Data Quality Tools Industry Revenue Million Forecast, by Country 2019 & 2032
- Table 8: United States Data Quality Tools Industry Revenue (Million) Forecast, by Application 2019 & 2032
- Table 9: Canada Data Quality Tools Industry Revenue (Million) Forecast, by Application 2019 & 2032
- Table 10: Mexico Data Quality Tools Industry Revenue (Million) Forecast, by Application 2019 & 2032
- Table 11: Global Data Quality Tools Industry Revenue Million Forecast, by Country 2019 & 2032
- Table 12: Germany Data Quality Tools Industry Revenue (Million) Forecast, by Application 2019 & 2032
- Table 13: United Kingdom Data Quality Tools Industry Revenue (Million) Forecast, by Application 2019 & 2032
- Table 14: France Data Quality Tools Industry Revenue (Million) Forecast, by Application 2019 & 2032
- Table 15: Spain Data Quality Tools Industry Revenue (Million) Forecast, by Application 2019 & 2032
- Table 16: Italy Data Quality Tools Industry Revenue (Million) Forecast, by Application 2019 & 2032
- Table 17: Spain Data Quality Tools Industry Revenue (Million) Forecast, by Application 2019 & 2032
- Table 18: Belgium Data Quality Tools Industry Revenue (Million) Forecast, by Application 2019 & 2032
- Table 19: Netherland Data Quality Tools Industry Revenue (Million) Forecast, by Application 2019 & 2032
- Table 20: Nordics Data Quality Tools Industry Revenue (Million) Forecast, by Application 2019 & 2032
- Table 21: Rest of Europe Data Quality Tools Industry Revenue (Million) Forecast, by Application 2019 & 2032
- Table 22: Global Data Quality Tools Industry Revenue Million Forecast, by Country 2019 & 2032
- Table 23: China Data Quality Tools Industry Revenue (Million) Forecast, by Application 2019 & 2032
- Table 24: Japan Data Quality Tools Industry Revenue (Million) Forecast, by Application 2019 & 2032
- Table 25: India Data Quality Tools Industry Revenue (Million) Forecast, by Application 2019 & 2032
- Table 26: South Korea Data Quality Tools Industry Revenue (Million) Forecast, by Application 2019 & 2032
- Table 27: Southeast Asia Data Quality Tools Industry Revenue (Million) Forecast, by Application 2019 & 2032
- Table 28: Australia Data Quality Tools Industry Revenue (Million) Forecast, by Application 2019 & 2032
- Table 29: Indonesia Data Quality Tools Industry Revenue (Million) Forecast, by Application 2019 & 2032
- Table 30: Phillipes Data Quality Tools Industry Revenue (Million) Forecast, by Application 2019 & 2032
- Table 31: Singapore Data Quality Tools Industry Revenue (Million) Forecast, by Application 2019 & 2032
- Table 32: Thailandc Data Quality Tools Industry Revenue (Million) Forecast, by Application 2019 & 2032
- Table 33: Rest of Asia Pacific Data Quality Tools Industry Revenue (Million) Forecast, by Application 2019 & 2032
- Table 34: Global Data Quality Tools Industry Revenue Million Forecast, by Country 2019 & 2032
- Table 35: Brazil Data Quality Tools Industry Revenue (Million) Forecast, by Application 2019 & 2032
- Table 36: Argentina Data Quality Tools Industry Revenue (Million) Forecast, by Application 2019 & 2032
- Table 37: Peru Data Quality Tools Industry Revenue (Million) Forecast, by Application 2019 & 2032
- Table 38: Chile Data Quality Tools Industry Revenue (Million) Forecast, by Application 2019 & 2032
- Table 39: Colombia Data Quality Tools Industry Revenue (Million) Forecast, by Application 2019 & 2032
- Table 40: Ecuador Data Quality Tools Industry Revenue (Million) Forecast, by Application 2019 & 2032
- Table 41: Venezuela Data Quality Tools Industry Revenue (Million) Forecast, by Application 2019 & 2032
- Table 42: Rest of South America Data Quality Tools Industry Revenue (Million) Forecast, by Application 2019 & 2032
- Table 43: Global Data Quality Tools Industry Revenue Million Forecast, by Country 2019 & 2032
- Table 44: United States Data Quality Tools Industry Revenue (Million) Forecast, by Application 2019 & 2032
- Table 45: Canada Data Quality Tools Industry Revenue (Million) Forecast, by Application 2019 & 2032
- Table 46: Mexico Data Quality Tools Industry Revenue (Million) Forecast, by Application 2019 & 2032
- Table 47: Global Data Quality Tools Industry Revenue Million Forecast, by Country 2019 & 2032
- Table 48: United Arab Emirates Data Quality Tools Industry Revenue (Million) Forecast, by Application 2019 & 2032
- Table 49: Saudi Arabia Data Quality Tools Industry Revenue (Million) Forecast, by Application 2019 & 2032
- Table 50: South Africa Data Quality Tools Industry Revenue (Million) Forecast, by Application 2019 & 2032
- Table 51: Rest of Middle East and Africa Data Quality Tools Industry Revenue (Million) Forecast, by Application 2019 & 2032
- Table 52: Global Data Quality Tools Industry Revenue Million Forecast, by Deployment Type 2019 & 2032
- Table 53: Global Data Quality Tools Industry Revenue Million Forecast, by Size of the Organization 2019 & 2032
- Table 54: Global Data Quality Tools Industry Revenue Million Forecast, by Component 2019 & 2032
- Table 55: Global Data Quality Tools Industry Revenue Million Forecast, by End-user Vertical 2019 & 2032
- Table 56: Global Data Quality Tools Industry Revenue Million Forecast, by Country 2019 & 2032
- Table 57: Global Data Quality Tools Industry Revenue Million Forecast, by Deployment Type 2019 & 2032
- Table 58: Global Data Quality Tools Industry Revenue Million Forecast, by Size of the Organization 2019 & 2032
- Table 59: Global Data Quality Tools Industry Revenue Million Forecast, by Component 2019 & 2032
- Table 60: Global Data Quality Tools Industry Revenue Million Forecast, by End-user Vertical 2019 & 2032
- Table 61: Global Data Quality Tools Industry Revenue Million Forecast, by Country 2019 & 2032
- Table 62: Global Data Quality Tools Industry Revenue Million Forecast, by Deployment Type 2019 & 2032
- Table 63: Global Data Quality Tools Industry Revenue Million Forecast, by Size of the Organization 2019 & 2032
- Table 64: Global Data Quality Tools Industry Revenue Million Forecast, by Component 2019 & 2032
- Table 65: Global Data Quality Tools Industry Revenue Million Forecast, by End-user Vertical 2019 & 2032
- Table 66: Global Data Quality Tools Industry Revenue Million Forecast, by Country 2019 & 2032
- Table 67: Global Data Quality Tools Industry Revenue Million Forecast, by Deployment Type 2019 & 2032
- Table 68: Global Data Quality Tools Industry Revenue Million Forecast, by Size of the Organization 2019 & 2032
- Table 69: Global Data Quality Tools Industry Revenue Million Forecast, by Component 2019 & 2032
- Table 70: Global Data Quality Tools Industry Revenue Million Forecast, by End-user Vertical 2019 & 2032
- Table 71: Global Data Quality Tools Industry Revenue Million Forecast, by Country 2019 & 2032
- Table 72: Global Data Quality Tools Industry Revenue Million Forecast, by Deployment Type 2019 & 2032
- Table 73: Global Data Quality Tools Industry Revenue Million Forecast, by Size of the Organization 2019 & 2032
- Table 74: Global Data Quality Tools Industry Revenue Million Forecast, by Component 2019 & 2032
- Table 75: Global Data Quality Tools Industry Revenue Million Forecast, by End-user Vertical 2019 & 2032
- Table 76: Global Data Quality Tools Industry Revenue Million Forecast, by Country 2019 & 2032
Frequently Asked Questions
1. What is the projected Compound Annual Growth Rate (CAGR) of the Data Quality Tools Industry?
The projected CAGR is approximately 17.50%.
2. Which companies are prominent players in the Data Quality Tools Industry?
Key companies in the market include SAS Institute Inc, Ataccama Corporatio, Experian PLC, IBM Corporation, Pitney Bowes Inc, Information Builders Inc, Syncsort Inc, Oracle Corporation, Informatica LLC, Talend Inc, SAP SE.
3. What are the main segments of the Data Quality Tools Industry?
The market segments include Deployment Type, Size of the Organization, Component, End-user Vertical.
4. Can you provide details about the market size?
The market size is estimated to be USD XX Million as of 2022.
5. What are some drivers contributing to market growth?
Increasing Use of External Data Sources Owing to Mobile Connectivity Growth.
6. What are the notable trends driving market growth?
Healthcare is Expected to Witness Significant Growth.
7. Are there any restraints impacting market growth?
Lack of information and Awareness about the Solutions Among Potential Users.
8. Can you provide examples of recent developments in the market?
September 2022: MIT Computer Science and Artificial Intelligence Laboratory (CSAIL) spin-off DataCebo announced the launch of a new tool, dubbed Synthetic Data (SD) Metrics, to help enterprises compare the quality of machine-generated synthetic data by pitching it against real data sets.
9. What pricing options are available for accessing the report?
Pricing options include single-user, multi-user, and enterprise licenses priced at USD 4750, USD 5250, and USD 8750 respectively.
10. Is the market size provided in terms of value or volume?
The market size is provided in terms of value, measured in Million.
11. Are there any specific market keywords associated with the report?
Yes, the market keyword associated with the report is "Data Quality Tools Industry," which aids in identifying and referencing the specific market segment covered.
12. How do I determine which pricing option suits my needs best?
The pricing options vary based on user requirements and access needs. Individual users may opt for single-user licenses, while businesses requiring broader access may choose multi-user or enterprise licenses for cost-effective access to the report.
13. Are there any additional resources or data provided in the Data Quality Tools Industry report?
While the report offers comprehensive insights, it's advisable to review the specific contents or supplementary materials provided to ascertain if additional resources or data are available.
14. How can I stay updated on further developments or reports in the Data Quality Tools Industry?
To stay informed about further developments, trends, and reports in the Data Quality Tools Industry, consider subscribing to industry newsletters, following relevant companies and organizations, or regularly checking reputable industry news sources and publications.
Methodology
Step 1 - Identification of Relevant Samples Size from Population Database


Step 2 - Approaches for Defining Global Market Size (Value, Volume* & Price*)

Note*: In applicable scenarios
Step 3 - Data Sources
Primary Research
- Web Analytics
- Survey Reports
- Research Institute
- Latest Research Reports
- Opinion Leaders
Secondary Research
- Annual Reports
- White Paper
- Latest Press Release
- Industry Association
- Paid Database
- Investor Presentations

Step 4 - Data Triangulation
Involves using different sources of information in order to increase the validity of a study
These sources are likely to be stakeholders in a program - participants, other researchers, program staff, other community members, and so on.
Then we put all data in single framework & apply various statistical tools to find out the dynamic on the market.
During the analysis stage, feedback from the stakeholder groups would be compared to determine areas of agreement as well as areas of divergence
