

Key Insights
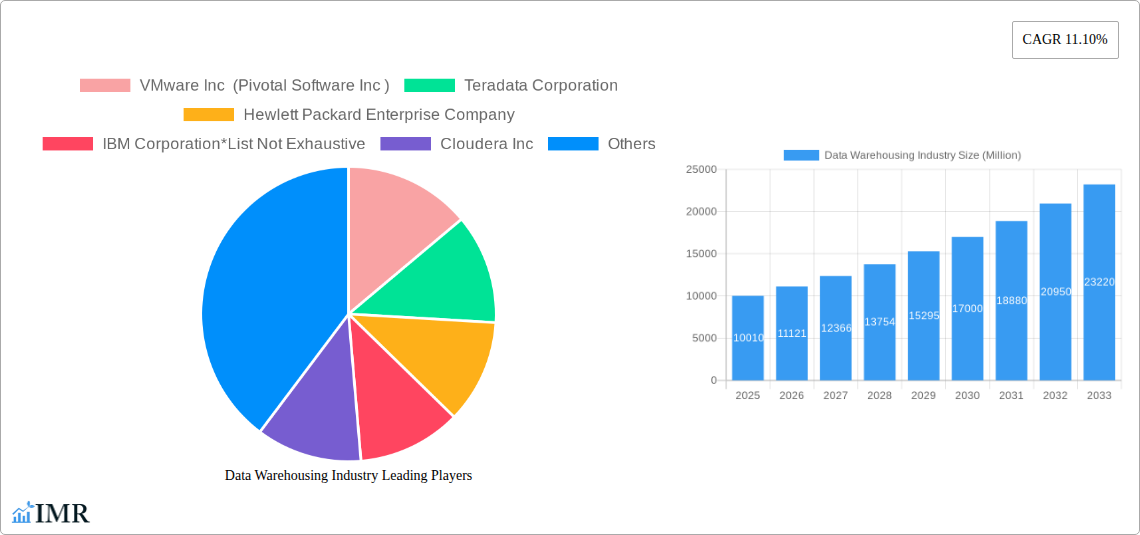
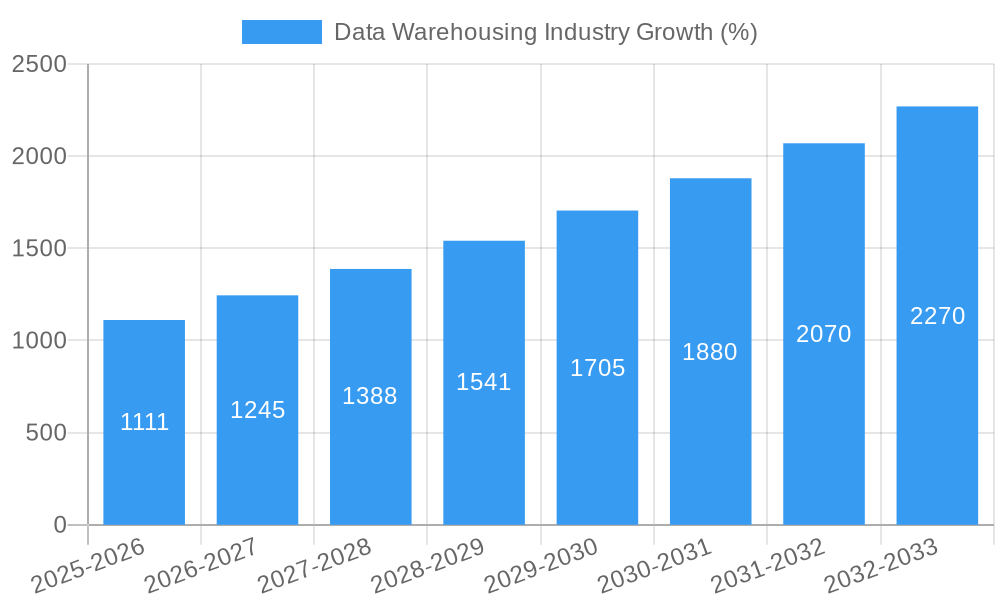
The Data Warehousing market, valued at $10.01 billion in 2025, is experiencing robust growth, projected to expand at a Compound Annual Growth Rate (CAGR) of 11.10% from 2025 to 2033. This significant expansion is fueled by several key drivers. The increasing volume and velocity of data generated by businesses across diverse sectors necessitates efficient data storage and analytical capabilities. Furthermore, the rising adoption of cloud-based solutions offers scalability and cost-effectiveness, driving market growth. The growing need for real-time business intelligence and improved decision-making capabilities further enhances the demand for sophisticated data warehousing solutions. Key industry verticals like BFSI (Banking, Financial Services, and Insurance), Manufacturing, Healthcare, and Retail are leading adopters, leveraging data warehousing to optimize operations, enhance customer experiences, and gain a competitive edge. The market is segmented by enterprise size (SMEs and large enterprises), industry vertical, and deployment type (on-premise, cloud, and hybrid), reflecting diverse business needs and technological preferences. While challenges such as data security concerns and the complexity of implementation exist, the overall market trajectory remains positive, driven by continuous technological advancements and increasing data-driven decision-making across industries.
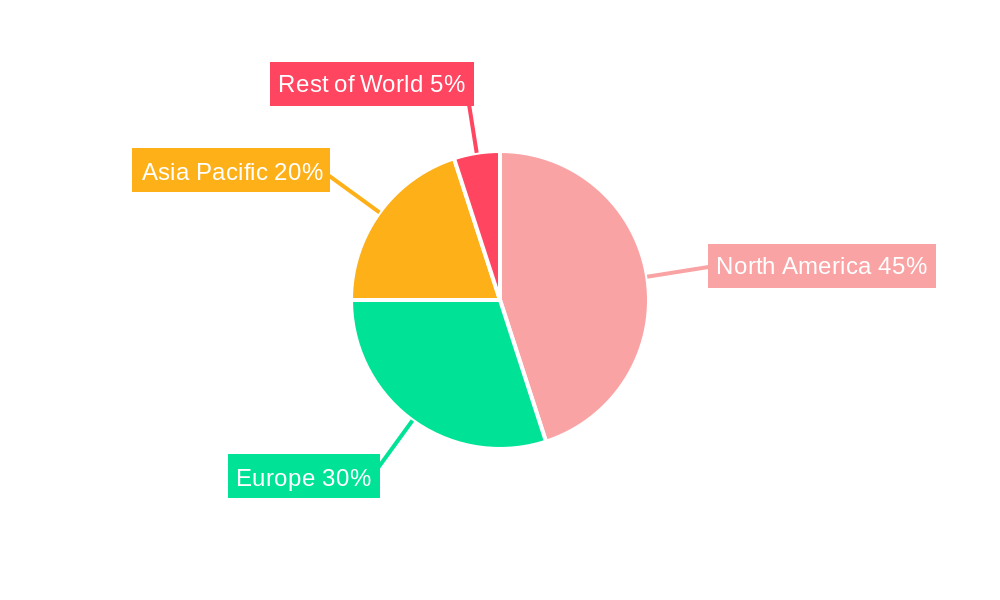
The competitive landscape is dynamic, with established players like VMware, Teradata, Hewlett Packard Enterprise, IBM, Cloudera, Microsoft, Amazon Web Services, and Oracle competing alongside emerging innovative companies like Kognitio and Snowflake. These companies are continually developing advanced solutions, including enhanced analytics, improved data integration capabilities, and more robust security features to cater to the evolving needs of businesses. Geographical expansion is also a significant factor, with North America currently holding a substantial market share, followed by Europe and the Asia-Pacific region. However, emerging economies are expected to witness significant growth in the coming years, driven by increasing digitalization and rising adoption of data-driven strategies. The forecast period of 2025-2033 presents substantial opportunities for market participants, emphasizing the importance of innovation, strategic partnerships, and a focus on customer-centric solutions.
Data Warehousing Industry Market Report: 2019-2033
This comprehensive report provides a detailed analysis of the Data Warehousing market, encompassing market dynamics, growth trends, regional segmentation, product landscape, key players, and future outlook. The study period covers 2019-2033, with 2025 as the base and estimated year. The report utilizes both qualitative and quantitative data to offer actionable insights for industry professionals, investors, and strategic decision-makers. The parent market is the broader data management and analytics sector, while the child market focuses specifically on data warehousing solutions and services. The total market size is projected to reach xx Million by 2033.
Data Warehousing Industry Market Dynamics & Structure
The data warehousing market is characterized by high competition among established players and emerging startups. Market concentration is moderate, with a few dominant players holding significant market share, while numerous smaller companies cater to niche segments. Technological innovation, particularly in cloud-based solutions and AI integration, is a key driver, while regulatory frameworks concerning data privacy (e.g., GDPR) significantly impact market strategies. Competitive substitutes include data lakes and NoSQL databases, forcing vendors to offer integrated and adaptable solutions. The end-user demographics are expanding, with increased adoption across various industries. Mergers and acquisitions (M&A) activity is prevalent, demonstrating the industry's consolidation and expansion trends.
- Market Concentration: Moderate, with top 5 players holding approximately xx% market share in 2025.
- Technological Innovation: Cloud computing, AI/ML integration, and serverless architectures drive significant innovation.
- Regulatory Landscape: GDPR, CCPA, and other data privacy regulations influence data warehousing deployment and security measures.
- M&A Activity: An average of xx M&A deals per year observed during the historical period (2019-2024), with deal value averaging xx Million per transaction.
- Innovation Barriers: High initial investment costs, integration complexities, and skilled talent scarcity hinder innovation in some segments.
Data Warehousing Industry Growth Trends & Insights
The data warehousing market has experienced robust growth during the historical period (2019-2024), fueled by increasing data volumes, the need for advanced analytics, and the adoption of cloud-based solutions. The market size expanded from xx Million in 2019 to xx Million in 2024, exhibiting a CAGR of xx%. This growth is expected to continue throughout the forecast period (2025-2033), driven by factors such as digital transformation initiatives, the rise of big data analytics, and the increasing demand for real-time insights across diverse industries. The market penetration rate is projected to reach xx% by 2033, indicating significant growth potential. Technological disruptions, such as the emergence of lakehouse architectures, are reshaping the market landscape, creating both challenges and opportunities for vendors. Consumer behavior shifts towards cloud-based solutions and demand for managed services are influencing vendor strategies.
Dominant Regions, Countries, or Segments in Data Warehousing Industry
North America currently holds the largest market share in the data warehousing industry, driven by the high adoption rate of advanced analytics and the presence of major technology companies. Within the segments:
- By Size of Enterprise: Large enterprises dominate the market due to higher budgets and complex data management requirements.
- By Industry Vertical: The BFSI sector exhibits the highest growth, driven by the need for fraud detection, risk management, and customer analytics. Manufacturing and Healthcare are also experiencing significant growth.
- By Type of Deployment: Cloud deployment is experiencing the fastest growth, driven by scalability, cost-effectiveness, and ease of management.
Key Drivers:
- North America: Strong technological infrastructure, high adoption of cloud computing, and presence of major data warehousing vendors.
- BFSI: Stringent regulatory compliance requirements, the need for real-time fraud detection, and customer analytics.
- Cloud Deployment: Scalability, cost-effectiveness, and ease of management compared to on-premise solutions.
Data Warehousing Industry Product Landscape
Data warehousing solutions encompass a wide range of products, including cloud-based data warehouses, on-premise systems, data integration tools, and data visualization dashboards. Recent innovations focus on enhanced scalability, improved performance, and seamless integration with other analytical tools. Unique selling propositions include ease of use, advanced analytics capabilities, and strong security features. Technological advancements such as AI-powered analytics and serverless architectures are transforming the product landscape, offering greater flexibility and efficiency.
Key Drivers, Barriers & Challenges in Data Warehousing Industry
Key Drivers:
- Growing Data Volumes: The exponential growth of data necessitates robust and scalable data warehousing solutions.
- Demand for Real-Time Insights: Businesses require immediate access to data for timely decision-making.
- Advancements in Cloud Computing: Cloud-based solutions offer scalability, cost-effectiveness, and ease of management.
Key Challenges:
- Data Security and Privacy: Stringent regulations and the risk of data breaches pose significant challenges.
- Integration Complexity: Integrating data from diverse sources can be complex and time-consuming.
- High Initial Investment: Implementing data warehousing solutions can require significant upfront investment. This leads to a xx Million shortfall in investment annually, impacting xx% of smaller businesses.
Emerging Opportunities in Data Warehousing Industry
Emerging opportunities include the expansion into untapped markets, such as the IoT and edge computing sectors. Innovative applications like real-time analytics for industrial automation and personalized healthcare are gaining traction. Evolving consumer preferences for cloud-based, self-service solutions present new opportunities for vendors to provide managed services and tailored solutions.
Growth Accelerators in the Data Warehousing Industry
Technological breakthroughs, such as the development of lakehouse architectures, are fueling long-term growth. Strategic partnerships between data warehousing vendors and other technology providers enhance solution capabilities. Market expansion strategies, such as targeting new industry verticals and geographic regions, are also crucial for growth.
Key Players Shaping the Data Warehousing Industry Market
- VMware Inc (Pivotal Software Inc)
- Teradata Corporation
- Hewlett Packard Enterprise Company
- IBM Corporation
- Cloudera Inc
- Microsoft Corporation
- Amazon Web Services Inc
- Kognitio Ltd
- Snowflake Computing Inc
- Huawei Technologies Co Ltd
- Treasure Data Inc
- Oracle Corporation
- SAP SE
Notable Milestones in Data Warehousing Industry Sector
- January 2023: Eucloid partners with Databricks to offer Lakehouse Platform to Fortune 500 clients, signifying increased adoption of integrated data solutions.
- December 2022: Macrotech Developers' USD 40.4 Million investment in a warehouse project highlights the growing demand from e-commerce and logistics sectors, indirectly boosting data warehousing needs for efficient operations.
In-Depth Data Warehousing Industry Market Outlook
The data warehousing market is poised for continued growth, driven by the increasing adoption of cloud-based solutions, advancements in AI and ML, and the growing demand for real-time insights across various industries. Strategic partnerships, technological innovations, and market expansion into new geographies and verticals will be crucial for vendors to capitalize on future market potential. The market is expected to show a sustained CAGR of xx% through 2033, presenting significant opportunities for both established players and emerging companies.
Data Warehousing Industry Segmentation
-
1. Type of Deployment
- 1.1. On-premise
- 1.2. Cloud
- 1.3. Hybrid
-
2. Size of Enterprise
- 2.1. Small and Medium-sized Enterprises
- 2.2. Large Enterprises
-
3. Industry Vertical
- 3.1. BFSI
- 3.2. Manufacturing
- 3.3. Healthcare
- 3.4. Retail
- 3.5. Other Industry Verticals
Data Warehousing Industry Segmentation By Geography
-
1. North America
- 1.1. United States
- 1.2. Canada
-
2. Europe
- 2.1. United Kingdom
- 2.2. Germany
- 2.3. France
- 2.4. Spain
- 2.5. Rest of Europe
-
3. Asia Pacific
- 3.1. China
- 3.2. Japan
- 3.3. Rest of Asia Pacific
- 4. Rest of the World
Data Warehousing Industry REPORT HIGHLIGHTS
| Aspects | Details |
|---|---|
| Study Period | 2019-2033 |
| Base Year | 2024 |
| Estimated Year | 2025 |
| Forecast Period | 2025-2033 |
| Historical Period | 2019-2024 |
| Growth Rate | CAGR of 11.10% from 2019-2033 |
| Segmentation |
|
Table of Contents
- 1. Introduction
- 1.1. Research Scope
- 1.2. Market Segmentation
- 1.3. Research Methodology
- 1.4. Definitions and Assumptions
- 2. Executive Summary
- 2.1. Introduction
- 3. Market Dynamics
- 3.1. Introduction
- 3.2. Market Drivers
- 3.2.1. Increase in the Adoption of Business Intelligence and Big Data Analytics Solutions in Various Industries; Rising Penetration of Smartphones may Drive the Market Growth
- 3.3. Market Restrains
- 3.3.1. High Installation Cost of Heat Pumps
- 3.4. Market Trends
- 3.4.1. Rising Penetration of Smartphones may Drive the Market Growth
- 4. Market Factor Analysis
- 4.1. Porters Five Forces
- 4.2. Supply/Value Chain
- 4.3. PESTEL analysis
- 4.4. Market Entropy
- 4.5. Patent/Trademark Analysis
- 5. Global Data Warehousing Industry Analysis, Insights and Forecast, 2019-2031
- 5.1. Market Analysis, Insights and Forecast - by Type of Deployment
- 5.1.1. On-premise
- 5.1.2. Cloud
- 5.1.3. Hybrid
- 5.2. Market Analysis, Insights and Forecast - by Size of Enterprise
- 5.2.1. Small and Medium-sized Enterprises
- 5.2.2. Large Enterprises
- 5.3. Market Analysis, Insights and Forecast - by Industry Vertical
- 5.3.1. BFSI
- 5.3.2. Manufacturing
- 5.3.3. Healthcare
- 5.3.4. Retail
- 5.3.5. Other Industry Verticals
- 5.4. Market Analysis, Insights and Forecast - by Region
- 5.4.1. North America
- 5.4.2. Europe
- 5.4.3. Asia Pacific
- 5.4.4. Rest of the World
- 5.1. Market Analysis, Insights and Forecast - by Type of Deployment
- 6. North America Data Warehousing Industry Analysis, Insights and Forecast, 2019-2031
- 6.1. Market Analysis, Insights and Forecast - by Type of Deployment
- 6.1.1. On-premise
- 6.1.2. Cloud
- 6.1.3. Hybrid
- 6.2. Market Analysis, Insights and Forecast - by Size of Enterprise
- 6.2.1. Small and Medium-sized Enterprises
- 6.2.2. Large Enterprises
- 6.3. Market Analysis, Insights and Forecast - by Industry Vertical
- 6.3.1. BFSI
- 6.3.2. Manufacturing
- 6.3.3. Healthcare
- 6.3.4. Retail
- 6.3.5. Other Industry Verticals
- 6.1. Market Analysis, Insights and Forecast - by Type of Deployment
- 7. Europe Data Warehousing Industry Analysis, Insights and Forecast, 2019-2031
- 7.1. Market Analysis, Insights and Forecast - by Type of Deployment
- 7.1.1. On-premise
- 7.1.2. Cloud
- 7.1.3. Hybrid
- 7.2. Market Analysis, Insights and Forecast - by Size of Enterprise
- 7.2.1. Small and Medium-sized Enterprises
- 7.2.2. Large Enterprises
- 7.3. Market Analysis, Insights and Forecast - by Industry Vertical
- 7.3.1. BFSI
- 7.3.2. Manufacturing
- 7.3.3. Healthcare
- 7.3.4. Retail
- 7.3.5. Other Industry Verticals
- 7.1. Market Analysis, Insights and Forecast - by Type of Deployment
- 8. Asia Pacific Data Warehousing Industry Analysis, Insights and Forecast, 2019-2031
- 8.1. Market Analysis, Insights and Forecast - by Type of Deployment
- 8.1.1. On-premise
- 8.1.2. Cloud
- 8.1.3. Hybrid
- 8.2. Market Analysis, Insights and Forecast - by Size of Enterprise
- 8.2.1. Small and Medium-sized Enterprises
- 8.2.2. Large Enterprises
- 8.3. Market Analysis, Insights and Forecast - by Industry Vertical
- 8.3.1. BFSI
- 8.3.2. Manufacturing
- 8.3.3. Healthcare
- 8.3.4. Retail
- 8.3.5. Other Industry Verticals
- 8.1. Market Analysis, Insights and Forecast - by Type of Deployment
- 9. Rest of the World Data Warehousing Industry Analysis, Insights and Forecast, 2019-2031
- 9.1. Market Analysis, Insights and Forecast - by Type of Deployment
- 9.1.1. On-premise
- 9.1.2. Cloud
- 9.1.3. Hybrid
- 9.2. Market Analysis, Insights and Forecast - by Size of Enterprise
- 9.2.1. Small and Medium-sized Enterprises
- 9.2.2. Large Enterprises
- 9.3. Market Analysis, Insights and Forecast - by Industry Vertical
- 9.3.1. BFSI
- 9.3.2. Manufacturing
- 9.3.3. Healthcare
- 9.3.4. Retail
- 9.3.5. Other Industry Verticals
- 9.1. Market Analysis, Insights and Forecast - by Type of Deployment
- 10. North America Data Warehousing Industry Analysis, Insights and Forecast, 2019-2031
- 10.1. Market Analysis, Insights and Forecast - By Country/Sub-region
- 10.1.1 United States
- 10.1.2 Canada
- 11. Europe Data Warehousing Industry Analysis, Insights and Forecast, 2019-2031
- 11.1. Market Analysis, Insights and Forecast - By Country/Sub-region
- 11.1.1 United Kingdom
- 11.1.2 Germany
- 11.1.3 France
- 11.1.4 Spain
- 11.1.5 Rest of Europe
- 12. Asia Pacific Data Warehousing Industry Analysis, Insights and Forecast, 2019-2031
- 12.1. Market Analysis, Insights and Forecast - By Country/Sub-region
- 12.1.1 China
- 12.1.2 Japan
- 12.1.3 Rest of Asia Pacific
- 13. Rest of the World Data Warehousing Industry Analysis, Insights and Forecast, 2019-2031
- 13.1. Market Analysis, Insights and Forecast - By Country/Sub-region
- 13.1.1.
- 14. Competitive Analysis
- 14.1. Global Market Share Analysis 2024
- 14.2. Company Profiles
- 14.2.1 VMware Inc (Pivotal Software Inc )
- 14.2.1.1. Overview
- 14.2.1.2. Products
- 14.2.1.3. SWOT Analysis
- 14.2.1.4. Recent Developments
- 14.2.1.5. Financials (Based on Availability)
- 14.2.2 Teradata Corporation
- 14.2.2.1. Overview
- 14.2.2.2. Products
- 14.2.2.3. SWOT Analysis
- 14.2.2.4. Recent Developments
- 14.2.2.5. Financials (Based on Availability)
- 14.2.3 Hewlett Packard Enterprise Company
- 14.2.3.1. Overview
- 14.2.3.2. Products
- 14.2.3.3. SWOT Analysis
- 14.2.3.4. Recent Developments
- 14.2.3.5. Financials (Based on Availability)
- 14.2.4 IBM Corporation*List Not Exhaustive
- 14.2.4.1. Overview
- 14.2.4.2. Products
- 14.2.4.3. SWOT Analysis
- 14.2.4.4. Recent Developments
- 14.2.4.5. Financials (Based on Availability)
- 14.2.5 Cloudera Inc
- 14.2.5.1. Overview
- 14.2.5.2. Products
- 14.2.5.3. SWOT Analysis
- 14.2.5.4. Recent Developments
- 14.2.5.5. Financials (Based on Availability)
- 14.2.6 Microsoft Corporation
- 14.2.6.1. Overview
- 14.2.6.2. Products
- 14.2.6.3. SWOT Analysis
- 14.2.6.4. Recent Developments
- 14.2.6.5. Financials (Based on Availability)
- 14.2.7 Amazon Web Services Inc
- 14.2.7.1. Overview
- 14.2.7.2. Products
- 14.2.7.3. SWOT Analysis
- 14.2.7.4. Recent Developments
- 14.2.7.5. Financials (Based on Availability)
- 14.2.8 Kognitio Ltd
- 14.2.8.1. Overview
- 14.2.8.2. Products
- 14.2.8.3. SWOT Analysis
- 14.2.8.4. Recent Developments
- 14.2.8.5. Financials (Based on Availability)
- 14.2.9 Snowflake Computing Inc
- 14.2.9.1. Overview
- 14.2.9.2. Products
- 14.2.9.3. SWOT Analysis
- 14.2.9.4. Recent Developments
- 14.2.9.5. Financials (Based on Availability)
- 14.2.10 Huawei Technologies Co Ltd
- 14.2.10.1. Overview
- 14.2.10.2. Products
- 14.2.10.3. SWOT Analysis
- 14.2.10.4. Recent Developments
- 14.2.10.5. Financials (Based on Availability)
- 14.2.11 Treasure Data Inc
- 14.2.11.1. Overview
- 14.2.11.2. Products
- 14.2.11.3. SWOT Analysis
- 14.2.11.4. Recent Developments
- 14.2.11.5. Financials (Based on Availability)
- 14.2.12 Oracle Corporation
- 14.2.12.1. Overview
- 14.2.12.2. Products
- 14.2.12.3. SWOT Analysis
- 14.2.12.4. Recent Developments
- 14.2.12.5. Financials (Based on Availability)
- 14.2.13 SAP SE
- 14.2.13.1. Overview
- 14.2.13.2. Products
- 14.2.13.3. SWOT Analysis
- 14.2.13.4. Recent Developments
- 14.2.13.5. Financials (Based on Availability)
- 14.2.1 VMware Inc (Pivotal Software Inc )
List of Figures
- Figure 1: Global Data Warehousing Industry Revenue Breakdown (Million, %) by Region 2024 & 2032
- Figure 2: North America Data Warehousing Industry Revenue (Million), by Country 2024 & 2032
- Figure 3: North America Data Warehousing Industry Revenue Share (%), by Country 2024 & 2032
- Figure 4: Europe Data Warehousing Industry Revenue (Million), by Country 2024 & 2032
- Figure 5: Europe Data Warehousing Industry Revenue Share (%), by Country 2024 & 2032
- Figure 6: Asia Pacific Data Warehousing Industry Revenue (Million), by Country 2024 & 2032
- Figure 7: Asia Pacific Data Warehousing Industry Revenue Share (%), by Country 2024 & 2032
- Figure 8: Rest of the World Data Warehousing Industry Revenue (Million), by Country 2024 & 2032
- Figure 9: Rest of the World Data Warehousing Industry Revenue Share (%), by Country 2024 & 2032
- Figure 10: North America Data Warehousing Industry Revenue (Million), by Type of Deployment 2024 & 2032
- Figure 11: North America Data Warehousing Industry Revenue Share (%), by Type of Deployment 2024 & 2032
- Figure 12: North America Data Warehousing Industry Revenue (Million), by Size of Enterprise 2024 & 2032
- Figure 13: North America Data Warehousing Industry Revenue Share (%), by Size of Enterprise 2024 & 2032
- Figure 14: North America Data Warehousing Industry Revenue (Million), by Industry Vertical 2024 & 2032
- Figure 15: North America Data Warehousing Industry Revenue Share (%), by Industry Vertical 2024 & 2032
- Figure 16: North America Data Warehousing Industry Revenue (Million), by Country 2024 & 2032
- Figure 17: North America Data Warehousing Industry Revenue Share (%), by Country 2024 & 2032
- Figure 18: Europe Data Warehousing Industry Revenue (Million), by Type of Deployment 2024 & 2032
- Figure 19: Europe Data Warehousing Industry Revenue Share (%), by Type of Deployment 2024 & 2032
- Figure 20: Europe Data Warehousing Industry Revenue (Million), by Size of Enterprise 2024 & 2032
- Figure 21: Europe Data Warehousing Industry Revenue Share (%), by Size of Enterprise 2024 & 2032
- Figure 22: Europe Data Warehousing Industry Revenue (Million), by Industry Vertical 2024 & 2032
- Figure 23: Europe Data Warehousing Industry Revenue Share (%), by Industry Vertical 2024 & 2032
- Figure 24: Europe Data Warehousing Industry Revenue (Million), by Country 2024 & 2032
- Figure 25: Europe Data Warehousing Industry Revenue Share (%), by Country 2024 & 2032
- Figure 26: Asia Pacific Data Warehousing Industry Revenue (Million), by Type of Deployment 2024 & 2032
- Figure 27: Asia Pacific Data Warehousing Industry Revenue Share (%), by Type of Deployment 2024 & 2032
- Figure 28: Asia Pacific Data Warehousing Industry Revenue (Million), by Size of Enterprise 2024 & 2032
- Figure 29: Asia Pacific Data Warehousing Industry Revenue Share (%), by Size of Enterprise 2024 & 2032
- Figure 30: Asia Pacific Data Warehousing Industry Revenue (Million), by Industry Vertical 2024 & 2032
- Figure 31: Asia Pacific Data Warehousing Industry Revenue Share (%), by Industry Vertical 2024 & 2032
- Figure 32: Asia Pacific Data Warehousing Industry Revenue (Million), by Country 2024 & 2032
- Figure 33: Asia Pacific Data Warehousing Industry Revenue Share (%), by Country 2024 & 2032
- Figure 34: Rest of the World Data Warehousing Industry Revenue (Million), by Type of Deployment 2024 & 2032
- Figure 35: Rest of the World Data Warehousing Industry Revenue Share (%), by Type of Deployment 2024 & 2032
- Figure 36: Rest of the World Data Warehousing Industry Revenue (Million), by Size of Enterprise 2024 & 2032
- Figure 37: Rest of the World Data Warehousing Industry Revenue Share (%), by Size of Enterprise 2024 & 2032
- Figure 38: Rest of the World Data Warehousing Industry Revenue (Million), by Industry Vertical 2024 & 2032
- Figure 39: Rest of the World Data Warehousing Industry Revenue Share (%), by Industry Vertical 2024 & 2032
- Figure 40: Rest of the World Data Warehousing Industry Revenue (Million), by Country 2024 & 2032
- Figure 41: Rest of the World Data Warehousing Industry Revenue Share (%), by Country 2024 & 2032
List of Tables
- Table 1: Global Data Warehousing Industry Revenue Million Forecast, by Region 2019 & 2032
- Table 2: Global Data Warehousing Industry Revenue Million Forecast, by Type of Deployment 2019 & 2032
- Table 3: Global Data Warehousing Industry Revenue Million Forecast, by Size of Enterprise 2019 & 2032
- Table 4: Global Data Warehousing Industry Revenue Million Forecast, by Industry Vertical 2019 & 2032
- Table 5: Global Data Warehousing Industry Revenue Million Forecast, by Region 2019 & 2032
- Table 6: Global Data Warehousing Industry Revenue Million Forecast, by Country 2019 & 2032
- Table 7: United States Data Warehousing Industry Revenue (Million) Forecast, by Application 2019 & 2032
- Table 8: Canada Data Warehousing Industry Revenue (Million) Forecast, by Application 2019 & 2032
- Table 9: Global Data Warehousing Industry Revenue Million Forecast, by Country 2019 & 2032
- Table 10: United Kingdom Data Warehousing Industry Revenue (Million) Forecast, by Application 2019 & 2032
- Table 11: Germany Data Warehousing Industry Revenue (Million) Forecast, by Application 2019 & 2032
- Table 12: France Data Warehousing Industry Revenue (Million) Forecast, by Application 2019 & 2032
- Table 13: Spain Data Warehousing Industry Revenue (Million) Forecast, by Application 2019 & 2032
- Table 14: Rest of Europe Data Warehousing Industry Revenue (Million) Forecast, by Application 2019 & 2032
- Table 15: Global Data Warehousing Industry Revenue Million Forecast, by Country 2019 & 2032
- Table 16: China Data Warehousing Industry Revenue (Million) Forecast, by Application 2019 & 2032
- Table 17: Japan Data Warehousing Industry Revenue (Million) Forecast, by Application 2019 & 2032
- Table 18: Rest of Asia Pacific Data Warehousing Industry Revenue (Million) Forecast, by Application 2019 & 2032
- Table 19: Global Data Warehousing Industry Revenue Million Forecast, by Country 2019 & 2032
- Table 20: Data Warehousing Industry Revenue (Million) Forecast, by Application 2019 & 2032
- Table 21: Global Data Warehousing Industry Revenue Million Forecast, by Type of Deployment 2019 & 2032
- Table 22: Global Data Warehousing Industry Revenue Million Forecast, by Size of Enterprise 2019 & 2032
- Table 23: Global Data Warehousing Industry Revenue Million Forecast, by Industry Vertical 2019 & 2032
- Table 24: Global Data Warehousing Industry Revenue Million Forecast, by Country 2019 & 2032
- Table 25: United States Data Warehousing Industry Revenue (Million) Forecast, by Application 2019 & 2032
- Table 26: Canada Data Warehousing Industry Revenue (Million) Forecast, by Application 2019 & 2032
- Table 27: Global Data Warehousing Industry Revenue Million Forecast, by Type of Deployment 2019 & 2032
- Table 28: Global Data Warehousing Industry Revenue Million Forecast, by Size of Enterprise 2019 & 2032
- Table 29: Global Data Warehousing Industry Revenue Million Forecast, by Industry Vertical 2019 & 2032
- Table 30: Global Data Warehousing Industry Revenue Million Forecast, by Country 2019 & 2032
- Table 31: United Kingdom Data Warehousing Industry Revenue (Million) Forecast, by Application 2019 & 2032
- Table 32: Germany Data Warehousing Industry Revenue (Million) Forecast, by Application 2019 & 2032
- Table 33: France Data Warehousing Industry Revenue (Million) Forecast, by Application 2019 & 2032
- Table 34: Spain Data Warehousing Industry Revenue (Million) Forecast, by Application 2019 & 2032
- Table 35: Rest of Europe Data Warehousing Industry Revenue (Million) Forecast, by Application 2019 & 2032
- Table 36: Global Data Warehousing Industry Revenue Million Forecast, by Type of Deployment 2019 & 2032
- Table 37: Global Data Warehousing Industry Revenue Million Forecast, by Size of Enterprise 2019 & 2032
- Table 38: Global Data Warehousing Industry Revenue Million Forecast, by Industry Vertical 2019 & 2032
- Table 39: Global Data Warehousing Industry Revenue Million Forecast, by Country 2019 & 2032
- Table 40: China Data Warehousing Industry Revenue (Million) Forecast, by Application 2019 & 2032
- Table 41: Japan Data Warehousing Industry Revenue (Million) Forecast, by Application 2019 & 2032
- Table 42: Rest of Asia Pacific Data Warehousing Industry Revenue (Million) Forecast, by Application 2019 & 2032
- Table 43: Global Data Warehousing Industry Revenue Million Forecast, by Type of Deployment 2019 & 2032
- Table 44: Global Data Warehousing Industry Revenue Million Forecast, by Size of Enterprise 2019 & 2032
- Table 45: Global Data Warehousing Industry Revenue Million Forecast, by Industry Vertical 2019 & 2032
- Table 46: Global Data Warehousing Industry Revenue Million Forecast, by Country 2019 & 2032
Frequently Asked Questions
1. What is the projected Compound Annual Growth Rate (CAGR) of the Data Warehousing Industry?
The projected CAGR is approximately 11.10%.
2. Which companies are prominent players in the Data Warehousing Industry?
Key companies in the market include VMware Inc (Pivotal Software Inc ), Teradata Corporation, Hewlett Packard Enterprise Company, IBM Corporation*List Not Exhaustive, Cloudera Inc, Microsoft Corporation, Amazon Web Services Inc, Kognitio Ltd, Snowflake Computing Inc, Huawei Technologies Co Ltd, Treasure Data Inc, Oracle Corporation, SAP SE.
3. What are the main segments of the Data Warehousing Industry?
The market segments include Type of Deployment, Size of Enterprise, Industry Vertical.
4. Can you provide details about the market size?
The market size is estimated to be USD 10.01 Million as of 2022.
5. What are some drivers contributing to market growth?
Increase in the Adoption of Business Intelligence and Big Data Analytics Solutions in Various Industries; Rising Penetration of Smartphones may Drive the Market Growth.
6. What are the notable trends driving market growth?
Rising Penetration of Smartphones may Drive the Market Growth.
7. Are there any restraints impacting market growth?
High Installation Cost of Heat Pumps.
8. Can you provide examples of recent developments in the market?
January 2023: Eucloid, a Data & Growth Intelligence company, announced a partnership with Databricks to make the Lakehouse Platform available to its Fortune 500 clients. The company's Lakehouse platform provides a single solution for all significant data tasks, which integrates several data warehouse and data lake features.
9. What pricing options are available for accessing the report?
Pricing options include single-user, multi-user, and enterprise licenses priced at USD 4750, USD 5250, and USD 8750 respectively.
10. Is the market size provided in terms of value or volume?
The market size is provided in terms of value, measured in Million.
11. Are there any specific market keywords associated with the report?
Yes, the market keyword associated with the report is "Data Warehousing Industry," which aids in identifying and referencing the specific market segment covered.
12. How do I determine which pricing option suits my needs best?
The pricing options vary based on user requirements and access needs. Individual users may opt for single-user licenses, while businesses requiring broader access may choose multi-user or enterprise licenses for cost-effective access to the report.
13. Are there any additional resources or data provided in the Data Warehousing Industry report?
While the report offers comprehensive insights, it's advisable to review the specific contents or supplementary materials provided to ascertain if additional resources or data are available.
14. How can I stay updated on further developments or reports in the Data Warehousing Industry?
To stay informed about further developments, trends, and reports in the Data Warehousing Industry, consider subscribing to industry newsletters, following relevant companies and organizations, or regularly checking reputable industry news sources and publications.
Methodology
Step 1 - Identification of Relevant Samples Size from Population Database


Step 2 - Approaches for Defining Global Market Size (Value, Volume* & Price*)

Note*: In applicable scenarios
Step 3 - Data Sources
Primary Research
- Web Analytics
- Survey Reports
- Research Institute
- Latest Research Reports
- Opinion Leaders
Secondary Research
- Annual Reports
- White Paper
- Latest Press Release
- Industry Association
- Paid Database
- Investor Presentations

Step 4 - Data Triangulation
Involves using different sources of information in order to increase the validity of a study
These sources are likely to be stakeholders in a program - participants, other researchers, program staff, other community members, and so on.
Then we put all data in single framework & apply various statistical tools to find out the dynamic on the market.
During the analysis stage, feedback from the stakeholder groups would be compared to determine areas of agreement as well as areas of divergence
