

Key Insights
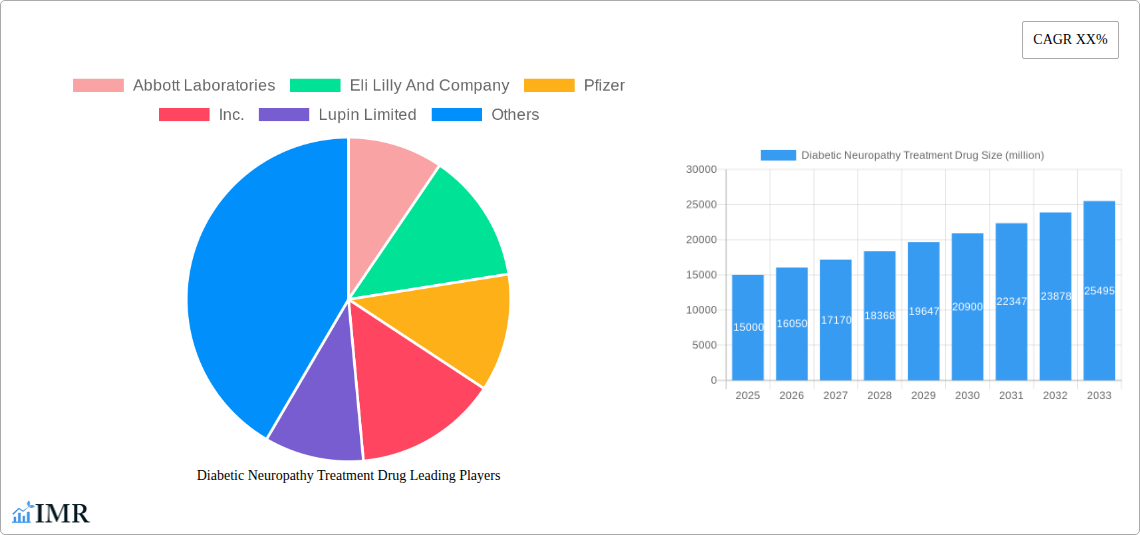
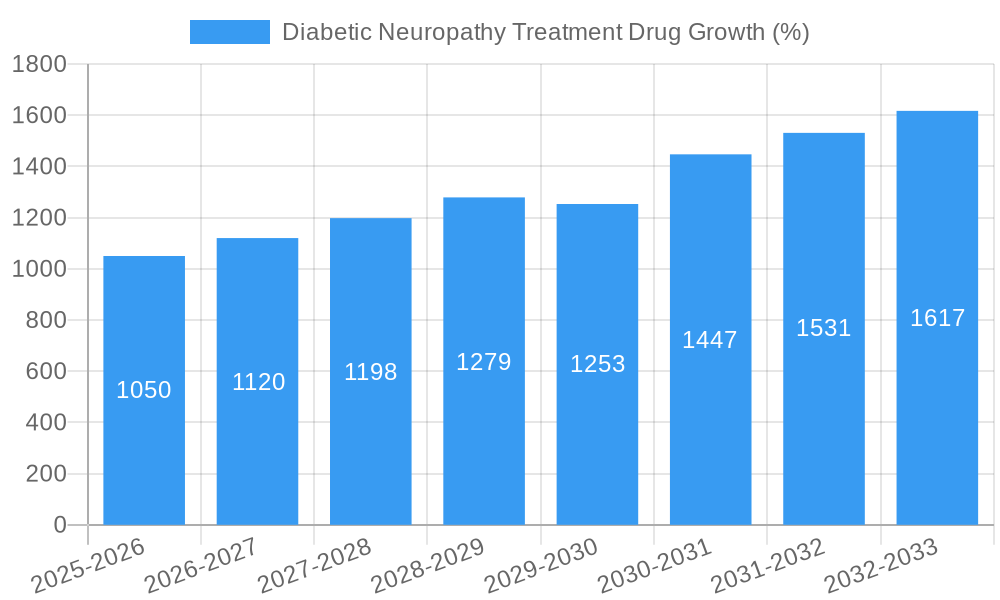
The global market for diabetic neuropathy treatment drugs is experiencing robust growth, driven by the escalating prevalence of diabetes and the resulting increase in diabetic neuropathy cases worldwide. The market, currently estimated at $15 billion in 2025, is projected to exhibit a Compound Annual Growth Rate (CAGR) of approximately 7% from 2025 to 2033, reaching an estimated market value exceeding $25 billion by 2033. This growth is fueled by several key factors, including the increasing geriatric population (a demographic highly susceptible to diabetes and its complications), rising healthcare expenditure globally, and the continuous advancement in treatment options such as novel drug formulations and improved delivery systems. Furthermore, heightened awareness campaigns and improved diagnosis rates contribute significantly to the expanding market. Major pharmaceutical companies like Abbott Laboratories, Eli Lilly and Company, and Pfizer, Inc., are key players, investing heavily in R&D to develop more effective and targeted therapies. However, market growth is tempered by factors such as high treatment costs, the prevalence of adverse effects associated with certain medications, and the complexities in diagnosing diabetic neuropathy early.
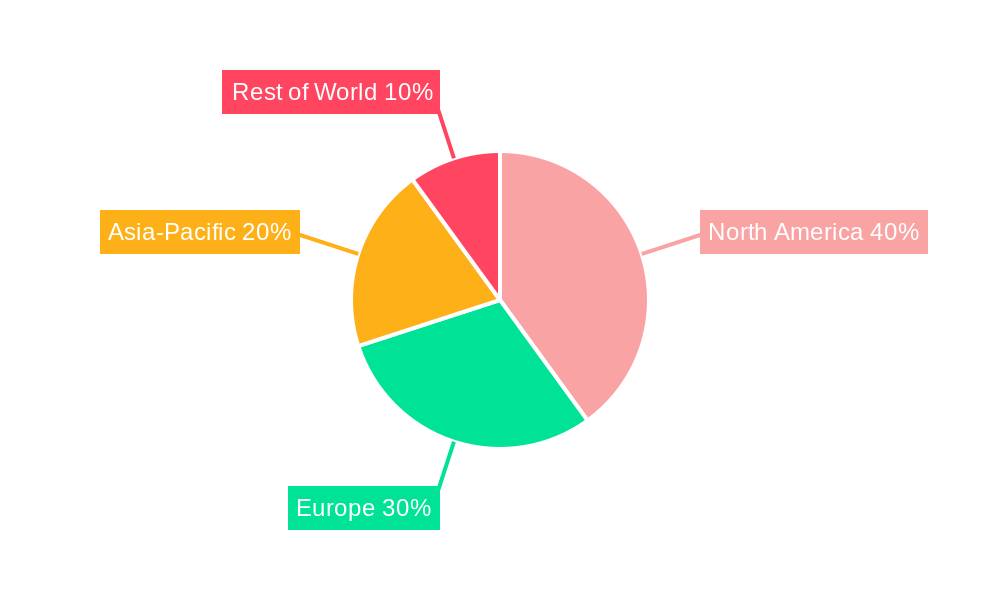
The market is segmented by drug class (e.g., analgesics, antidepressants, anticonvulsants), route of administration (oral, topical, injectable), and region. North America currently holds the largest market share, followed by Europe and Asia-Pacific. However, emerging economies in Asia-Pacific and Latin America are projected to experience significant growth in the forecast period due to increasing diabetes prevalence and rising healthcare infrastructure. The competitive landscape is characterized by both established pharmaceutical giants and emerging generic manufacturers vying for market share. Strategic partnerships, mergers and acquisitions, and the development of innovative treatment modalities are expected to shape the future of this rapidly evolving market, demanding ongoing monitoring and strategic adaptation by players to maintain a competitive edge.
Diabetic Neuropathy Treatment Drug Market Report: 2019-2033
This comprehensive report provides a detailed analysis of the Diabetic Neuropathy Treatment Drug market, encompassing market dynamics, growth trends, regional insights, product landscape, and key players. The study period covers 2019-2033, with 2025 as the base and estimated year, and a forecast period of 2025-2033. The historical period analyzed is 2019-2024. This report is crucial for pharmaceutical companies, investors, and healthcare professionals seeking to understand this evolving market segment. The total market size in 2025 is estimated at $XX billion.
Diabetic Neuropathy Treatment Drug Market Dynamics & Structure
The Diabetic Neuropathy Treatment Drug market is characterized by a moderately concentrated structure with key players holding significant market share. Technological innovation, primarily in drug delivery systems and novel therapeutic targets, is a major driver. Stringent regulatory frameworks, particularly concerning drug approvals and safety protocols, influence market entry and expansion. Competitive product substitutes, such as traditional pain management therapies and complementary alternative medicine (CAM) approaches, create pressure. The end-user demographic comprises predominantly the aging population with type 1 and type 2 diabetes. M&A activity has been moderate, with several deals focusing on expanding product portfolios and geographical reach. The historical period (2019-2024) showed a xx% CAGR, driven by an increase in the diabetic population and advancements in treatment options. The market is expected to continue growing due to increasing prevalence of diabetes.
- Market Concentration: Highly concentrated, with top 5 players holding approximately xx% market share in 2025.
- Technological Innovation: Focus on improved efficacy, reduced side effects, and convenient delivery methods (e.g., patches, injectables).
- Regulatory Landscape: Stringent FDA and EMA approvals influence market access and pricing.
- Competitive Substitutes: Traditional pain management methods and CAM therapies pose a moderate challenge.
- M&A Activity: xx major deals during 2019-2024, primarily focused on expansion and portfolio diversification.
Diabetic Neuropathy Treatment Drug Growth Trends & Insights
The Diabetic Neuropathy Treatment Drug market experienced significant growth from 2019 to 2024, driven by rising diabetes prevalence, an aging global population, and increased awareness of neuropathy management. Adoption rates have steadily increased, fueled by improved treatment efficacy and better patient outcomes. Technological disruptions, such as the development of novel drug delivery systems and advanced diagnostic tools, have further propelled market expansion. Consumer behavior shifts towards personalized medicine and proactive healthcare management contribute to growth. The market is expected to maintain a steady CAGR of xx% during the forecast period (2025-2033), reaching an estimated market size of $XX billion by 2033. Increased investment in R&D for novel therapies and the growing adoption of telemedicine will play a crucial role in future growth.
Dominant Regions, Countries, or Segments in Diabetic Neuropathy Treatment Drug
North America currently dominates the Diabetic Neuropathy Treatment Drug market, driven by high diabetes prevalence, robust healthcare infrastructure, and higher per capita healthcare spending. Europe follows as a significant market, while Asia-Pacific is expected to experience the fastest growth rate due to a rapidly increasing diabetic population and rising healthcare expenditure. Within specific segments, treatment options targeting specific types of neuropathy (e.g., peripheral, autonomic) show differentiated growth trajectories.
- North America: High market share driven by high diabetes prevalence and advanced healthcare infrastructure.
- Europe: Significant market size with growth driven by increasing diabetic population and advancements in treatment options.
- Asia-Pacific: Fastest growing region due to a rapidly expanding diabetic population and increasing healthcare investment.
Diabetic Neuropathy Treatment Drug Product Landscape
The product landscape is diverse, encompassing a range of oral medications, topical creams, and injectable therapies. Innovations focus on improving efficacy, reducing side effects, and enhancing patient convenience. Recent advancements include novel drug delivery systems designed to optimize therapeutic levels and minimize adverse events. Unique selling propositions frequently emphasize improved tolerability, faster onset of action, and targeted delivery mechanisms.
Key Drivers, Barriers & Challenges in Diabetic Neuropathy Treatment Drug
Key Drivers: The increasing prevalence of diabetes, coupled with an aging population, is a primary driver. Technological advancements leading to more effective and convenient treatments also contribute to market growth. Favorable reimbursement policies in developed markets further propel market expansion.
Challenges: High treatment costs and limited insurance coverage restrict access for a significant portion of the population. The development of novel therapies often faces high R&D costs and long regulatory approval times. Competition from existing treatments and alternative therapies poses a considerable challenge.
Emerging Opportunities in Diabetic Neuropathy Treatment Drug
Untapped markets in developing countries with rapidly growing diabetic populations present significant opportunities. The development of personalized medicine approaches and novel diagnostic tools to predict and manage neuropathy offers further growth potential. Innovative drug delivery systems, such as implantable devices or advanced patches, provide an avenue for enhanced treatment efficacy and patient compliance.
Growth Accelerators in the Diabetic Neuropathy Treatment Drug Industry
Technological breakthroughs in drug discovery and development, leading to novel therapies with improved efficacy and safety profiles, are crucial growth catalysts. Strategic partnerships between pharmaceutical companies and technology providers foster innovation and market expansion. The expanding use of telemedicine and remote patient monitoring for neuropathy management significantly contribute to market expansion.
Key Players Shaping the Diabetic Neuropathy Treatment Drug Market
- Abbott Laboratories
- Eli Lilly And Company
- Pfizer, Inc.
- Lupin Limited
- Astellas Pharma, Inc.
- Glenmark Pharmaceuticals Limited
- Boehringer Ingelheim International GmbH
- Novartis AG
- McKesson Corporation
- GlaxoSmithKline PLC (GSK)
Notable Milestones in Diabetic Neuropathy Treatment Drug Sector
- 2020: Launch of a novel drug delivery system by Company X.
- 2021: FDA approval of a new drug targeting a specific type of neuropathy.
- 2022: Acquisition of Company Y by Company Z, expanding the market presence.
- 2023: Publication of a landmark clinical trial demonstrating the efficacy of a new treatment approach.
- 2024: Partnership between Company A and Company B to develop a new diagnostic tool.
In-Depth Diabetic Neuropathy Treatment Drug Market Outlook
The Diabetic Neuropathy Treatment Drug market is poised for robust growth over the forecast period, driven by the factors outlined above. Strategic investments in R&D, coupled with a growing focus on personalized medicine and innovative drug delivery systems, will be key to shaping future market trends. Untapped opportunities in emerging markets and further expansion of telemedicine applications promise to significantly increase market size and penetration.
Diabetic Neuropathy Treatment Drug Segmentation
-
1. Application
- 1.1. Hospitals Pharmacies
- 1.2. Retail Pharmacies
- 1.3. Others
-
2. Types
- 2.1. Non-Steroidal Anti-inflammatory Drugs (NSAIDs)
- 2.2. Antidepressants
- 2.3. Opioid
- 2.4. Capsaicin
- 2.5. Others
Diabetic Neuropathy Treatment Drug Segmentation By Geography
-
1. North America
- 1.1. United States
- 1.2. Canada
- 1.3. Mexico
-
2. South America
- 2.1. Brazil
- 2.2. Argentina
- 2.3. Rest of South America
-
3. Europe
- 3.1. United Kingdom
- 3.2. Germany
- 3.3. France
- 3.4. Italy
- 3.5. Spain
- 3.6. Russia
- 3.7. Benelux
- 3.8. Nordics
- 3.9. Rest of Europe
-
4. Middle East & Africa
- 4.1. Turkey
- 4.2. Israel
- 4.3. GCC
- 4.4. North Africa
- 4.5. South Africa
- 4.6. Rest of Middle East & Africa
-
5. Asia Pacific
- 5.1. China
- 5.2. India
- 5.3. Japan
- 5.4. South Korea
- 5.5. ASEAN
- 5.6. Oceania
- 5.7. Rest of Asia Pacific
Diabetic Neuropathy Treatment Drug REPORT HIGHLIGHTS
| Aspects | Details |
|---|---|
| Study Period | 2019-2033 |
| Base Year | 2024 |
| Estimated Year | 2025 |
| Forecast Period | 2025-2033 |
| Historical Period | 2019-2024 |
| Growth Rate | CAGR of XX% from 2019-2033 |
| Segmentation |
|
Table of Contents
- 1. Introduction
- 1.1. Research Scope
- 1.2. Market Segmentation
- 1.3. Research Methodology
- 1.4. Definitions and Assumptions
- 2. Executive Summary
- 2.1. Introduction
- 3. Market Dynamics
- 3.1. Introduction
- 3.2. Market Drivers
- 3.3. Market Restrains
- 3.4. Market Trends
- 4. Market Factor Analysis
- 4.1. Porters Five Forces
- 4.2. Supply/Value Chain
- 4.3. PESTEL analysis
- 4.4. Market Entropy
- 4.5. Patent/Trademark Analysis
- 5. Global Diabetic Neuropathy Treatment Drug Analysis, Insights and Forecast, 2019-2031
- 5.1. Market Analysis, Insights and Forecast - by Application
- 5.1.1. Hospitals Pharmacies
- 5.1.2. Retail Pharmacies
- 5.1.3. Others
- 5.2. Market Analysis, Insights and Forecast - by Types
- 5.2.1. Non-Steroidal Anti-inflammatory Drugs (NSAIDs)
- 5.2.2. Antidepressants
- 5.2.3. Opioid
- 5.2.4. Capsaicin
- 5.2.5. Others
- 5.3. Market Analysis, Insights and Forecast - by Region
- 5.3.1. North America
- 5.3.2. South America
- 5.3.3. Europe
- 5.3.4. Middle East & Africa
- 5.3.5. Asia Pacific
- 5.1. Market Analysis, Insights and Forecast - by Application
- 6. North America Diabetic Neuropathy Treatment Drug Analysis, Insights and Forecast, 2019-2031
- 6.1. Market Analysis, Insights and Forecast - by Application
- 6.1.1. Hospitals Pharmacies
- 6.1.2. Retail Pharmacies
- 6.1.3. Others
- 6.2. Market Analysis, Insights and Forecast - by Types
- 6.2.1. Non-Steroidal Anti-inflammatory Drugs (NSAIDs)
- 6.2.2. Antidepressants
- 6.2.3. Opioid
- 6.2.4. Capsaicin
- 6.2.5. Others
- 6.1. Market Analysis, Insights and Forecast - by Application
- 7. South America Diabetic Neuropathy Treatment Drug Analysis, Insights and Forecast, 2019-2031
- 7.1. Market Analysis, Insights and Forecast - by Application
- 7.1.1. Hospitals Pharmacies
- 7.1.2. Retail Pharmacies
- 7.1.3. Others
- 7.2. Market Analysis, Insights and Forecast - by Types
- 7.2.1. Non-Steroidal Anti-inflammatory Drugs (NSAIDs)
- 7.2.2. Antidepressants
- 7.2.3. Opioid
- 7.2.4. Capsaicin
- 7.2.5. Others
- 7.1. Market Analysis, Insights and Forecast - by Application
- 8. Europe Diabetic Neuropathy Treatment Drug Analysis, Insights and Forecast, 2019-2031
- 8.1. Market Analysis, Insights and Forecast - by Application
- 8.1.1. Hospitals Pharmacies
- 8.1.2. Retail Pharmacies
- 8.1.3. Others
- 8.2. Market Analysis, Insights and Forecast - by Types
- 8.2.1. Non-Steroidal Anti-inflammatory Drugs (NSAIDs)
- 8.2.2. Antidepressants
- 8.2.3. Opioid
- 8.2.4. Capsaicin
- 8.2.5. Others
- 8.1. Market Analysis, Insights and Forecast - by Application
- 9. Middle East & Africa Diabetic Neuropathy Treatment Drug Analysis, Insights and Forecast, 2019-2031
- 9.1. Market Analysis, Insights and Forecast - by Application
- 9.1.1. Hospitals Pharmacies
- 9.1.2. Retail Pharmacies
- 9.1.3. Others
- 9.2. Market Analysis, Insights and Forecast - by Types
- 9.2.1. Non-Steroidal Anti-inflammatory Drugs (NSAIDs)
- 9.2.2. Antidepressants
- 9.2.3. Opioid
- 9.2.4. Capsaicin
- 9.2.5. Others
- 9.1. Market Analysis, Insights and Forecast - by Application
- 10. Asia Pacific Diabetic Neuropathy Treatment Drug Analysis, Insights and Forecast, 2019-2031
- 10.1. Market Analysis, Insights and Forecast - by Application
- 10.1.1. Hospitals Pharmacies
- 10.1.2. Retail Pharmacies
- 10.1.3. Others
- 10.2. Market Analysis, Insights and Forecast - by Types
- 10.2.1. Non-Steroidal Anti-inflammatory Drugs (NSAIDs)
- 10.2.2. Antidepressants
- 10.2.3. Opioid
- 10.2.4. Capsaicin
- 10.2.5. Others
- 10.1. Market Analysis, Insights and Forecast - by Application
- 11. Competitive Analysis
- 11.1. Global Market Share Analysis 2024
- 11.2. Company Profiles
- 11.2.1 Abbott Laboratories
- 11.2.1.1. Overview
- 11.2.1.2. Products
- 11.2.1.3. SWOT Analysis
- 11.2.1.4. Recent Developments
- 11.2.1.5. Financials (Based on Availability)
- 11.2.2 Eli Lilly And Company
- 11.2.2.1. Overview
- 11.2.2.2. Products
- 11.2.2.3. SWOT Analysis
- 11.2.2.4. Recent Developments
- 11.2.2.5. Financials (Based on Availability)
- 11.2.3 Pfizer
- 11.2.3.1. Overview
- 11.2.3.2. Products
- 11.2.3.3. SWOT Analysis
- 11.2.3.4. Recent Developments
- 11.2.3.5. Financials (Based on Availability)
- 11.2.4 Inc.
- 11.2.4.1. Overview
- 11.2.4.2. Products
- 11.2.4.3. SWOT Analysis
- 11.2.4.4. Recent Developments
- 11.2.4.5. Financials (Based on Availability)
- 11.2.5 Lupin Limited
- 11.2.5.1. Overview
- 11.2.5.2. Products
- 11.2.5.3. SWOT Analysis
- 11.2.5.4. Recent Developments
- 11.2.5.5. Financials (Based on Availability)
- 11.2.6 Astellas Pharma
- 11.2.6.1. Overview
- 11.2.6.2. Products
- 11.2.6.3. SWOT Analysis
- 11.2.6.4. Recent Developments
- 11.2.6.5. Financials (Based on Availability)
- 11.2.7 Inc.
- 11.2.7.1. Overview
- 11.2.7.2. Products
- 11.2.7.3. SWOT Analysis
- 11.2.7.4. Recent Developments
- 11.2.7.5. Financials (Based on Availability)
- 11.2.8 Glenmark Pharmaceuticals Limited
- 11.2.8.1. Overview
- 11.2.8.2. Products
- 11.2.8.3. SWOT Analysis
- 11.2.8.4. Recent Developments
- 11.2.8.5. Financials (Based on Availability)
- 11.2.9 Boehringer Ingelheim International GmbH
- 11.2.9.1. Overview
- 11.2.9.2. Products
- 11.2.9.3. SWOT Analysis
- 11.2.9.4. Recent Developments
- 11.2.9.5. Financials (Based on Availability)
- 11.2.10 Novartis AG
- 11.2.10.1. Overview
- 11.2.10.2. Products
- 11.2.10.3. SWOT Analysis
- 11.2.10.4. Recent Developments
- 11.2.10.5. Financials (Based on Availability)
- 11.2.11 McKesson Corporation
- 11.2.11.1. Overview
- 11.2.11.2. Products
- 11.2.11.3. SWOT Analysis
- 11.2.11.4. Recent Developments
- 11.2.11.5. Financials (Based on Availability)
- 11.2.12 GlaxoSmithKline PLC (GSK)
- 11.2.12.1. Overview
- 11.2.12.2. Products
- 11.2.12.3. SWOT Analysis
- 11.2.12.4. Recent Developments
- 11.2.12.5. Financials (Based on Availability)
- 11.2.1 Abbott Laboratories
List of Figures
- Figure 1: Global Diabetic Neuropathy Treatment Drug Revenue Breakdown (million, %) by Region 2024 & 2032
- Figure 2: Global Diabetic Neuropathy Treatment Drug Volume Breakdown (K, %) by Region 2024 & 2032
- Figure 3: North America Diabetic Neuropathy Treatment Drug Revenue (million), by Application 2024 & 2032
- Figure 4: North America Diabetic Neuropathy Treatment Drug Volume (K), by Application 2024 & 2032
- Figure 5: North America Diabetic Neuropathy Treatment Drug Revenue Share (%), by Application 2024 & 2032
- Figure 6: North America Diabetic Neuropathy Treatment Drug Volume Share (%), by Application 2024 & 2032
- Figure 7: North America Diabetic Neuropathy Treatment Drug Revenue (million), by Types 2024 & 2032
- Figure 8: North America Diabetic Neuropathy Treatment Drug Volume (K), by Types 2024 & 2032
- Figure 9: North America Diabetic Neuropathy Treatment Drug Revenue Share (%), by Types 2024 & 2032
- Figure 10: North America Diabetic Neuropathy Treatment Drug Volume Share (%), by Types 2024 & 2032
- Figure 11: North America Diabetic Neuropathy Treatment Drug Revenue (million), by Country 2024 & 2032
- Figure 12: North America Diabetic Neuropathy Treatment Drug Volume (K), by Country 2024 & 2032
- Figure 13: North America Diabetic Neuropathy Treatment Drug Revenue Share (%), by Country 2024 & 2032
- Figure 14: North America Diabetic Neuropathy Treatment Drug Volume Share (%), by Country 2024 & 2032
- Figure 15: South America Diabetic Neuropathy Treatment Drug Revenue (million), by Application 2024 & 2032
- Figure 16: South America Diabetic Neuropathy Treatment Drug Volume (K), by Application 2024 & 2032
- Figure 17: South America Diabetic Neuropathy Treatment Drug Revenue Share (%), by Application 2024 & 2032
- Figure 18: South America Diabetic Neuropathy Treatment Drug Volume Share (%), by Application 2024 & 2032
- Figure 19: South America Diabetic Neuropathy Treatment Drug Revenue (million), by Types 2024 & 2032
- Figure 20: South America Diabetic Neuropathy Treatment Drug Volume (K), by Types 2024 & 2032
- Figure 21: South America Diabetic Neuropathy Treatment Drug Revenue Share (%), by Types 2024 & 2032
- Figure 22: South America Diabetic Neuropathy Treatment Drug Volume Share (%), by Types 2024 & 2032
- Figure 23: South America Diabetic Neuropathy Treatment Drug Revenue (million), by Country 2024 & 2032
- Figure 24: South America Diabetic Neuropathy Treatment Drug Volume (K), by Country 2024 & 2032
- Figure 25: South America Diabetic Neuropathy Treatment Drug Revenue Share (%), by Country 2024 & 2032
- Figure 26: South America Diabetic Neuropathy Treatment Drug Volume Share (%), by Country 2024 & 2032
- Figure 27: Europe Diabetic Neuropathy Treatment Drug Revenue (million), by Application 2024 & 2032
- Figure 28: Europe Diabetic Neuropathy Treatment Drug Volume (K), by Application 2024 & 2032
- Figure 29: Europe Diabetic Neuropathy Treatment Drug Revenue Share (%), by Application 2024 & 2032
- Figure 30: Europe Diabetic Neuropathy Treatment Drug Volume Share (%), by Application 2024 & 2032
- Figure 31: Europe Diabetic Neuropathy Treatment Drug Revenue (million), by Types 2024 & 2032
- Figure 32: Europe Diabetic Neuropathy Treatment Drug Volume (K), by Types 2024 & 2032
- Figure 33: Europe Diabetic Neuropathy Treatment Drug Revenue Share (%), by Types 2024 & 2032
- Figure 34: Europe Diabetic Neuropathy Treatment Drug Volume Share (%), by Types 2024 & 2032
- Figure 35: Europe Diabetic Neuropathy Treatment Drug Revenue (million), by Country 2024 & 2032
- Figure 36: Europe Diabetic Neuropathy Treatment Drug Volume (K), by Country 2024 & 2032
- Figure 37: Europe Diabetic Neuropathy Treatment Drug Revenue Share (%), by Country 2024 & 2032
- Figure 38: Europe Diabetic Neuropathy Treatment Drug Volume Share (%), by Country 2024 & 2032
- Figure 39: Middle East & Africa Diabetic Neuropathy Treatment Drug Revenue (million), by Application 2024 & 2032
- Figure 40: Middle East & Africa Diabetic Neuropathy Treatment Drug Volume (K), by Application 2024 & 2032
- Figure 41: Middle East & Africa Diabetic Neuropathy Treatment Drug Revenue Share (%), by Application 2024 & 2032
- Figure 42: Middle East & Africa Diabetic Neuropathy Treatment Drug Volume Share (%), by Application 2024 & 2032
- Figure 43: Middle East & Africa Diabetic Neuropathy Treatment Drug Revenue (million), by Types 2024 & 2032
- Figure 44: Middle East & Africa Diabetic Neuropathy Treatment Drug Volume (K), by Types 2024 & 2032
- Figure 45: Middle East & Africa Diabetic Neuropathy Treatment Drug Revenue Share (%), by Types 2024 & 2032
- Figure 46: Middle East & Africa Diabetic Neuropathy Treatment Drug Volume Share (%), by Types 2024 & 2032
- Figure 47: Middle East & Africa Diabetic Neuropathy Treatment Drug Revenue (million), by Country 2024 & 2032
- Figure 48: Middle East & Africa Diabetic Neuropathy Treatment Drug Volume (K), by Country 2024 & 2032
- Figure 49: Middle East & Africa Diabetic Neuropathy Treatment Drug Revenue Share (%), by Country 2024 & 2032
- Figure 50: Middle East & Africa Diabetic Neuropathy Treatment Drug Volume Share (%), by Country 2024 & 2032
- Figure 51: Asia Pacific Diabetic Neuropathy Treatment Drug Revenue (million), by Application 2024 & 2032
- Figure 52: Asia Pacific Diabetic Neuropathy Treatment Drug Volume (K), by Application 2024 & 2032
- Figure 53: Asia Pacific Diabetic Neuropathy Treatment Drug Revenue Share (%), by Application 2024 & 2032
- Figure 54: Asia Pacific Diabetic Neuropathy Treatment Drug Volume Share (%), by Application 2024 & 2032
- Figure 55: Asia Pacific Diabetic Neuropathy Treatment Drug Revenue (million), by Types 2024 & 2032
- Figure 56: Asia Pacific Diabetic Neuropathy Treatment Drug Volume (K), by Types 2024 & 2032
- Figure 57: Asia Pacific Diabetic Neuropathy Treatment Drug Revenue Share (%), by Types 2024 & 2032
- Figure 58: Asia Pacific Diabetic Neuropathy Treatment Drug Volume Share (%), by Types 2024 & 2032
- Figure 59: Asia Pacific Diabetic Neuropathy Treatment Drug Revenue (million), by Country 2024 & 2032
- Figure 60: Asia Pacific Diabetic Neuropathy Treatment Drug Volume (K), by Country 2024 & 2032
- Figure 61: Asia Pacific Diabetic Neuropathy Treatment Drug Revenue Share (%), by Country 2024 & 2032
- Figure 62: Asia Pacific Diabetic Neuropathy Treatment Drug Volume Share (%), by Country 2024 & 2032
List of Tables
- Table 1: Global Diabetic Neuropathy Treatment Drug Revenue million Forecast, by Region 2019 & 2032
- Table 2: Global Diabetic Neuropathy Treatment Drug Volume K Forecast, by Region 2019 & 2032
- Table 3: Global Diabetic Neuropathy Treatment Drug Revenue million Forecast, by Application 2019 & 2032
- Table 4: Global Diabetic Neuropathy Treatment Drug Volume K Forecast, by Application 2019 & 2032
- Table 5: Global Diabetic Neuropathy Treatment Drug Revenue million Forecast, by Types 2019 & 2032
- Table 6: Global Diabetic Neuropathy Treatment Drug Volume K Forecast, by Types 2019 & 2032
- Table 7: Global Diabetic Neuropathy Treatment Drug Revenue million Forecast, by Region 2019 & 2032
- Table 8: Global Diabetic Neuropathy Treatment Drug Volume K Forecast, by Region 2019 & 2032
- Table 9: Global Diabetic Neuropathy Treatment Drug Revenue million Forecast, by Application 2019 & 2032
- Table 10: Global Diabetic Neuropathy Treatment Drug Volume K Forecast, by Application 2019 & 2032
- Table 11: Global Diabetic Neuropathy Treatment Drug Revenue million Forecast, by Types 2019 & 2032
- Table 12: Global Diabetic Neuropathy Treatment Drug Volume K Forecast, by Types 2019 & 2032
- Table 13: Global Diabetic Neuropathy Treatment Drug Revenue million Forecast, by Country 2019 & 2032
- Table 14: Global Diabetic Neuropathy Treatment Drug Volume K Forecast, by Country 2019 & 2032
- Table 15: United States Diabetic Neuropathy Treatment Drug Revenue (million) Forecast, by Application 2019 & 2032
- Table 16: United States Diabetic Neuropathy Treatment Drug Volume (K) Forecast, by Application 2019 & 2032
- Table 17: Canada Diabetic Neuropathy Treatment Drug Revenue (million) Forecast, by Application 2019 & 2032
- Table 18: Canada Diabetic Neuropathy Treatment Drug Volume (K) Forecast, by Application 2019 & 2032
- Table 19: Mexico Diabetic Neuropathy Treatment Drug Revenue (million) Forecast, by Application 2019 & 2032
- Table 20: Mexico Diabetic Neuropathy Treatment Drug Volume (K) Forecast, by Application 2019 & 2032
- Table 21: Global Diabetic Neuropathy Treatment Drug Revenue million Forecast, by Application 2019 & 2032
- Table 22: Global Diabetic Neuropathy Treatment Drug Volume K Forecast, by Application 2019 & 2032
- Table 23: Global Diabetic Neuropathy Treatment Drug Revenue million Forecast, by Types 2019 & 2032
- Table 24: Global Diabetic Neuropathy Treatment Drug Volume K Forecast, by Types 2019 & 2032
- Table 25: Global Diabetic Neuropathy Treatment Drug Revenue million Forecast, by Country 2019 & 2032
- Table 26: Global Diabetic Neuropathy Treatment Drug Volume K Forecast, by Country 2019 & 2032
- Table 27: Brazil Diabetic Neuropathy Treatment Drug Revenue (million) Forecast, by Application 2019 & 2032
- Table 28: Brazil Diabetic Neuropathy Treatment Drug Volume (K) Forecast, by Application 2019 & 2032
- Table 29: Argentina Diabetic Neuropathy Treatment Drug Revenue (million) Forecast, by Application 2019 & 2032
- Table 30: Argentina Diabetic Neuropathy Treatment Drug Volume (K) Forecast, by Application 2019 & 2032
- Table 31: Rest of South America Diabetic Neuropathy Treatment Drug Revenue (million) Forecast, by Application 2019 & 2032
- Table 32: Rest of South America Diabetic Neuropathy Treatment Drug Volume (K) Forecast, by Application 2019 & 2032
- Table 33: Global Diabetic Neuropathy Treatment Drug Revenue million Forecast, by Application 2019 & 2032
- Table 34: Global Diabetic Neuropathy Treatment Drug Volume K Forecast, by Application 2019 & 2032
- Table 35: Global Diabetic Neuropathy Treatment Drug Revenue million Forecast, by Types 2019 & 2032
- Table 36: Global Diabetic Neuropathy Treatment Drug Volume K Forecast, by Types 2019 & 2032
- Table 37: Global Diabetic Neuropathy Treatment Drug Revenue million Forecast, by Country 2019 & 2032
- Table 38: Global Diabetic Neuropathy Treatment Drug Volume K Forecast, by Country 2019 & 2032
- Table 39: United Kingdom Diabetic Neuropathy Treatment Drug Revenue (million) Forecast, by Application 2019 & 2032
- Table 40: United Kingdom Diabetic Neuropathy Treatment Drug Volume (K) Forecast, by Application 2019 & 2032
- Table 41: Germany Diabetic Neuropathy Treatment Drug Revenue (million) Forecast, by Application 2019 & 2032
- Table 42: Germany Diabetic Neuropathy Treatment Drug Volume (K) Forecast, by Application 2019 & 2032
- Table 43: France Diabetic Neuropathy Treatment Drug Revenue (million) Forecast, by Application 2019 & 2032
- Table 44: France Diabetic Neuropathy Treatment Drug Volume (K) Forecast, by Application 2019 & 2032
- Table 45: Italy Diabetic Neuropathy Treatment Drug Revenue (million) Forecast, by Application 2019 & 2032
- Table 46: Italy Diabetic Neuropathy Treatment Drug Volume (K) Forecast, by Application 2019 & 2032
- Table 47: Spain Diabetic Neuropathy Treatment Drug Revenue (million) Forecast, by Application 2019 & 2032
- Table 48: Spain Diabetic Neuropathy Treatment Drug Volume (K) Forecast, by Application 2019 & 2032
- Table 49: Russia Diabetic Neuropathy Treatment Drug Revenue (million) Forecast, by Application 2019 & 2032
- Table 50: Russia Diabetic Neuropathy Treatment Drug Volume (K) Forecast, by Application 2019 & 2032
- Table 51: Benelux Diabetic Neuropathy Treatment Drug Revenue (million) Forecast, by Application 2019 & 2032
- Table 52: Benelux Diabetic Neuropathy Treatment Drug Volume (K) Forecast, by Application 2019 & 2032
- Table 53: Nordics Diabetic Neuropathy Treatment Drug Revenue (million) Forecast, by Application 2019 & 2032
- Table 54: Nordics Diabetic Neuropathy Treatment Drug Volume (K) Forecast, by Application 2019 & 2032
- Table 55: Rest of Europe Diabetic Neuropathy Treatment Drug Revenue (million) Forecast, by Application 2019 & 2032
- Table 56: Rest of Europe Diabetic Neuropathy Treatment Drug Volume (K) Forecast, by Application 2019 & 2032
- Table 57: Global Diabetic Neuropathy Treatment Drug Revenue million Forecast, by Application 2019 & 2032
- Table 58: Global Diabetic Neuropathy Treatment Drug Volume K Forecast, by Application 2019 & 2032
- Table 59: Global Diabetic Neuropathy Treatment Drug Revenue million Forecast, by Types 2019 & 2032
- Table 60: Global Diabetic Neuropathy Treatment Drug Volume K Forecast, by Types 2019 & 2032
- Table 61: Global Diabetic Neuropathy Treatment Drug Revenue million Forecast, by Country 2019 & 2032
- Table 62: Global Diabetic Neuropathy Treatment Drug Volume K Forecast, by Country 2019 & 2032
- Table 63: Turkey Diabetic Neuropathy Treatment Drug Revenue (million) Forecast, by Application 2019 & 2032
- Table 64: Turkey Diabetic Neuropathy Treatment Drug Volume (K) Forecast, by Application 2019 & 2032
- Table 65: Israel Diabetic Neuropathy Treatment Drug Revenue (million) Forecast, by Application 2019 & 2032
- Table 66: Israel Diabetic Neuropathy Treatment Drug Volume (K) Forecast, by Application 2019 & 2032
- Table 67: GCC Diabetic Neuropathy Treatment Drug Revenue (million) Forecast, by Application 2019 & 2032
- Table 68: GCC Diabetic Neuropathy Treatment Drug Volume (K) Forecast, by Application 2019 & 2032
- Table 69: North Africa Diabetic Neuropathy Treatment Drug Revenue (million) Forecast, by Application 2019 & 2032
- Table 70: North Africa Diabetic Neuropathy Treatment Drug Volume (K) Forecast, by Application 2019 & 2032
- Table 71: South Africa Diabetic Neuropathy Treatment Drug Revenue (million) Forecast, by Application 2019 & 2032
- Table 72: South Africa Diabetic Neuropathy Treatment Drug Volume (K) Forecast, by Application 2019 & 2032
- Table 73: Rest of Middle East & Africa Diabetic Neuropathy Treatment Drug Revenue (million) Forecast, by Application 2019 & 2032
- Table 74: Rest of Middle East & Africa Diabetic Neuropathy Treatment Drug Volume (K) Forecast, by Application 2019 & 2032
- Table 75: Global Diabetic Neuropathy Treatment Drug Revenue million Forecast, by Application 2019 & 2032
- Table 76: Global Diabetic Neuropathy Treatment Drug Volume K Forecast, by Application 2019 & 2032
- Table 77: Global Diabetic Neuropathy Treatment Drug Revenue million Forecast, by Types 2019 & 2032
- Table 78: Global Diabetic Neuropathy Treatment Drug Volume K Forecast, by Types 2019 & 2032
- Table 79: Global Diabetic Neuropathy Treatment Drug Revenue million Forecast, by Country 2019 & 2032
- Table 80: Global Diabetic Neuropathy Treatment Drug Volume K Forecast, by Country 2019 & 2032
- Table 81: China Diabetic Neuropathy Treatment Drug Revenue (million) Forecast, by Application 2019 & 2032
- Table 82: China Diabetic Neuropathy Treatment Drug Volume (K) Forecast, by Application 2019 & 2032
- Table 83: India Diabetic Neuropathy Treatment Drug Revenue (million) Forecast, by Application 2019 & 2032
- Table 84: India Diabetic Neuropathy Treatment Drug Volume (K) Forecast, by Application 2019 & 2032
- Table 85: Japan Diabetic Neuropathy Treatment Drug Revenue (million) Forecast, by Application 2019 & 2032
- Table 86: Japan Diabetic Neuropathy Treatment Drug Volume (K) Forecast, by Application 2019 & 2032
- Table 87: South Korea Diabetic Neuropathy Treatment Drug Revenue (million) Forecast, by Application 2019 & 2032
- Table 88: South Korea Diabetic Neuropathy Treatment Drug Volume (K) Forecast, by Application 2019 & 2032
- Table 89: ASEAN Diabetic Neuropathy Treatment Drug Revenue (million) Forecast, by Application 2019 & 2032
- Table 90: ASEAN Diabetic Neuropathy Treatment Drug Volume (K) Forecast, by Application 2019 & 2032
- Table 91: Oceania Diabetic Neuropathy Treatment Drug Revenue (million) Forecast, by Application 2019 & 2032
- Table 92: Oceania Diabetic Neuropathy Treatment Drug Volume (K) Forecast, by Application 2019 & 2032
- Table 93: Rest of Asia Pacific Diabetic Neuropathy Treatment Drug Revenue (million) Forecast, by Application 2019 & 2032
- Table 94: Rest of Asia Pacific Diabetic Neuropathy Treatment Drug Volume (K) Forecast, by Application 2019 & 2032
Frequently Asked Questions
1. What is the projected Compound Annual Growth Rate (CAGR) of the Diabetic Neuropathy Treatment Drug?
The projected CAGR is approximately XX%.
2. Which companies are prominent players in the Diabetic Neuropathy Treatment Drug?
Key companies in the market include Abbott Laboratories, Eli Lilly And Company, Pfizer, Inc., Lupin Limited, Astellas Pharma, Inc., Glenmark Pharmaceuticals Limited, Boehringer Ingelheim International GmbH, Novartis AG, McKesson Corporation, GlaxoSmithKline PLC (GSK).
3. What are the main segments of the Diabetic Neuropathy Treatment Drug?
The market segments include Application, Types.
4. Can you provide details about the market size?
The market size is estimated to be USD XXX million as of 2022.
5. What are some drivers contributing to market growth?
N/A
6. What are the notable trends driving market growth?
N/A
7. Are there any restraints impacting market growth?
N/A
8. Can you provide examples of recent developments in the market?
N/A
9. What pricing options are available for accessing the report?
Pricing options include single-user, multi-user, and enterprise licenses priced at USD 3950.00, USD 5925.00, and USD 7900.00 respectively.
10. Is the market size provided in terms of value or volume?
The market size is provided in terms of value, measured in million and volume, measured in K.
11. Are there any specific market keywords associated with the report?
Yes, the market keyword associated with the report is "Diabetic Neuropathy Treatment Drug," which aids in identifying and referencing the specific market segment covered.
12. How do I determine which pricing option suits my needs best?
The pricing options vary based on user requirements and access needs. Individual users may opt for single-user licenses, while businesses requiring broader access may choose multi-user or enterprise licenses for cost-effective access to the report.
13. Are there any additional resources or data provided in the Diabetic Neuropathy Treatment Drug report?
While the report offers comprehensive insights, it's advisable to review the specific contents or supplementary materials provided to ascertain if additional resources or data are available.
14. How can I stay updated on further developments or reports in the Diabetic Neuropathy Treatment Drug?
To stay informed about further developments, trends, and reports in the Diabetic Neuropathy Treatment Drug, consider subscribing to industry newsletters, following relevant companies and organizations, or regularly checking reputable industry news sources and publications.
Methodology
Step 1 - Identification of Relevant Samples Size from Population Database


Step 2 - Approaches for Defining Global Market Size (Value, Volume* & Price*)

Note*: In applicable scenarios
Step 3 - Data Sources
Primary Research
- Web Analytics
- Survey Reports
- Research Institute
- Latest Research Reports
- Opinion Leaders
Secondary Research
- Annual Reports
- White Paper
- Latest Press Release
- Industry Association
- Paid Database
- Investor Presentations

Step 4 - Data Triangulation
Involves using different sources of information in order to increase the validity of a study
These sources are likely to be stakeholders in a program - participants, other researchers, program staff, other community members, and so on.
Then we put all data in single framework & apply various statistical tools to find out the dynamic on the market.
During the analysis stage, feedback from the stakeholder groups would be compared to determine areas of agreement as well as areas of divergence
