

Key Insights
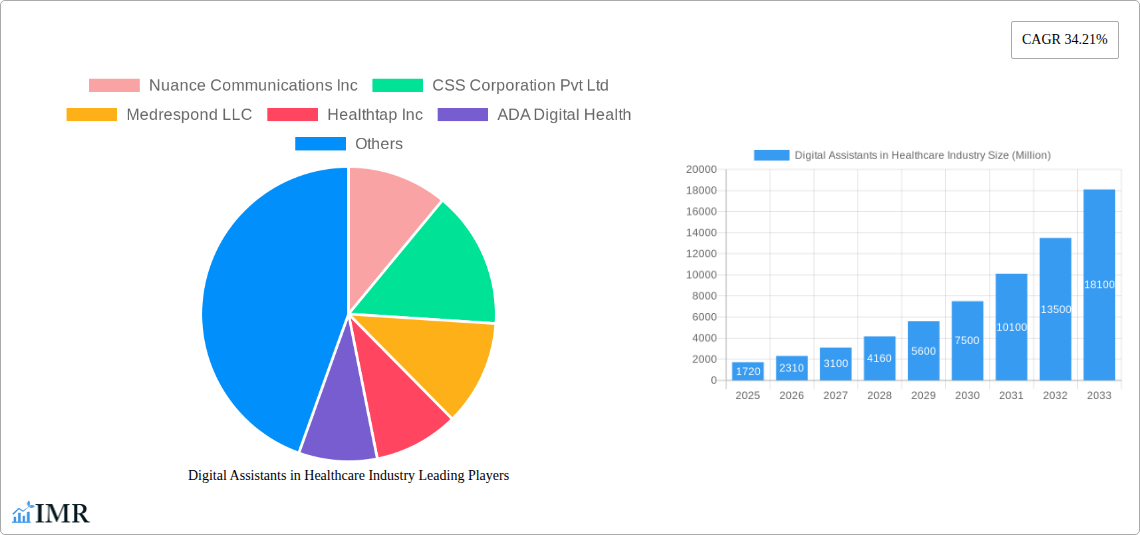
The global digital assistants in healthcare market is experiencing robust growth, projected to reach \$1.72 billion in 2025 and exhibiting a remarkable Compound Annual Growth Rate (CAGR) of 34.21%. This expansion is fueled by several key drivers. Firstly, the increasing adoption of telehealth and remote patient monitoring necessitates efficient communication and data management tools, which digital assistants excel at providing. Secondly, the rising demand for personalized and proactive healthcare solutions is driving the integration of AI-powered digital assistants into various applications, such as medication reminders, appointment scheduling, and symptom checkers. Furthermore, the aging global population, coupled with a shortage of healthcare professionals, creates a compelling need for cost-effective and scalable solutions like digital assistants to improve access to care and enhance efficiency. The market's segmentation reveals strong demand across multiple product categories (smart speakers and chatbots), user interfaces (speech and text-based), and applications (patient tracking, medical reference, and diagnostic guides). North America currently holds a significant market share, but Asia-Pacific is expected to witness substantial growth due to increasing technological adoption and rising healthcare expenditure in countries like India and China. However, challenges such as data security and privacy concerns, as well as the need for regulatory approvals, could potentially restrain market growth. Nevertheless, ongoing technological advancements, coupled with increasing investments in AI and machine learning, are expected to overcome these hurdles and propel the market forward.
The competitive landscape is dynamic, with established players like Nuance Communications and Microsoft alongside emerging innovative companies. Strategic partnerships and acquisitions are prevalent, further fueling market consolidation and innovation. Future growth will be driven by the continuous integration of advanced features such as natural language processing (NLP) and machine learning (ML) to improve the accuracy and effectiveness of digital assistants. The development of specialized digital assistants tailored to specific medical conditions and patient populations will further personalize the healthcare experience and improve outcomes. Increased focus on interoperability and seamless integration with existing Electronic Health Records (EHR) systems will be crucial for widespread adoption. The market's trajectory indicates a promising future for digital assistants in healthcare, revolutionizing patient care, improving operational efficiency, and enhancing the overall healthcare ecosystem.
Digital Assistants in Healthcare Industry: Market Report 2019-2033
This comprehensive report provides an in-depth analysis of the Digital Assistants in Healthcare Industry market, encompassing market dynamics, growth trends, regional dominance, product landscape, key challenges, emerging opportunities, and key players. The study period spans from 2019 to 2033, with 2025 serving as the base and estimated year. The forecast period covers 2025-2033, and the historical period analyzed is 2019-2024. This report is crucial for healthcare providers, payers, technology developers, and investors seeking to understand and navigate this rapidly evolving market. The market is segmented by product (Smart Speakers, Chatbots), user interface (Automatic Speech Recognition, Text-Based, Text-to-Speech), application (Patient Tracking, Medical Reference, Diagnostic Guides, Drug Dosage, Medical Calculators, Nursing Reference, Other Applications), and end-user (Healthcare Providers, Healthcare Payers, Patients, Other End Users). Key players analyzed include Nuance Communications Inc, CSS Corporation Pvt Ltd, Medrespond LLC, Healthtap Inc, ADA Digital Health, Infermedica Sp z o o, Microsoft Corporation, eGain Corporation, Verint Systems Inc, True Image Interactive Inc, Babylon Healthcare Services Limited, Floatbot AI, Amazon.com Inc, Sensely Inc, and Kore AI Inc. The total market value is projected to reach xx Million by 2033.
Digital Assistants in Healthcare Industry Market Dynamics & Structure
The Digital Assistants in Healthcare Industry market exhibits a moderately fragmented structure, with several large players and a growing number of smaller, specialized companies competing for market share. Market concentration is expected to shift as technological advancements and strategic partnerships reshape the competitive landscape. Technological innovation, particularly in AI and machine learning, is a key driver, enabling more sophisticated and personalized healthcare solutions. However, regulatory frameworks concerning data privacy and security, as well as interoperability issues, pose significant challenges. The market faces competition from traditional healthcare solutions, though digital assistants increasingly offer superior efficiency and accessibility.
- Market Concentration: Moderately fragmented, with a shifting landscape influenced by M&A activity. The top 5 players currently hold approximately xx% of the market share.
- Technological Innovation: Rapid advancement in AI, NLP, and machine learning fuels market growth, enabling more accurate diagnosis support, personalized treatment plans, and improved patient engagement.
- Regulatory Framework: HIPAA compliance and data privacy regulations significantly impact market development and adoption. Stringent guidelines necessitate robust security measures.
- Competitive Substitutes: Traditional methods of patient care and information delivery compete with digital assistants.
- End-User Demographics: Increasing adoption of digital health solutions among aging populations and tech-savvy younger generations drive market growth.
- M&A Trends: A moderate number of mergers and acquisitions are observed annually (xx deals in 2024, projected xx in 2025), driven by the need to expand capabilities and market reach.
Digital Assistants in Healthcare Industry Growth Trends & Insights
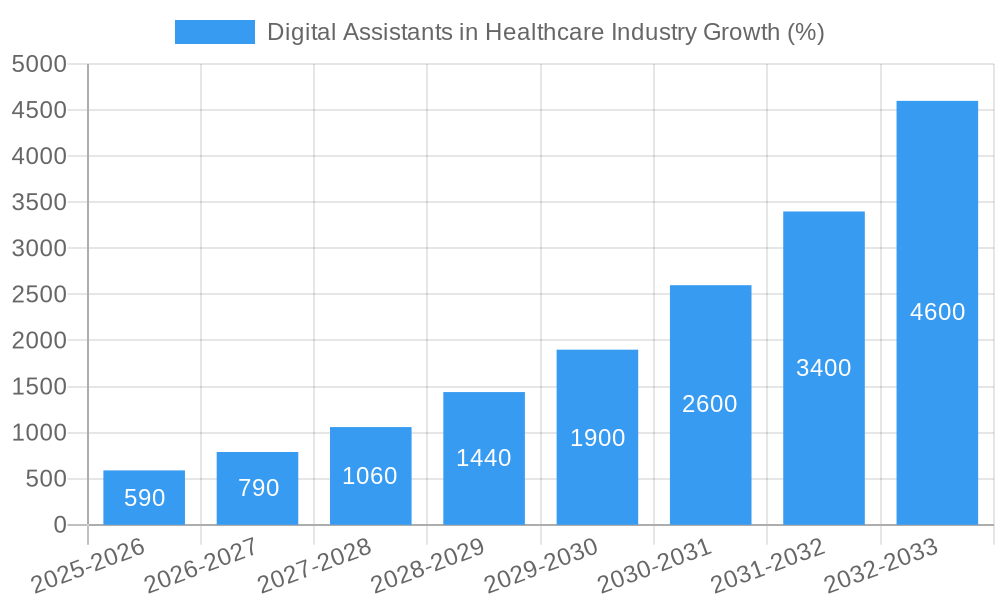
The Digital Assistants in Healthcare Industry market experienced significant growth between 2019 and 2024, with a CAGR of xx%. This growth is fueled by increasing demand for efficient and accessible healthcare solutions, rising healthcare costs, and technological advancements. The market size in 2024 was estimated at xx Million and is projected to reach xx Million in 2025, and xx Million by 2033. The adoption rate of digital assistants is increasing across all end-user segments, driven by factors such as improved user experience, integration with Electronic Health Records (EHRs), and the growing recognition of their clinical value. Technological disruptions, particularly the rise of AI-powered chatbots and virtual assistants, are transforming the way healthcare is delivered and accessed. Consumer behavior shifts reflect a growing preference for remote and personalized care experiences. Increased mobile device usage and internet penetration further contribute to the market's expansion.
Dominant Regions, Countries, or Segments in Digital Assistants in Healthcare Industry
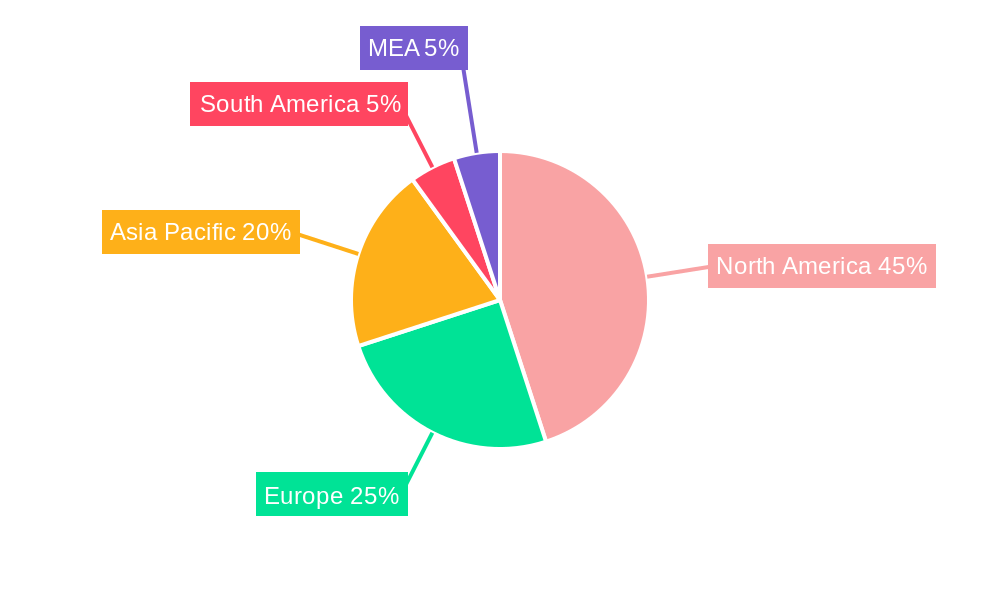
North America currently dominates the Digital Assistants in Healthcare Industry market, holding the largest market share of approximately xx% in 2024, driven by factors such as high adoption rates among healthcare providers, advanced technological infrastructure, and significant investments in digital health solutions. However, Asia-Pacific is projected to show the highest growth rate during the forecast period (xx% CAGR), fueled by rising disposable incomes, increasing smartphone penetration, and government initiatives promoting digital healthcare adoption. Within the product segment, Chatbots show the highest adoption and market share (xx% in 2024), due to their cost-effectiveness and ease of integration with existing systems. In terms of applications, Patient Tracking and Medical Reference are the leading segments.
- Key Drivers in North America: High healthcare expenditure, advanced technological infrastructure, strong regulatory support, and early adoption by leading healthcare organizations.
- Key Drivers in Asia-Pacific: Rising smartphone penetration, government initiatives promoting digital health, and a large and growing population.
- Leading Product Segment: Chatbots (xx% market share in 2024), offering scalable and cost-effective solutions.
- Leading Application Segments: Patient Tracking and Medical Reference.
- Healthcare Provider Segment: Largest end-user segment (xx% market share in 2024) due to growing adoption of digital assistants for administrative tasks and patient communication.
Digital Assistants in Healthcare Industry Product Landscape
The market features a diverse range of digital assistants, including voice-activated smart speakers, text-based chatbots, and sophisticated AI-powered virtual assistants. These solutions vary in functionality, from basic symptom checkers and medication reminders to complex diagnostic tools and personalized treatment plans. Continuous innovation focuses on improving natural language processing (NLP), integrating with EHR systems, ensuring data security and privacy, and expanding functionalities to meet the growing needs of patients and healthcare providers. Key differentiators include accuracy of diagnostic support, ease of use, and integration with other healthcare systems. The trend is toward more personalized and proactive healthcare experiences, driven by advanced AI algorithms and machine learning capabilities.
Key Drivers, Barriers & Challenges in Digital Assistants in Healthcare Industry
Key Drivers: The increasing need for accessible, affordable, and efficient healthcare solutions, combined with technological advancements in AI and NLP, are primary drivers. Government initiatives promoting telehealth and digital health are also significant catalysts. Furthermore, the rising prevalence of chronic diseases fuels demand for remote patient monitoring and personalized care management.
Key Challenges: Data privacy and security concerns, interoperability issues with existing healthcare systems, and regulatory hurdles (particularly HIPAA compliance) pose significant challenges. High implementation costs and the need for ongoing maintenance can also hinder widespread adoption. Limited trust among patients and providers in the reliability and accuracy of digital diagnostic tools poses another barrier to market expansion.
Emerging Opportunities in Digital Assistants in Healthcare Industry
Untapped markets in developing countries represent a substantial growth opportunity. Innovative applications, such as AI-powered diagnostic tools for early disease detection, and personalized treatment plans based on individual patient data, hold immense potential. Integration of wearable sensors with digital assistants for continuous patient monitoring creates new possibilities for proactive healthcare management. Evolving consumer preferences for personalized, remote, and convenient healthcare experiences open avenues for innovative solutions focusing on user experience and accessibility.
Growth Accelerators in the Digital Assistants in Healthcare Industry Industry
Technological breakthroughs in AI and machine learning are driving innovation and expanding the capabilities of digital assistants. Strategic partnerships between technology companies, healthcare providers, and payers are accelerating market penetration. Expansion strategies targeting underserved populations and regions, and the development of user-friendly interfaces, are crucial for wider adoption.
Key Players Shaping the Digital Assistants in Healthcare Industry Market
- Nuance Communications Inc
- CSS Corporation Pvt Ltd
- Medrespond LLC
- Healthtap Inc
- ADA Digital Health
- Infermedica Sp z o o
- Microsoft Corporation
- eGain Corporation
- Verint Systems Inc
- True Image Interactive Inc
- Babylon Healthcare Services Limited
- Floatbot AI
- Amazon.com Inc
- Sensely Inc
- Kore AI Inc
Notable Milestones in Digital Assistants in Healthcare Industry Sector
- October 2022: Babylon Healthcare Services Limited launched a new digital health service in Vietnam, providing 24/7 access to AI-powered symptom checking and healthcare provider location services to 9.4 Million people.
- February 2023: Ada Health and Pfizer collaborated on a digital condition-based care journey for COVID-19, aiding in early diagnosis and connection to healthcare providers.
In-Depth Digital Assistants in Healthcare Industry Market Outlook
The future of the Digital Assistants in Healthcare Industry market is bright, driven by ongoing technological advancements and increased adoption across all segments. Strategic partnerships and market expansion into new geographical areas and underserved populations will play a significant role in future growth. The focus on enhancing data security, improving user experience, and expanding the range of applications will further fuel market expansion. The market is poised for significant growth, with immense potential for innovation and transformation within the healthcare sector.
Digital Assistants in Healthcare Industry Segmentation
-
1. Product
- 1.1. Smart Speakers
- 1.2. Chatbots
-
2. User Interface
- 2.1. Automatic Speech Recognition
- 2.2. Text-Based
- 2.3. Text-to-Speech
-
3. Application
- 3.1. Patient Tracking
- 3.2. Medical Reference
- 3.3. Diagnostic Guides
- 3.4. Drug Dosage
- 3.5. Medical Calculators
- 3.6. Nursing Reference
- 3.7. Other Applications
-
4. End User
- 4.1. Healthcare Providers
- 4.2. Healthcare Payers
- 4.3. Patients
- 4.4. Other End Users
Digital Assistants in Healthcare Industry Segmentation By Geography
- 1. North America
- 2. Europe
- 3. Asia Pacific
- 4. Latin America
- 5. Middle East
Digital Assistants in Healthcare Industry REPORT HIGHLIGHTS
| Aspects | Details |
|---|---|
| Study Period | 2019-2033 |
| Base Year | 2024 |
| Estimated Year | 2025 |
| Forecast Period | 2025-2033 |
| Historical Period | 2019-2024 |
| Growth Rate | CAGR of 34.21% from 2019-2033 |
| Segmentation |
|
Table of Contents
- 1. Introduction
- 1.1. Research Scope
- 1.2. Market Segmentation
- 1.3. Research Methodology
- 1.4. Definitions and Assumptions
- 2. Executive Summary
- 2.1. Introduction
- 3. Market Dynamics
- 3.1. Introduction
- 3.2. Market Drivers
- 3.2.1. Growing Smartphone Users and Increasing Use of Healthcare Applications; Rising Prevalence of Chronic Disorders
- 3.3. Market Restrains
- 3.3.1. Lack of Structured Data in the Healthcare Industry; Concerns Regarding Data Privacy
- 3.4. Market Trends
- 3.4.1. Smart Speakers to Witness Significant Growth
- 4. Market Factor Analysis
- 4.1. Porters Five Forces
- 4.2. Supply/Value Chain
- 4.3. PESTEL analysis
- 4.4. Market Entropy
- 4.5. Patent/Trademark Analysis
- 5. Global Digital Assistants in Healthcare Industry Analysis, Insights and Forecast, 2019-2031
- 5.1. Market Analysis, Insights and Forecast - by Product
- 5.1.1. Smart Speakers
- 5.1.2. Chatbots
- 5.2. Market Analysis, Insights and Forecast - by User Interface
- 5.2.1. Automatic Speech Recognition
- 5.2.2. Text-Based
- 5.2.3. Text-to-Speech
- 5.3. Market Analysis, Insights and Forecast - by Application
- 5.3.1. Patient Tracking
- 5.3.2. Medical Reference
- 5.3.3. Diagnostic Guides
- 5.3.4. Drug Dosage
- 5.3.5. Medical Calculators
- 5.3.6. Nursing Reference
- 5.3.7. Other Applications
- 5.4. Market Analysis, Insights and Forecast - by End User
- 5.4.1. Healthcare Providers
- 5.4.2. Healthcare Payers
- 5.4.3. Patients
- 5.4.4. Other End Users
- 5.5. Market Analysis, Insights and Forecast - by Region
- 5.5.1. North America
- 5.5.2. Europe
- 5.5.3. Asia Pacific
- 5.5.4. Latin America
- 5.5.5. Middle East
- 5.1. Market Analysis, Insights and Forecast - by Product
- 6. North America Digital Assistants in Healthcare Industry Analysis, Insights and Forecast, 2019-2031
- 6.1. Market Analysis, Insights and Forecast - by Product
- 6.1.1. Smart Speakers
- 6.1.2. Chatbots
- 6.2. Market Analysis, Insights and Forecast - by User Interface
- 6.2.1. Automatic Speech Recognition
- 6.2.2. Text-Based
- 6.2.3. Text-to-Speech
- 6.3. Market Analysis, Insights and Forecast - by Application
- 6.3.1. Patient Tracking
- 6.3.2. Medical Reference
- 6.3.3. Diagnostic Guides
- 6.3.4. Drug Dosage
- 6.3.5. Medical Calculators
- 6.3.6. Nursing Reference
- 6.3.7. Other Applications
- 6.4. Market Analysis, Insights and Forecast - by End User
- 6.4.1. Healthcare Providers
- 6.4.2. Healthcare Payers
- 6.4.3. Patients
- 6.4.4. Other End Users
- 6.1. Market Analysis, Insights and Forecast - by Product
- 7. Europe Digital Assistants in Healthcare Industry Analysis, Insights and Forecast, 2019-2031
- 7.1. Market Analysis, Insights and Forecast - by Product
- 7.1.1. Smart Speakers
- 7.1.2. Chatbots
- 7.2. Market Analysis, Insights and Forecast - by User Interface
- 7.2.1. Automatic Speech Recognition
- 7.2.2. Text-Based
- 7.2.3. Text-to-Speech
- 7.3. Market Analysis, Insights and Forecast - by Application
- 7.3.1. Patient Tracking
- 7.3.2. Medical Reference
- 7.3.3. Diagnostic Guides
- 7.3.4. Drug Dosage
- 7.3.5. Medical Calculators
- 7.3.6. Nursing Reference
- 7.3.7. Other Applications
- 7.4. Market Analysis, Insights and Forecast - by End User
- 7.4.1. Healthcare Providers
- 7.4.2. Healthcare Payers
- 7.4.3. Patients
- 7.4.4. Other End Users
- 7.1. Market Analysis, Insights and Forecast - by Product
- 8. Asia Pacific Digital Assistants in Healthcare Industry Analysis, Insights and Forecast, 2019-2031
- 8.1. Market Analysis, Insights and Forecast - by Product
- 8.1.1. Smart Speakers
- 8.1.2. Chatbots
- 8.2. Market Analysis, Insights and Forecast - by User Interface
- 8.2.1. Automatic Speech Recognition
- 8.2.2. Text-Based
- 8.2.3. Text-to-Speech
- 8.3. Market Analysis, Insights and Forecast - by Application
- 8.3.1. Patient Tracking
- 8.3.2. Medical Reference
- 8.3.3. Diagnostic Guides
- 8.3.4. Drug Dosage
- 8.3.5. Medical Calculators
- 8.3.6. Nursing Reference
- 8.3.7. Other Applications
- 8.4. Market Analysis, Insights and Forecast - by End User
- 8.4.1. Healthcare Providers
- 8.4.2. Healthcare Payers
- 8.4.3. Patients
- 8.4.4. Other End Users
- 8.1. Market Analysis, Insights and Forecast - by Product
- 9. Latin America Digital Assistants in Healthcare Industry Analysis, Insights and Forecast, 2019-2031
- 9.1. Market Analysis, Insights and Forecast - by Product
- 9.1.1. Smart Speakers
- 9.1.2. Chatbots
- 9.2. Market Analysis, Insights and Forecast - by User Interface
- 9.2.1. Automatic Speech Recognition
- 9.2.2. Text-Based
- 9.2.3. Text-to-Speech
- 9.3. Market Analysis, Insights and Forecast - by Application
- 9.3.1. Patient Tracking
- 9.3.2. Medical Reference
- 9.3.3. Diagnostic Guides
- 9.3.4. Drug Dosage
- 9.3.5. Medical Calculators
- 9.3.6. Nursing Reference
- 9.3.7. Other Applications
- 9.4. Market Analysis, Insights and Forecast - by End User
- 9.4.1. Healthcare Providers
- 9.4.2. Healthcare Payers
- 9.4.3. Patients
- 9.4.4. Other End Users
- 9.1. Market Analysis, Insights and Forecast - by Product
- 10. Middle East Digital Assistants in Healthcare Industry Analysis, Insights and Forecast, 2019-2031
- 10.1. Market Analysis, Insights and Forecast - by Product
- 10.1.1. Smart Speakers
- 10.1.2. Chatbots
- 10.2. Market Analysis, Insights and Forecast - by User Interface
- 10.2.1. Automatic Speech Recognition
- 10.2.2. Text-Based
- 10.2.3. Text-to-Speech
- 10.3. Market Analysis, Insights and Forecast - by Application
- 10.3.1. Patient Tracking
- 10.3.2. Medical Reference
- 10.3.3. Diagnostic Guides
- 10.3.4. Drug Dosage
- 10.3.5. Medical Calculators
- 10.3.6. Nursing Reference
- 10.3.7. Other Applications
- 10.4. Market Analysis, Insights and Forecast - by End User
- 10.4.1. Healthcare Providers
- 10.4.2. Healthcare Payers
- 10.4.3. Patients
- 10.4.4. Other End Users
- 10.1. Market Analysis, Insights and Forecast - by Product
- 11. North America Digital Assistants in Healthcare Industry Analysis, Insights and Forecast, 2019-2031
- 11.1. Market Analysis, Insights and Forecast - By Country/Sub-region
- 11.1.1 United States
- 11.1.2 Canada
- 11.1.3 Mexico
- 12. Europe Digital Assistants in Healthcare Industry Analysis, Insights and Forecast, 2019-2031
- 12.1. Market Analysis, Insights and Forecast - By Country/Sub-region
- 12.1.1 Germany
- 12.1.2 United Kingdom
- 12.1.3 France
- 12.1.4 Spain
- 12.1.5 Italy
- 12.1.6 Spain
- 12.1.7 Belgium
- 12.1.8 Netherland
- 12.1.9 Nordics
- 12.1.10 Rest of Europe
- 13. Asia Pacific Digital Assistants in Healthcare Industry Analysis, Insights and Forecast, 2019-2031
- 13.1. Market Analysis, Insights and Forecast - By Country/Sub-region
- 13.1.1 China
- 13.1.2 Japan
- 13.1.3 India
- 13.1.4 South Korea
- 13.1.5 Southeast Asia
- 13.1.6 Australia
- 13.1.7 Indonesia
- 13.1.8 Phillipes
- 13.1.9 Singapore
- 13.1.10 Thailandc
- 13.1.11 Rest of Asia Pacific
- 14. South America Digital Assistants in Healthcare Industry Analysis, Insights and Forecast, 2019-2031
- 14.1. Market Analysis, Insights and Forecast - By Country/Sub-region
- 14.1.1 Brazil
- 14.1.2 Argentina
- 14.1.3 Peru
- 14.1.4 Chile
- 14.1.5 Colombia
- 14.1.6 Ecuador
- 14.1.7 Venezuela
- 14.1.8 Rest of South America
- 15. North America Digital Assistants in Healthcare Industry Analysis, Insights and Forecast, 2019-2031
- 15.1. Market Analysis, Insights and Forecast - By Country/Sub-region
- 15.1.1 United States
- 15.1.2 Canada
- 15.1.3 Mexico
- 16. MEA Digital Assistants in Healthcare Industry Analysis, Insights and Forecast, 2019-2031
- 16.1. Market Analysis, Insights and Forecast - By Country/Sub-region
- 16.1.1 United Arab Emirates
- 16.1.2 Saudi Arabia
- 16.1.3 South Africa
- 16.1.4 Rest of Middle East and Africa
- 17. Competitive Analysis
- 17.1. Global Market Share Analysis 2024
- 17.2. Company Profiles
- 17.2.1 Nuance Communications Inc
- 17.2.1.1. Overview
- 17.2.1.2. Products
- 17.2.1.3. SWOT Analysis
- 17.2.1.4. Recent Developments
- 17.2.1.5. Financials (Based on Availability)
- 17.2.2 CSS Corporation Pvt Ltd
- 17.2.2.1. Overview
- 17.2.2.2. Products
- 17.2.2.3. SWOT Analysis
- 17.2.2.4. Recent Developments
- 17.2.2.5. Financials (Based on Availability)
- 17.2.3 Medrespond LLC
- 17.2.3.1. Overview
- 17.2.3.2. Products
- 17.2.3.3. SWOT Analysis
- 17.2.3.4. Recent Developments
- 17.2.3.5. Financials (Based on Availability)
- 17.2.4 Healthtap Inc
- 17.2.4.1. Overview
- 17.2.4.2. Products
- 17.2.4.3. SWOT Analysis
- 17.2.4.4. Recent Developments
- 17.2.4.5. Financials (Based on Availability)
- 17.2.5 ADA Digital Health
- 17.2.5.1. Overview
- 17.2.5.2. Products
- 17.2.5.3. SWOT Analysis
- 17.2.5.4. Recent Developments
- 17.2.5.5. Financials (Based on Availability)
- 17.2.6 Infermedica Sp z o o
- 17.2.6.1. Overview
- 17.2.6.2. Products
- 17.2.6.3. SWOT Analysis
- 17.2.6.4. Recent Developments
- 17.2.6.5. Financials (Based on Availability)
- 17.2.7 Microsoft Corporation
- 17.2.7.1. Overview
- 17.2.7.2. Products
- 17.2.7.3. SWOT Analysis
- 17.2.7.4. Recent Developments
- 17.2.7.5. Financials (Based on Availability)
- 17.2.8 eGain Corporation
- 17.2.8.1. Overview
- 17.2.8.2. Products
- 17.2.8.3. SWOT Analysis
- 17.2.8.4. Recent Developments
- 17.2.8.5. Financials (Based on Availability)
- 17.2.9 Verint Systems Inc
- 17.2.9.1. Overview
- 17.2.9.2. Products
- 17.2.9.3. SWOT Analysis
- 17.2.9.4. Recent Developments
- 17.2.9.5. Financials (Based on Availability)
- 17.2.10 True Image Interactive Inc
- 17.2.10.1. Overview
- 17.2.10.2. Products
- 17.2.10.3. SWOT Analysis
- 17.2.10.4. Recent Developments
- 17.2.10.5. Financials (Based on Availability)
- 17.2.11 Babylon Healthcare Services Limited
- 17.2.11.1. Overview
- 17.2.11.2. Products
- 17.2.11.3. SWOT Analysis
- 17.2.11.4. Recent Developments
- 17.2.11.5. Financials (Based on Availability)
- 17.2.12 Floatbot AI
- 17.2.12.1. Overview
- 17.2.12.2. Products
- 17.2.12.3. SWOT Analysis
- 17.2.12.4. Recent Developments
- 17.2.12.5. Financials (Based on Availability)
- 17.2.13 Amazon com Inc
- 17.2.13.1. Overview
- 17.2.13.2. Products
- 17.2.13.3. SWOT Analysis
- 17.2.13.4. Recent Developments
- 17.2.13.5. Financials (Based on Availability)
- 17.2.14 Sensely Inc
- 17.2.14.1. Overview
- 17.2.14.2. Products
- 17.2.14.3. SWOT Analysis
- 17.2.14.4. Recent Developments
- 17.2.14.5. Financials (Based on Availability)
- 17.2.15 Kore AI Inc
- 17.2.15.1. Overview
- 17.2.15.2. Products
- 17.2.15.3. SWOT Analysis
- 17.2.15.4. Recent Developments
- 17.2.15.5. Financials (Based on Availability)
- 17.2.1 Nuance Communications Inc
List of Figures
- Figure 1: Global Digital Assistants in Healthcare Industry Revenue Breakdown (Million, %) by Region 2024 & 2032
- Figure 2: Global Digital Assistants in Healthcare Industry Volume Breakdown (K Unit, %) by Region 2024 & 2032
- Figure 3: North America Digital Assistants in Healthcare Industry Revenue (Million), by Country 2024 & 2032
- Figure 4: North America Digital Assistants in Healthcare Industry Volume (K Unit), by Country 2024 & 2032
- Figure 5: North America Digital Assistants in Healthcare Industry Revenue Share (%), by Country 2024 & 2032
- Figure 6: North America Digital Assistants in Healthcare Industry Volume Share (%), by Country 2024 & 2032
- Figure 7: Europe Digital Assistants in Healthcare Industry Revenue (Million), by Country 2024 & 2032
- Figure 8: Europe Digital Assistants in Healthcare Industry Volume (K Unit), by Country 2024 & 2032
- Figure 9: Europe Digital Assistants in Healthcare Industry Revenue Share (%), by Country 2024 & 2032
- Figure 10: Europe Digital Assistants in Healthcare Industry Volume Share (%), by Country 2024 & 2032
- Figure 11: Asia Pacific Digital Assistants in Healthcare Industry Revenue (Million), by Country 2024 & 2032
- Figure 12: Asia Pacific Digital Assistants in Healthcare Industry Volume (K Unit), by Country 2024 & 2032
- Figure 13: Asia Pacific Digital Assistants in Healthcare Industry Revenue Share (%), by Country 2024 & 2032
- Figure 14: Asia Pacific Digital Assistants in Healthcare Industry Volume Share (%), by Country 2024 & 2032
- Figure 15: South America Digital Assistants in Healthcare Industry Revenue (Million), by Country 2024 & 2032
- Figure 16: South America Digital Assistants in Healthcare Industry Volume (K Unit), by Country 2024 & 2032
- Figure 17: South America Digital Assistants in Healthcare Industry Revenue Share (%), by Country 2024 & 2032
- Figure 18: South America Digital Assistants in Healthcare Industry Volume Share (%), by Country 2024 & 2032
- Figure 19: North America Digital Assistants in Healthcare Industry Revenue (Million), by Country 2024 & 2032
- Figure 20: North America Digital Assistants in Healthcare Industry Volume (K Unit), by Country 2024 & 2032
- Figure 21: North America Digital Assistants in Healthcare Industry Revenue Share (%), by Country 2024 & 2032
- Figure 22: North America Digital Assistants in Healthcare Industry Volume Share (%), by Country 2024 & 2032
- Figure 23: MEA Digital Assistants in Healthcare Industry Revenue (Million), by Country 2024 & 2032
- Figure 24: MEA Digital Assistants in Healthcare Industry Volume (K Unit), by Country 2024 & 2032
- Figure 25: MEA Digital Assistants in Healthcare Industry Revenue Share (%), by Country 2024 & 2032
- Figure 26: MEA Digital Assistants in Healthcare Industry Volume Share (%), by Country 2024 & 2032
- Figure 27: North America Digital Assistants in Healthcare Industry Revenue (Million), by Product 2024 & 2032
- Figure 28: North America Digital Assistants in Healthcare Industry Volume (K Unit), by Product 2024 & 2032
- Figure 29: North America Digital Assistants in Healthcare Industry Revenue Share (%), by Product 2024 & 2032
- Figure 30: North America Digital Assistants in Healthcare Industry Volume Share (%), by Product 2024 & 2032
- Figure 31: North America Digital Assistants in Healthcare Industry Revenue (Million), by User Interface 2024 & 2032
- Figure 32: North America Digital Assistants in Healthcare Industry Volume (K Unit), by User Interface 2024 & 2032
- Figure 33: North America Digital Assistants in Healthcare Industry Revenue Share (%), by User Interface 2024 & 2032
- Figure 34: North America Digital Assistants in Healthcare Industry Volume Share (%), by User Interface 2024 & 2032
- Figure 35: North America Digital Assistants in Healthcare Industry Revenue (Million), by Application 2024 & 2032
- Figure 36: North America Digital Assistants in Healthcare Industry Volume (K Unit), by Application 2024 & 2032
- Figure 37: North America Digital Assistants in Healthcare Industry Revenue Share (%), by Application 2024 & 2032
- Figure 38: North America Digital Assistants in Healthcare Industry Volume Share (%), by Application 2024 & 2032
- Figure 39: North America Digital Assistants in Healthcare Industry Revenue (Million), by End User 2024 & 2032
- Figure 40: North America Digital Assistants in Healthcare Industry Volume (K Unit), by End User 2024 & 2032
- Figure 41: North America Digital Assistants in Healthcare Industry Revenue Share (%), by End User 2024 & 2032
- Figure 42: North America Digital Assistants in Healthcare Industry Volume Share (%), by End User 2024 & 2032
- Figure 43: North America Digital Assistants in Healthcare Industry Revenue (Million), by Country 2024 & 2032
- Figure 44: North America Digital Assistants in Healthcare Industry Volume (K Unit), by Country 2024 & 2032
- Figure 45: North America Digital Assistants in Healthcare Industry Revenue Share (%), by Country 2024 & 2032
- Figure 46: North America Digital Assistants in Healthcare Industry Volume Share (%), by Country 2024 & 2032
- Figure 47: Europe Digital Assistants in Healthcare Industry Revenue (Million), by Product 2024 & 2032
- Figure 48: Europe Digital Assistants in Healthcare Industry Volume (K Unit), by Product 2024 & 2032
- Figure 49: Europe Digital Assistants in Healthcare Industry Revenue Share (%), by Product 2024 & 2032
- Figure 50: Europe Digital Assistants in Healthcare Industry Volume Share (%), by Product 2024 & 2032
- Figure 51: Europe Digital Assistants in Healthcare Industry Revenue (Million), by User Interface 2024 & 2032
- Figure 52: Europe Digital Assistants in Healthcare Industry Volume (K Unit), by User Interface 2024 & 2032
- Figure 53: Europe Digital Assistants in Healthcare Industry Revenue Share (%), by User Interface 2024 & 2032
- Figure 54: Europe Digital Assistants in Healthcare Industry Volume Share (%), by User Interface 2024 & 2032
- Figure 55: Europe Digital Assistants in Healthcare Industry Revenue (Million), by Application 2024 & 2032
- Figure 56: Europe Digital Assistants in Healthcare Industry Volume (K Unit), by Application 2024 & 2032
- Figure 57: Europe Digital Assistants in Healthcare Industry Revenue Share (%), by Application 2024 & 2032
- Figure 58: Europe Digital Assistants in Healthcare Industry Volume Share (%), by Application 2024 & 2032
- Figure 59: Europe Digital Assistants in Healthcare Industry Revenue (Million), by End User 2024 & 2032
- Figure 60: Europe Digital Assistants in Healthcare Industry Volume (K Unit), by End User 2024 & 2032
- Figure 61: Europe Digital Assistants in Healthcare Industry Revenue Share (%), by End User 2024 & 2032
- Figure 62: Europe Digital Assistants in Healthcare Industry Volume Share (%), by End User 2024 & 2032
- Figure 63: Europe Digital Assistants in Healthcare Industry Revenue (Million), by Country 2024 & 2032
- Figure 64: Europe Digital Assistants in Healthcare Industry Volume (K Unit), by Country 2024 & 2032
- Figure 65: Europe Digital Assistants in Healthcare Industry Revenue Share (%), by Country 2024 & 2032
- Figure 66: Europe Digital Assistants in Healthcare Industry Volume Share (%), by Country 2024 & 2032
- Figure 67: Asia Pacific Digital Assistants in Healthcare Industry Revenue (Million), by Product 2024 & 2032
- Figure 68: Asia Pacific Digital Assistants in Healthcare Industry Volume (K Unit), by Product 2024 & 2032
- Figure 69: Asia Pacific Digital Assistants in Healthcare Industry Revenue Share (%), by Product 2024 & 2032
- Figure 70: Asia Pacific Digital Assistants in Healthcare Industry Volume Share (%), by Product 2024 & 2032
- Figure 71: Asia Pacific Digital Assistants in Healthcare Industry Revenue (Million), by User Interface 2024 & 2032
- Figure 72: Asia Pacific Digital Assistants in Healthcare Industry Volume (K Unit), by User Interface 2024 & 2032
- Figure 73: Asia Pacific Digital Assistants in Healthcare Industry Revenue Share (%), by User Interface 2024 & 2032
- Figure 74: Asia Pacific Digital Assistants in Healthcare Industry Volume Share (%), by User Interface 2024 & 2032
- Figure 75: Asia Pacific Digital Assistants in Healthcare Industry Revenue (Million), by Application 2024 & 2032
- Figure 76: Asia Pacific Digital Assistants in Healthcare Industry Volume (K Unit), by Application 2024 & 2032
- Figure 77: Asia Pacific Digital Assistants in Healthcare Industry Revenue Share (%), by Application 2024 & 2032
- Figure 78: Asia Pacific Digital Assistants in Healthcare Industry Volume Share (%), by Application 2024 & 2032
- Figure 79: Asia Pacific Digital Assistants in Healthcare Industry Revenue (Million), by End User 2024 & 2032
- Figure 80: Asia Pacific Digital Assistants in Healthcare Industry Volume (K Unit), by End User 2024 & 2032
- Figure 81: Asia Pacific Digital Assistants in Healthcare Industry Revenue Share (%), by End User 2024 & 2032
- Figure 82: Asia Pacific Digital Assistants in Healthcare Industry Volume Share (%), by End User 2024 & 2032
- Figure 83: Asia Pacific Digital Assistants in Healthcare Industry Revenue (Million), by Country 2024 & 2032
- Figure 84: Asia Pacific Digital Assistants in Healthcare Industry Volume (K Unit), by Country 2024 & 2032
- Figure 85: Asia Pacific Digital Assistants in Healthcare Industry Revenue Share (%), by Country 2024 & 2032
- Figure 86: Asia Pacific Digital Assistants in Healthcare Industry Volume Share (%), by Country 2024 & 2032
- Figure 87: Latin America Digital Assistants in Healthcare Industry Revenue (Million), by Product 2024 & 2032
- Figure 88: Latin America Digital Assistants in Healthcare Industry Volume (K Unit), by Product 2024 & 2032
- Figure 89: Latin America Digital Assistants in Healthcare Industry Revenue Share (%), by Product 2024 & 2032
- Figure 90: Latin America Digital Assistants in Healthcare Industry Volume Share (%), by Product 2024 & 2032
- Figure 91: Latin America Digital Assistants in Healthcare Industry Revenue (Million), by User Interface 2024 & 2032
- Figure 92: Latin America Digital Assistants in Healthcare Industry Volume (K Unit), by User Interface 2024 & 2032
- Figure 93: Latin America Digital Assistants in Healthcare Industry Revenue Share (%), by User Interface 2024 & 2032
- Figure 94: Latin America Digital Assistants in Healthcare Industry Volume Share (%), by User Interface 2024 & 2032
- Figure 95: Latin America Digital Assistants in Healthcare Industry Revenue (Million), by Application 2024 & 2032
- Figure 96: Latin America Digital Assistants in Healthcare Industry Volume (K Unit), by Application 2024 & 2032
- Figure 97: Latin America Digital Assistants in Healthcare Industry Revenue Share (%), by Application 2024 & 2032
- Figure 98: Latin America Digital Assistants in Healthcare Industry Volume Share (%), by Application 2024 & 2032
- Figure 99: Latin America Digital Assistants in Healthcare Industry Revenue (Million), by End User 2024 & 2032
- Figure 100: Latin America Digital Assistants in Healthcare Industry Volume (K Unit), by End User 2024 & 2032
- Figure 101: Latin America Digital Assistants in Healthcare Industry Revenue Share (%), by End User 2024 & 2032
- Figure 102: Latin America Digital Assistants in Healthcare Industry Volume Share (%), by End User 2024 & 2032
- Figure 103: Latin America Digital Assistants in Healthcare Industry Revenue (Million), by Country 2024 & 2032
- Figure 104: Latin America Digital Assistants in Healthcare Industry Volume (K Unit), by Country 2024 & 2032
- Figure 105: Latin America Digital Assistants in Healthcare Industry Revenue Share (%), by Country 2024 & 2032
- Figure 106: Latin America Digital Assistants in Healthcare Industry Volume Share (%), by Country 2024 & 2032
- Figure 107: Middle East Digital Assistants in Healthcare Industry Revenue (Million), by Product 2024 & 2032
- Figure 108: Middle East Digital Assistants in Healthcare Industry Volume (K Unit), by Product 2024 & 2032
- Figure 109: Middle East Digital Assistants in Healthcare Industry Revenue Share (%), by Product 2024 & 2032
- Figure 110: Middle East Digital Assistants in Healthcare Industry Volume Share (%), by Product 2024 & 2032
- Figure 111: Middle East Digital Assistants in Healthcare Industry Revenue (Million), by User Interface 2024 & 2032
- Figure 112: Middle East Digital Assistants in Healthcare Industry Volume (K Unit), by User Interface 2024 & 2032
- Figure 113: Middle East Digital Assistants in Healthcare Industry Revenue Share (%), by User Interface 2024 & 2032
- Figure 114: Middle East Digital Assistants in Healthcare Industry Volume Share (%), by User Interface 2024 & 2032
- Figure 115: Middle East Digital Assistants in Healthcare Industry Revenue (Million), by Application 2024 & 2032
- Figure 116: Middle East Digital Assistants in Healthcare Industry Volume (K Unit), by Application 2024 & 2032
- Figure 117: Middle East Digital Assistants in Healthcare Industry Revenue Share (%), by Application 2024 & 2032
- Figure 118: Middle East Digital Assistants in Healthcare Industry Volume Share (%), by Application 2024 & 2032
- Figure 119: Middle East Digital Assistants in Healthcare Industry Revenue (Million), by End User 2024 & 2032
- Figure 120: Middle East Digital Assistants in Healthcare Industry Volume (K Unit), by End User 2024 & 2032
- Figure 121: Middle East Digital Assistants in Healthcare Industry Revenue Share (%), by End User 2024 & 2032
- Figure 122: Middle East Digital Assistants in Healthcare Industry Volume Share (%), by End User 2024 & 2032
- Figure 123: Middle East Digital Assistants in Healthcare Industry Revenue (Million), by Country 2024 & 2032
- Figure 124: Middle East Digital Assistants in Healthcare Industry Volume (K Unit), by Country 2024 & 2032
- Figure 125: Middle East Digital Assistants in Healthcare Industry Revenue Share (%), by Country 2024 & 2032
- Figure 126: Middle East Digital Assistants in Healthcare Industry Volume Share (%), by Country 2024 & 2032
List of Tables
- Table 1: Global Digital Assistants in Healthcare Industry Revenue Million Forecast, by Region 2019 & 2032
- Table 2: Global Digital Assistants in Healthcare Industry Volume K Unit Forecast, by Region 2019 & 2032
- Table 3: Global Digital Assistants in Healthcare Industry Revenue Million Forecast, by Product 2019 & 2032
- Table 4: Global Digital Assistants in Healthcare Industry Volume K Unit Forecast, by Product 2019 & 2032
- Table 5: Global Digital Assistants in Healthcare Industry Revenue Million Forecast, by User Interface 2019 & 2032
- Table 6: Global Digital Assistants in Healthcare Industry Volume K Unit Forecast, by User Interface 2019 & 2032
- Table 7: Global Digital Assistants in Healthcare Industry Revenue Million Forecast, by Application 2019 & 2032
- Table 8: Global Digital Assistants in Healthcare Industry Volume K Unit Forecast, by Application 2019 & 2032
- Table 9: Global Digital Assistants in Healthcare Industry Revenue Million Forecast, by End User 2019 & 2032
- Table 10: Global Digital Assistants in Healthcare Industry Volume K Unit Forecast, by End User 2019 & 2032
- Table 11: Global Digital Assistants in Healthcare Industry Revenue Million Forecast, by Region 2019 & 2032
- Table 12: Global Digital Assistants in Healthcare Industry Volume K Unit Forecast, by Region 2019 & 2032
- Table 13: Global Digital Assistants in Healthcare Industry Revenue Million Forecast, by Country 2019 & 2032
- Table 14: Global Digital Assistants in Healthcare Industry Volume K Unit Forecast, by Country 2019 & 2032
- Table 15: United States Digital Assistants in Healthcare Industry Revenue (Million) Forecast, by Application 2019 & 2032
- Table 16: United States Digital Assistants in Healthcare Industry Volume (K Unit) Forecast, by Application 2019 & 2032
- Table 17: Canada Digital Assistants in Healthcare Industry Revenue (Million) Forecast, by Application 2019 & 2032
- Table 18: Canada Digital Assistants in Healthcare Industry Volume (K Unit) Forecast, by Application 2019 & 2032
- Table 19: Mexico Digital Assistants in Healthcare Industry Revenue (Million) Forecast, by Application 2019 & 2032
- Table 20: Mexico Digital Assistants in Healthcare Industry Volume (K Unit) Forecast, by Application 2019 & 2032
- Table 21: Global Digital Assistants in Healthcare Industry Revenue Million Forecast, by Country 2019 & 2032
- Table 22: Global Digital Assistants in Healthcare Industry Volume K Unit Forecast, by Country 2019 & 2032
- Table 23: Germany Digital Assistants in Healthcare Industry Revenue (Million) Forecast, by Application 2019 & 2032
- Table 24: Germany Digital Assistants in Healthcare Industry Volume (K Unit) Forecast, by Application 2019 & 2032
- Table 25: United Kingdom Digital Assistants in Healthcare Industry Revenue (Million) Forecast, by Application 2019 & 2032
- Table 26: United Kingdom Digital Assistants in Healthcare Industry Volume (K Unit) Forecast, by Application 2019 & 2032
- Table 27: France Digital Assistants in Healthcare Industry Revenue (Million) Forecast, by Application 2019 & 2032
- Table 28: France Digital Assistants in Healthcare Industry Volume (K Unit) Forecast, by Application 2019 & 2032
- Table 29: Spain Digital Assistants in Healthcare Industry Revenue (Million) Forecast, by Application 2019 & 2032
- Table 30: Spain Digital Assistants in Healthcare Industry Volume (K Unit) Forecast, by Application 2019 & 2032
- Table 31: Italy Digital Assistants in Healthcare Industry Revenue (Million) Forecast, by Application 2019 & 2032
- Table 32: Italy Digital Assistants in Healthcare Industry Volume (K Unit) Forecast, by Application 2019 & 2032
- Table 33: Spain Digital Assistants in Healthcare Industry Revenue (Million) Forecast, by Application 2019 & 2032
- Table 34: Spain Digital Assistants in Healthcare Industry Volume (K Unit) Forecast, by Application 2019 & 2032
- Table 35: Belgium Digital Assistants in Healthcare Industry Revenue (Million) Forecast, by Application 2019 & 2032
- Table 36: Belgium Digital Assistants in Healthcare Industry Volume (K Unit) Forecast, by Application 2019 & 2032
- Table 37: Netherland Digital Assistants in Healthcare Industry Revenue (Million) Forecast, by Application 2019 & 2032
- Table 38: Netherland Digital Assistants in Healthcare Industry Volume (K Unit) Forecast, by Application 2019 & 2032
- Table 39: Nordics Digital Assistants in Healthcare Industry Revenue (Million) Forecast, by Application 2019 & 2032
- Table 40: Nordics Digital Assistants in Healthcare Industry Volume (K Unit) Forecast, by Application 2019 & 2032
- Table 41: Rest of Europe Digital Assistants in Healthcare Industry Revenue (Million) Forecast, by Application 2019 & 2032
- Table 42: Rest of Europe Digital Assistants in Healthcare Industry Volume (K Unit) Forecast, by Application 2019 & 2032
- Table 43: Global Digital Assistants in Healthcare Industry Revenue Million Forecast, by Country 2019 & 2032
- Table 44: Global Digital Assistants in Healthcare Industry Volume K Unit Forecast, by Country 2019 & 2032
- Table 45: China Digital Assistants in Healthcare Industry Revenue (Million) Forecast, by Application 2019 & 2032
- Table 46: China Digital Assistants in Healthcare Industry Volume (K Unit) Forecast, by Application 2019 & 2032
- Table 47: Japan Digital Assistants in Healthcare Industry Revenue (Million) Forecast, by Application 2019 & 2032
- Table 48: Japan Digital Assistants in Healthcare Industry Volume (K Unit) Forecast, by Application 2019 & 2032
- Table 49: India Digital Assistants in Healthcare Industry Revenue (Million) Forecast, by Application 2019 & 2032
- Table 50: India Digital Assistants in Healthcare Industry Volume (K Unit) Forecast, by Application 2019 & 2032
- Table 51: South Korea Digital Assistants in Healthcare Industry Revenue (Million) Forecast, by Application 2019 & 2032
- Table 52: South Korea Digital Assistants in Healthcare Industry Volume (K Unit) Forecast, by Application 2019 & 2032
- Table 53: Southeast Asia Digital Assistants in Healthcare Industry Revenue (Million) Forecast, by Application 2019 & 2032
- Table 54: Southeast Asia Digital Assistants in Healthcare Industry Volume (K Unit) Forecast, by Application 2019 & 2032
- Table 55: Australia Digital Assistants in Healthcare Industry Revenue (Million) Forecast, by Application 2019 & 2032
- Table 56: Australia Digital Assistants in Healthcare Industry Volume (K Unit) Forecast, by Application 2019 & 2032
- Table 57: Indonesia Digital Assistants in Healthcare Industry Revenue (Million) Forecast, by Application 2019 & 2032
- Table 58: Indonesia Digital Assistants in Healthcare Industry Volume (K Unit) Forecast, by Application 2019 & 2032
- Table 59: Phillipes Digital Assistants in Healthcare Industry Revenue (Million) Forecast, by Application 2019 & 2032
- Table 60: Phillipes Digital Assistants in Healthcare Industry Volume (K Unit) Forecast, by Application 2019 & 2032
- Table 61: Singapore Digital Assistants in Healthcare Industry Revenue (Million) Forecast, by Application 2019 & 2032
- Table 62: Singapore Digital Assistants in Healthcare Industry Volume (K Unit) Forecast, by Application 2019 & 2032
- Table 63: Thailandc Digital Assistants in Healthcare Industry Revenue (Million) Forecast, by Application 2019 & 2032
- Table 64: Thailandc Digital Assistants in Healthcare Industry Volume (K Unit) Forecast, by Application 2019 & 2032
- Table 65: Rest of Asia Pacific Digital Assistants in Healthcare Industry Revenue (Million) Forecast, by Application 2019 & 2032
- Table 66: Rest of Asia Pacific Digital Assistants in Healthcare Industry Volume (K Unit) Forecast, by Application 2019 & 2032
- Table 67: Global Digital Assistants in Healthcare Industry Revenue Million Forecast, by Country 2019 & 2032
- Table 68: Global Digital Assistants in Healthcare Industry Volume K Unit Forecast, by Country 2019 & 2032
- Table 69: Brazil Digital Assistants in Healthcare Industry Revenue (Million) Forecast, by Application 2019 & 2032
- Table 70: Brazil Digital Assistants in Healthcare Industry Volume (K Unit) Forecast, by Application 2019 & 2032
- Table 71: Argentina Digital Assistants in Healthcare Industry Revenue (Million) Forecast, by Application 2019 & 2032
- Table 72: Argentina Digital Assistants in Healthcare Industry Volume (K Unit) Forecast, by Application 2019 & 2032
- Table 73: Peru Digital Assistants in Healthcare Industry Revenue (Million) Forecast, by Application 2019 & 2032
- Table 74: Peru Digital Assistants in Healthcare Industry Volume (K Unit) Forecast, by Application 2019 & 2032
- Table 75: Chile Digital Assistants in Healthcare Industry Revenue (Million) Forecast, by Application 2019 & 2032
- Table 76: Chile Digital Assistants in Healthcare Industry Volume (K Unit) Forecast, by Application 2019 & 2032
- Table 77: Colombia Digital Assistants in Healthcare Industry Revenue (Million) Forecast, by Application 2019 & 2032
- Table 78: Colombia Digital Assistants in Healthcare Industry Volume (K Unit) Forecast, by Application 2019 & 2032
- Table 79: Ecuador Digital Assistants in Healthcare Industry Revenue (Million) Forecast, by Application 2019 & 2032
- Table 80: Ecuador Digital Assistants in Healthcare Industry Volume (K Unit) Forecast, by Application 2019 & 2032
- Table 81: Venezuela Digital Assistants in Healthcare Industry Revenue (Million) Forecast, by Application 2019 & 2032
- Table 82: Venezuela Digital Assistants in Healthcare Industry Volume (K Unit) Forecast, by Application 2019 & 2032
- Table 83: Rest of South America Digital Assistants in Healthcare Industry Revenue (Million) Forecast, by Application 2019 & 2032
- Table 84: Rest of South America Digital Assistants in Healthcare Industry Volume (K Unit) Forecast, by Application 2019 & 2032
- Table 85: Global Digital Assistants in Healthcare Industry Revenue Million Forecast, by Country 2019 & 2032
- Table 86: Global Digital Assistants in Healthcare Industry Volume K Unit Forecast, by Country 2019 & 2032
- Table 87: United States Digital Assistants in Healthcare Industry Revenue (Million) Forecast, by Application 2019 & 2032
- Table 88: United States Digital Assistants in Healthcare Industry Volume (K Unit) Forecast, by Application 2019 & 2032
- Table 89: Canada Digital Assistants in Healthcare Industry Revenue (Million) Forecast, by Application 2019 & 2032
- Table 90: Canada Digital Assistants in Healthcare Industry Volume (K Unit) Forecast, by Application 2019 & 2032
- Table 91: Mexico Digital Assistants in Healthcare Industry Revenue (Million) Forecast, by Application 2019 & 2032
- Table 92: Mexico Digital Assistants in Healthcare Industry Volume (K Unit) Forecast, by Application 2019 & 2032
- Table 93: Global Digital Assistants in Healthcare Industry Revenue Million Forecast, by Country 2019 & 2032
- Table 94: Global Digital Assistants in Healthcare Industry Volume K Unit Forecast, by Country 2019 & 2032
- Table 95: United Arab Emirates Digital Assistants in Healthcare Industry Revenue (Million) Forecast, by Application 2019 & 2032
- Table 96: United Arab Emirates Digital Assistants in Healthcare Industry Volume (K Unit) Forecast, by Application 2019 & 2032
- Table 97: Saudi Arabia Digital Assistants in Healthcare Industry Revenue (Million) Forecast, by Application 2019 & 2032
- Table 98: Saudi Arabia Digital Assistants in Healthcare Industry Volume (K Unit) Forecast, by Application 2019 & 2032
- Table 99: South Africa Digital Assistants in Healthcare Industry Revenue (Million) Forecast, by Application 2019 & 2032
- Table 100: South Africa Digital Assistants in Healthcare Industry Volume (K Unit) Forecast, by Application 2019 & 2032
- Table 101: Rest of Middle East and Africa Digital Assistants in Healthcare Industry Revenue (Million) Forecast, by Application 2019 & 2032
- Table 102: Rest of Middle East and Africa Digital Assistants in Healthcare Industry Volume (K Unit) Forecast, by Application 2019 & 2032
- Table 103: Global Digital Assistants in Healthcare Industry Revenue Million Forecast, by Product 2019 & 2032
- Table 104: Global Digital Assistants in Healthcare Industry Volume K Unit Forecast, by Product 2019 & 2032
- Table 105: Global Digital Assistants in Healthcare Industry Revenue Million Forecast, by User Interface 2019 & 2032
- Table 106: Global Digital Assistants in Healthcare Industry Volume K Unit Forecast, by User Interface 2019 & 2032
- Table 107: Global Digital Assistants in Healthcare Industry Revenue Million Forecast, by Application 2019 & 2032
- Table 108: Global Digital Assistants in Healthcare Industry Volume K Unit Forecast, by Application 2019 & 2032
- Table 109: Global Digital Assistants in Healthcare Industry Revenue Million Forecast, by End User 2019 & 2032
- Table 110: Global Digital Assistants in Healthcare Industry Volume K Unit Forecast, by End User 2019 & 2032
- Table 111: Global Digital Assistants in Healthcare Industry Revenue Million Forecast, by Country 2019 & 2032
- Table 112: Global Digital Assistants in Healthcare Industry Volume K Unit Forecast, by Country 2019 & 2032
- Table 113: Global Digital Assistants in Healthcare Industry Revenue Million Forecast, by Product 2019 & 2032
- Table 114: Global Digital Assistants in Healthcare Industry Volume K Unit Forecast, by Product 2019 & 2032
- Table 115: Global Digital Assistants in Healthcare Industry Revenue Million Forecast, by User Interface 2019 & 2032
- Table 116: Global Digital Assistants in Healthcare Industry Volume K Unit Forecast, by User Interface 2019 & 2032
- Table 117: Global Digital Assistants in Healthcare Industry Revenue Million Forecast, by Application 2019 & 2032
- Table 118: Global Digital Assistants in Healthcare Industry Volume K Unit Forecast, by Application 2019 & 2032
- Table 119: Global Digital Assistants in Healthcare Industry Revenue Million Forecast, by End User 2019 & 2032
- Table 120: Global Digital Assistants in Healthcare Industry Volume K Unit Forecast, by End User 2019 & 2032
- Table 121: Global Digital Assistants in Healthcare Industry Revenue Million Forecast, by Country 2019 & 2032
- Table 122: Global Digital Assistants in Healthcare Industry Volume K Unit Forecast, by Country 2019 & 2032
- Table 123: Global Digital Assistants in Healthcare Industry Revenue Million Forecast, by Product 2019 & 2032
- Table 124: Global Digital Assistants in Healthcare Industry Volume K Unit Forecast, by Product 2019 & 2032
- Table 125: Global Digital Assistants in Healthcare Industry Revenue Million Forecast, by User Interface 2019 & 2032
- Table 126: Global Digital Assistants in Healthcare Industry Volume K Unit Forecast, by User Interface 2019 & 2032
- Table 127: Global Digital Assistants in Healthcare Industry Revenue Million Forecast, by Application 2019 & 2032
- Table 128: Global Digital Assistants in Healthcare Industry Volume K Unit Forecast, by Application 2019 & 2032
- Table 129: Global Digital Assistants in Healthcare Industry Revenue Million Forecast, by End User 2019 & 2032
- Table 130: Global Digital Assistants in Healthcare Industry Volume K Unit Forecast, by End User 2019 & 2032
- Table 131: Global Digital Assistants in Healthcare Industry Revenue Million Forecast, by Country 2019 & 2032
- Table 132: Global Digital Assistants in Healthcare Industry Volume K Unit Forecast, by Country 2019 & 2032
- Table 133: Global Digital Assistants in Healthcare Industry Revenue Million Forecast, by Product 2019 & 2032
- Table 134: Global Digital Assistants in Healthcare Industry Volume K Unit Forecast, by Product 2019 & 2032
- Table 135: Global Digital Assistants in Healthcare Industry Revenue Million Forecast, by User Interface 2019 & 2032
- Table 136: Global Digital Assistants in Healthcare Industry Volume K Unit Forecast, by User Interface 2019 & 2032
- Table 137: Global Digital Assistants in Healthcare Industry Revenue Million Forecast, by Application 2019 & 2032
- Table 138: Global Digital Assistants in Healthcare Industry Volume K Unit Forecast, by Application 2019 & 2032
- Table 139: Global Digital Assistants in Healthcare Industry Revenue Million Forecast, by End User 2019 & 2032
- Table 140: Global Digital Assistants in Healthcare Industry Volume K Unit Forecast, by End User 2019 & 2032
- Table 141: Global Digital Assistants in Healthcare Industry Revenue Million Forecast, by Country 2019 & 2032
- Table 142: Global Digital Assistants in Healthcare Industry Volume K Unit Forecast, by Country 2019 & 2032
- Table 143: Global Digital Assistants in Healthcare Industry Revenue Million Forecast, by Product 2019 & 2032
- Table 144: Global Digital Assistants in Healthcare Industry Volume K Unit Forecast, by Product 2019 & 2032
- Table 145: Global Digital Assistants in Healthcare Industry Revenue Million Forecast, by User Interface 2019 & 2032
- Table 146: Global Digital Assistants in Healthcare Industry Volume K Unit Forecast, by User Interface 2019 & 2032
- Table 147: Global Digital Assistants in Healthcare Industry Revenue Million Forecast, by Application 2019 & 2032
- Table 148: Global Digital Assistants in Healthcare Industry Volume K Unit Forecast, by Application 2019 & 2032
- Table 149: Global Digital Assistants in Healthcare Industry Revenue Million Forecast, by End User 2019 & 2032
- Table 150: Global Digital Assistants in Healthcare Industry Volume K Unit Forecast, by End User 2019 & 2032
- Table 151: Global Digital Assistants in Healthcare Industry Revenue Million Forecast, by Country 2019 & 2032
- Table 152: Global Digital Assistants in Healthcare Industry Volume K Unit Forecast, by Country 2019 & 2032
Frequently Asked Questions
1. What is the projected Compound Annual Growth Rate (CAGR) of the Digital Assistants in Healthcare Industry?
The projected CAGR is approximately 34.21%.
2. Which companies are prominent players in the Digital Assistants in Healthcare Industry?
Key companies in the market include Nuance Communications Inc, CSS Corporation Pvt Ltd, Medrespond LLC, Healthtap Inc, ADA Digital Health, Infermedica Sp z o o, Microsoft Corporation, eGain Corporation, Verint Systems Inc, True Image Interactive Inc, Babylon Healthcare Services Limited, Floatbot AI, Amazon com Inc, Sensely Inc, Kore AI Inc.
3. What are the main segments of the Digital Assistants in Healthcare Industry?
The market segments include Product, User Interface, Application, End User.
4. Can you provide details about the market size?
The market size is estimated to be USD 1.72 Million as of 2022.
5. What are some drivers contributing to market growth?
Growing Smartphone Users and Increasing Use of Healthcare Applications; Rising Prevalence of Chronic Disorders.
6. What are the notable trends driving market growth?
Smart Speakers to Witness Significant Growth.
7. Are there any restraints impacting market growth?
Lack of Structured Data in the Healthcare Industry; Concerns Regarding Data Privacy.
8. Can you provide examples of recent developments in the market?
February 2023: Ada Health and Pfizer collaborated and announced the launch of their first digital condition-based care journey, designed to help people understand if they meet current criteria for progression to severe COVID-19 and connect with a health care provider for evaluation of their COVID-19 symptoms and treatment options.
9. What pricing options are available for accessing the report?
Pricing options include single-user, multi-user, and enterprise licenses priced at USD 4750, USD 5250, and USD 8750 respectively.
10. Is the market size provided in terms of value or volume?
The market size is provided in terms of value, measured in Million and volume, measured in K Unit.
11. Are there any specific market keywords associated with the report?
Yes, the market keyword associated with the report is "Digital Assistants in Healthcare Industry," which aids in identifying and referencing the specific market segment covered.
12. How do I determine which pricing option suits my needs best?
The pricing options vary based on user requirements and access needs. Individual users may opt for single-user licenses, while businesses requiring broader access may choose multi-user or enterprise licenses for cost-effective access to the report.
13. Are there any additional resources or data provided in the Digital Assistants in Healthcare Industry report?
While the report offers comprehensive insights, it's advisable to review the specific contents or supplementary materials provided to ascertain if additional resources or data are available.
14. How can I stay updated on further developments or reports in the Digital Assistants in Healthcare Industry?
To stay informed about further developments, trends, and reports in the Digital Assistants in Healthcare Industry, consider subscribing to industry newsletters, following relevant companies and organizations, or regularly checking reputable industry news sources and publications.
Methodology
Step 1 - Identification of Relevant Samples Size from Population Database


Step 2 - Approaches for Defining Global Market Size (Value, Volume* & Price*)

Note*: In applicable scenarios
Step 3 - Data Sources
Primary Research
- Web Analytics
- Survey Reports
- Research Institute
- Latest Research Reports
- Opinion Leaders
Secondary Research
- Annual Reports
- White Paper
- Latest Press Release
- Industry Association
- Paid Database
- Investor Presentations

Step 4 - Data Triangulation
Involves using different sources of information in order to increase the validity of a study
These sources are likely to be stakeholders in a program - participants, other researchers, program staff, other community members, and so on.
Then we put all data in single framework & apply various statistical tools to find out the dynamic on the market.
During the analysis stage, feedback from the stakeholder groups would be compared to determine areas of agreement as well as areas of divergence
