

Key Insights
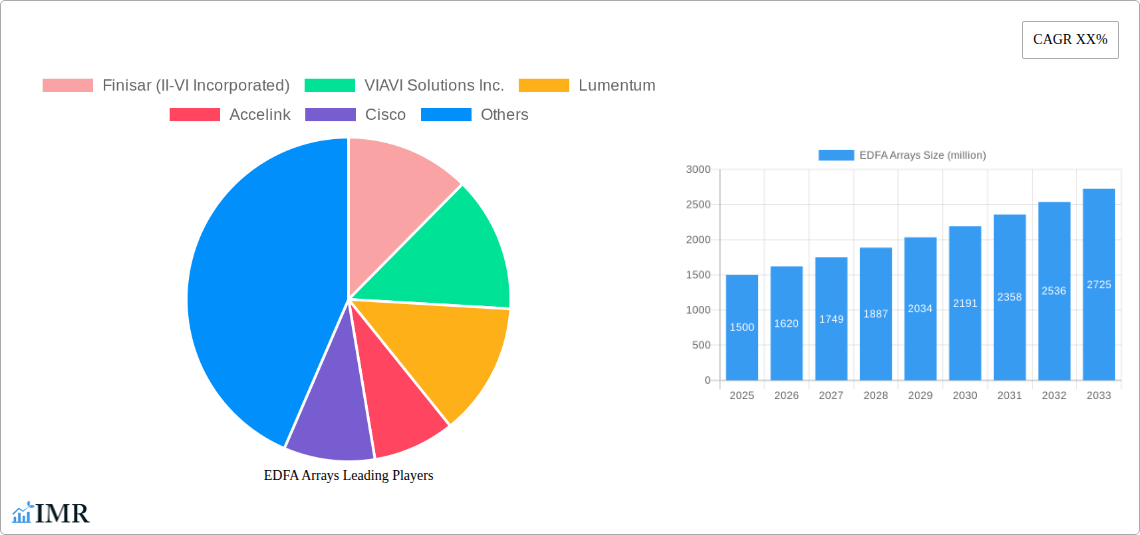
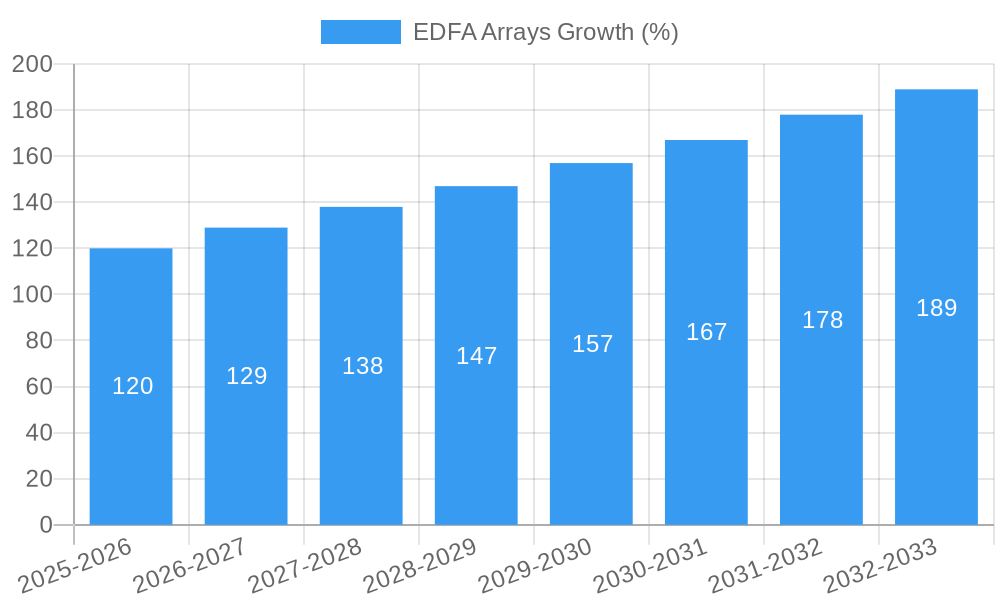
The EDFA (Erbium-doped fiber amplifier) array market is experiencing robust growth, driven by the expanding need for high-bandwidth, long-haul optical communication networks. The increasing demand for high-speed internet access, cloud computing services, and 5G infrastructure is fueling this expansion. Technological advancements, such as the development of more efficient and compact EDFA arrays with improved performance characteristics, are further contributing to market expansion. Key players like Finisar (II-VI Incorporated), VIAVI Solutions, and Lumentum are at the forefront of innovation, constantly striving to enhance amplifier capabilities and reduce costs. The market segmentation likely includes variations based on wavelength, power output, and application (e.g., long-haul transmission, metro networks, data centers). We anticipate a moderate CAGR of 8% for the period 2025-2033, considering the sustained growth in the telecommunications sector and ongoing technological improvements. This translates to a significant increase in market value over the forecast period.
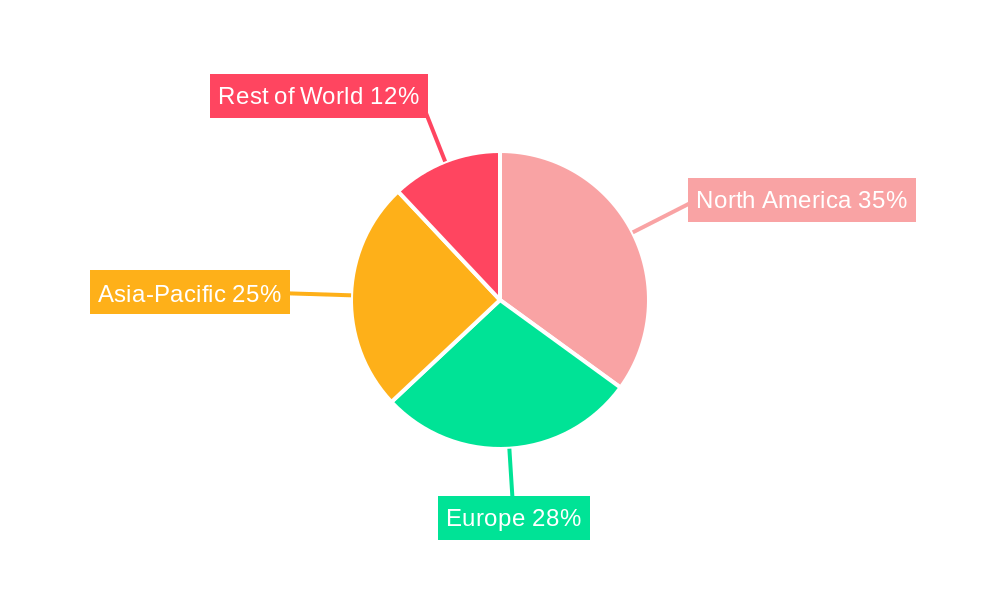
Geographical distribution is likely to be skewed towards regions with advanced telecommunications infrastructure and high internet penetration rates. North America and Europe are expected to maintain significant market share due to early adoption of advanced technologies and the presence of major players. However, the Asia-Pacific region is projected to witness substantial growth, driven by increasing investment in infrastructure development and the expanding digital economy across countries like China and India. While competitive intensity among established players remains high, the market also presents opportunities for niche players specializing in specific applications or technologies. Challenges include managing the complexity of deploying and maintaining large-scale EDFA array systems and adapting to evolving industry standards. However, the long-term outlook for the EDFA array market remains positive, driven by the relentless growth in global data traffic and the continuous demand for improved network capabilities.
EDFA Arrays Market Report: 2019-2033
This comprehensive report provides an in-depth analysis of the EDFA Arrays market, offering invaluable insights for industry professionals, investors, and strategic decision-makers. Covering the period from 2019 to 2033, with a focus on 2025, this report meticulously examines market dynamics, growth trends, regional landscapes, and key players, providing a 360° view of this dynamic sector within the broader optical communication and telecommunications markets (parent market).
EDFA Arrays Market Dynamics & Structure
The EDFA Arrays market, valued at xx million units in 2025, is characterized by moderate concentration, with key players holding significant market share. Technological innovation, primarily driven by advancements in erbium-doped fiber and integrated photonics, is a key driver. Regulatory frameworks, particularly concerning spectrum allocation and network infrastructure development, significantly influence market growth. Competitive substitutes, such as other optical amplification technologies, pose a challenge, while the increasing demand for high-bandwidth communication networks fuels market expansion. The market witnessed xx M&A deals in the historical period (2019-2024), indicating consolidation and strategic partnerships.
- Market Concentration: Moderately concentrated, with top 5 players holding xx% market share in 2025.
- Technological Innovation: Advancements in erbium-doped fiber and integrated photonics are key drivers.
- Regulatory Framework: Spectrum allocation policies and network infrastructure development influence market growth.
- Competitive Substitutes: Other optical amplification technologies pose a competitive threat.
- End-User Demographics: Primarily driven by telecommunication operators, data centers, and research institutions.
- M&A Trends: xx M&A deals observed between 2019-2024, indicating market consolidation.
EDFA Arrays Growth Trends & Insights
The EDFA Arrays market experienced robust growth during the historical period (2019-2024), exhibiting a CAGR of xx%. This growth is primarily attributed to the increasing demand for high-bandwidth data transmission, fueled by the proliferation of cloud computing, 5G networks, and the rise of data-intensive applications. Technological disruptions, including the development of more efficient and cost-effective EDFA arrays, further accelerated market expansion. Consumer behavior shifts towards higher data consumption rates and an increased reliance on digital services have also significantly contributed to market growth. The market is projected to reach xx million units by 2033, maintaining a CAGR of xx% during the forecast period (2025-2033). Market penetration is expected to increase from xx% in 2025 to xx% by 2033.
Dominant Regions, Countries, or Segments in EDFA Arrays
North America currently holds the largest market share in the EDFA Arrays market, driven by strong technological advancements, robust infrastructure, and significant investments in telecommunication networks. Asia-Pacific is expected to witness the fastest growth during the forecast period, fueled by rapid economic development, expanding digital infrastructure, and rising demand for high-speed internet access in emerging economies. Within segments, the high-power EDFA array segment is experiencing rapid growth due to its application in long-haul and submarine cable networks.
- North America: Strong technological advancements, robust infrastructure, high investments.
- Asia-Pacific: Fastest growth, fueled by economic development, expanding digital infrastructure.
- Europe: Steady growth driven by increasing adoption of high-speed internet and digital services.
- High-Power Segment: Rapid growth driven by demand in long-haul and submarine cable networks.
EDFA Arrays Product Landscape
EDFA arrays are evolving rapidly, incorporating innovative designs to enhance performance and efficiency. These advancements include improvements in gain, noise figure, and power consumption, leading to more compact and reliable solutions. The market offers a range of products catering to different applications, from short-reach metropolitan networks to long-haul submarine cables. Key innovations focus on improving the overall system efficiency and reducing costs.
Key Drivers, Barriers & Challenges in EDFA Arrays
Key Drivers: The escalating demand for higher bandwidth capacity in telecommunications networks, driven by the growth of cloud computing, 5G, and data-centric applications, is a major driver. Technological advancements, such as the development of more efficient and cost-effective EDFA arrays, also contribute significantly. Government initiatives promoting digital infrastructure development further boost market growth.
Key Barriers & Challenges: Supply chain disruptions, especially concerning rare earth elements crucial for EDFA manufacturing, can impact production and costs. Stringent regulatory compliance requirements and the need for specialized expertise pose challenges to market entry. Intense competition from existing players and the emergence of alternative amplification technologies create competitive pressures. These factors may collectively impact market growth by xx% by 2030.
Emerging Opportunities in EDFA Arrays
The market presents significant opportunities in untapped markets, including emerging economies with rapidly expanding telecommunication infrastructure. Innovative applications in areas like sensor networks, optical fiber sensing, and space-based communication offer promising growth avenues. Evolving consumer preferences for high-speed internet access and seamless connectivity fuel the demand for advanced EDFA arrays.
Growth Accelerators in the EDFA Arrays Industry
Technological breakthroughs in integrated photonics, leading to smaller, more efficient EDFA arrays, will drive long-term growth. Strategic partnerships between EDFA manufacturers and telecommunication operators will accelerate market penetration. Expansion into new markets and applications, particularly in the emerging economies and specialized sectors, will further boost market growth.
Key Players Shaping the EDFA Arrays Market
- Finisar (II-VI Incorporated)
- VIAVI Solutions Inc.
- Lumentum
- Accelink
- Cisco
- IPG Photonics
- O-Net
- Keopsys
- Wuxi Taclink Optoelectronics Technology Co.,Ltd.
- Thorlabs
- Emcore
Notable Milestones in EDFA Arrays Sector
- 2021-Q3: Lumentum launched a new generation of high-power EDFA arrays with improved efficiency.
- 2022-Q1: II-VI Incorporated acquired a smaller EDFA manufacturer, expanding its market share.
- 2023-Q2: Significant advancements in integrated photonics technology were showcased at OFC. (Further specific examples to be added based on available data)
In-Depth EDFA Arrays Market Outlook
The EDFA Arrays market is poised for continued growth, driven by technological innovations, expanding network infrastructure, and increasing demand for high-bandwidth applications. Strategic partnerships and market expansion strategies will be crucial for capturing significant market share. The long-term outlook remains positive, with significant potential for growth in both developed and emerging markets.
EDFA Arrays Segmentation
-
1. Application
- 1.1. ROADM System
- 1.2. Parallel Telecommunications
- 1.3. Other
-
2. Types
- 2.1. 2 x EDFA
- 2.2. 4 x EDFA
- 2.3. 8 x EDFA
- 2.4. 12 x EDFA
- 2.5. 16 x EDFA
EDFA Arrays Segmentation By Geography
-
1. North America
- 1.1. United States
- 1.2. Canada
- 1.3. Mexico
-
2. South America
- 2.1. Brazil
- 2.2. Argentina
- 2.3. Rest of South America
-
3. Europe
- 3.1. United Kingdom
- 3.2. Germany
- 3.3. France
- 3.4. Italy
- 3.5. Spain
- 3.6. Russia
- 3.7. Benelux
- 3.8. Nordics
- 3.9. Rest of Europe
-
4. Middle East & Africa
- 4.1. Turkey
- 4.2. Israel
- 4.3. GCC
- 4.4. North Africa
- 4.5. South Africa
- 4.6. Rest of Middle East & Africa
-
5. Asia Pacific
- 5.1. China
- 5.2. India
- 5.3. Japan
- 5.4. South Korea
- 5.5. ASEAN
- 5.6. Oceania
- 5.7. Rest of Asia Pacific
EDFA Arrays REPORT HIGHLIGHTS
| Aspects | Details |
|---|---|
| Study Period | 2019-2033 |
| Base Year | 2024 |
| Estimated Year | 2025 |
| Forecast Period | 2025-2033 |
| Historical Period | 2019-2024 |
| Growth Rate | CAGR of XX% from 2019-2033 |
| Segmentation |
|
Table of Contents
- 1. Introduction
- 1.1. Research Scope
- 1.2. Market Segmentation
- 1.3. Research Methodology
- 1.4. Definitions and Assumptions
- 2. Executive Summary
- 2.1. Introduction
- 3. Market Dynamics
- 3.1. Introduction
- 3.2. Market Drivers
- 3.3. Market Restrains
- 3.4. Market Trends
- 4. Market Factor Analysis
- 4.1. Porters Five Forces
- 4.2. Supply/Value Chain
- 4.3. PESTEL analysis
- 4.4. Market Entropy
- 4.5. Patent/Trademark Analysis
- 5. Global EDFA Arrays Analysis, Insights and Forecast, 2019-2031
- 5.1. Market Analysis, Insights and Forecast - by Application
- 5.1.1. ROADM System
- 5.1.2. Parallel Telecommunications
- 5.1.3. Other
- 5.2. Market Analysis, Insights and Forecast - by Types
- 5.2.1. 2 x EDFA
- 5.2.2. 4 x EDFA
- 5.2.3. 8 x EDFA
- 5.2.4. 12 x EDFA
- 5.2.5. 16 x EDFA
- 5.3. Market Analysis, Insights and Forecast - by Region
- 5.3.1. North America
- 5.3.2. South America
- 5.3.3. Europe
- 5.3.4. Middle East & Africa
- 5.3.5. Asia Pacific
- 5.1. Market Analysis, Insights and Forecast - by Application
- 6. North America EDFA Arrays Analysis, Insights and Forecast, 2019-2031
- 6.1. Market Analysis, Insights and Forecast - by Application
- 6.1.1. ROADM System
- 6.1.2. Parallel Telecommunications
- 6.1.3. Other
- 6.2. Market Analysis, Insights and Forecast - by Types
- 6.2.1. 2 x EDFA
- 6.2.2. 4 x EDFA
- 6.2.3. 8 x EDFA
- 6.2.4. 12 x EDFA
- 6.2.5. 16 x EDFA
- 6.1. Market Analysis, Insights and Forecast - by Application
- 7. South America EDFA Arrays Analysis, Insights and Forecast, 2019-2031
- 7.1. Market Analysis, Insights and Forecast - by Application
- 7.1.1. ROADM System
- 7.1.2. Parallel Telecommunications
- 7.1.3. Other
- 7.2. Market Analysis, Insights and Forecast - by Types
- 7.2.1. 2 x EDFA
- 7.2.2. 4 x EDFA
- 7.2.3. 8 x EDFA
- 7.2.4. 12 x EDFA
- 7.2.5. 16 x EDFA
- 7.1. Market Analysis, Insights and Forecast - by Application
- 8. Europe EDFA Arrays Analysis, Insights and Forecast, 2019-2031
- 8.1. Market Analysis, Insights and Forecast - by Application
- 8.1.1. ROADM System
- 8.1.2. Parallel Telecommunications
- 8.1.3. Other
- 8.2. Market Analysis, Insights and Forecast - by Types
- 8.2.1. 2 x EDFA
- 8.2.2. 4 x EDFA
- 8.2.3. 8 x EDFA
- 8.2.4. 12 x EDFA
- 8.2.5. 16 x EDFA
- 8.1. Market Analysis, Insights and Forecast - by Application
- 9. Middle East & Africa EDFA Arrays Analysis, Insights and Forecast, 2019-2031
- 9.1. Market Analysis, Insights and Forecast - by Application
- 9.1.1. ROADM System
- 9.1.2. Parallel Telecommunications
- 9.1.3. Other
- 9.2. Market Analysis, Insights and Forecast - by Types
- 9.2.1. 2 x EDFA
- 9.2.2. 4 x EDFA
- 9.2.3. 8 x EDFA
- 9.2.4. 12 x EDFA
- 9.2.5. 16 x EDFA
- 9.1. Market Analysis, Insights and Forecast - by Application
- 10. Asia Pacific EDFA Arrays Analysis, Insights and Forecast, 2019-2031
- 10.1. Market Analysis, Insights and Forecast - by Application
- 10.1.1. ROADM System
- 10.1.2. Parallel Telecommunications
- 10.1.3. Other
- 10.2. Market Analysis, Insights and Forecast - by Types
- 10.2.1. 2 x EDFA
- 10.2.2. 4 x EDFA
- 10.2.3. 8 x EDFA
- 10.2.4. 12 x EDFA
- 10.2.5. 16 x EDFA
- 10.1. Market Analysis, Insights and Forecast - by Application
- 11. Competitive Analysis
- 11.1. Global Market Share Analysis 2024
- 11.2. Company Profiles
- 11.2.1 Finisar (II-VI Incorporated)
- 11.2.1.1. Overview
- 11.2.1.2. Products
- 11.2.1.3. SWOT Analysis
- 11.2.1.4. Recent Developments
- 11.2.1.5. Financials (Based on Availability)
- 11.2.2 VIAVI Solutions Inc.
- 11.2.2.1. Overview
- 11.2.2.2. Products
- 11.2.2.3. SWOT Analysis
- 11.2.2.4. Recent Developments
- 11.2.2.5. Financials (Based on Availability)
- 11.2.3 Lumentum
- 11.2.3.1. Overview
- 11.2.3.2. Products
- 11.2.3.3. SWOT Analysis
- 11.2.3.4. Recent Developments
- 11.2.3.5. Financials (Based on Availability)
- 11.2.4 Accelink
- 11.2.4.1. Overview
- 11.2.4.2. Products
- 11.2.4.3. SWOT Analysis
- 11.2.4.4. Recent Developments
- 11.2.4.5. Financials (Based on Availability)
- 11.2.5 Cisco
- 11.2.5.1. Overview
- 11.2.5.2. Products
- 11.2.5.3. SWOT Analysis
- 11.2.5.4. Recent Developments
- 11.2.5.5. Financials (Based on Availability)
- 11.2.6 IPG Photonics
- 11.2.6.1. Overview
- 11.2.6.2. Products
- 11.2.6.3. SWOT Analysis
- 11.2.6.4. Recent Developments
- 11.2.6.5. Financials (Based on Availability)
- 11.2.7 O-Net
- 11.2.7.1. Overview
- 11.2.7.2. Products
- 11.2.7.3. SWOT Analysis
- 11.2.7.4. Recent Developments
- 11.2.7.5. Financials (Based on Availability)
- 11.2.8 Keopsys
- 11.2.8.1. Overview
- 11.2.8.2. Products
- 11.2.8.3. SWOT Analysis
- 11.2.8.4. Recent Developments
- 11.2.8.5. Financials (Based on Availability)
- 11.2.9 Wuxi Taclink Optoelectronics Technology Co.
- 11.2.9.1. Overview
- 11.2.9.2. Products
- 11.2.9.3. SWOT Analysis
- 11.2.9.4. Recent Developments
- 11.2.9.5. Financials (Based on Availability)
- 11.2.10 Ltd.
- 11.2.10.1. Overview
- 11.2.10.2. Products
- 11.2.10.3. SWOT Analysis
- 11.2.10.4. Recent Developments
- 11.2.10.5. Financials (Based on Availability)
- 11.2.11 Thorlabs
- 11.2.11.1. Overview
- 11.2.11.2. Products
- 11.2.11.3. SWOT Analysis
- 11.2.11.4. Recent Developments
- 11.2.11.5. Financials (Based on Availability)
- 11.2.12 Emcore
- 11.2.12.1. Overview
- 11.2.12.2. Products
- 11.2.12.3. SWOT Analysis
- 11.2.12.4. Recent Developments
- 11.2.12.5. Financials (Based on Availability)
- 11.2.1 Finisar (II-VI Incorporated)
List of Figures
- Figure 1: Global EDFA Arrays Revenue Breakdown (million, %) by Region 2024 & 2032
- Figure 2: North America EDFA Arrays Revenue (million), by Application 2024 & 2032
- Figure 3: North America EDFA Arrays Revenue Share (%), by Application 2024 & 2032
- Figure 4: North America EDFA Arrays Revenue (million), by Types 2024 & 2032
- Figure 5: North America EDFA Arrays Revenue Share (%), by Types 2024 & 2032
- Figure 6: North America EDFA Arrays Revenue (million), by Country 2024 & 2032
- Figure 7: North America EDFA Arrays Revenue Share (%), by Country 2024 & 2032
- Figure 8: South America EDFA Arrays Revenue (million), by Application 2024 & 2032
- Figure 9: South America EDFA Arrays Revenue Share (%), by Application 2024 & 2032
- Figure 10: South America EDFA Arrays Revenue (million), by Types 2024 & 2032
- Figure 11: South America EDFA Arrays Revenue Share (%), by Types 2024 & 2032
- Figure 12: South America EDFA Arrays Revenue (million), by Country 2024 & 2032
- Figure 13: South America EDFA Arrays Revenue Share (%), by Country 2024 & 2032
- Figure 14: Europe EDFA Arrays Revenue (million), by Application 2024 & 2032
- Figure 15: Europe EDFA Arrays Revenue Share (%), by Application 2024 & 2032
- Figure 16: Europe EDFA Arrays Revenue (million), by Types 2024 & 2032
- Figure 17: Europe EDFA Arrays Revenue Share (%), by Types 2024 & 2032
- Figure 18: Europe EDFA Arrays Revenue (million), by Country 2024 & 2032
- Figure 19: Europe EDFA Arrays Revenue Share (%), by Country 2024 & 2032
- Figure 20: Middle East & Africa EDFA Arrays Revenue (million), by Application 2024 & 2032
- Figure 21: Middle East & Africa EDFA Arrays Revenue Share (%), by Application 2024 & 2032
- Figure 22: Middle East & Africa EDFA Arrays Revenue (million), by Types 2024 & 2032
- Figure 23: Middle East & Africa EDFA Arrays Revenue Share (%), by Types 2024 & 2032
- Figure 24: Middle East & Africa EDFA Arrays Revenue (million), by Country 2024 & 2032
- Figure 25: Middle East & Africa EDFA Arrays Revenue Share (%), by Country 2024 & 2032
- Figure 26: Asia Pacific EDFA Arrays Revenue (million), by Application 2024 & 2032
- Figure 27: Asia Pacific EDFA Arrays Revenue Share (%), by Application 2024 & 2032
- Figure 28: Asia Pacific EDFA Arrays Revenue (million), by Types 2024 & 2032
- Figure 29: Asia Pacific EDFA Arrays Revenue Share (%), by Types 2024 & 2032
- Figure 30: Asia Pacific EDFA Arrays Revenue (million), by Country 2024 & 2032
- Figure 31: Asia Pacific EDFA Arrays Revenue Share (%), by Country 2024 & 2032
List of Tables
- Table 1: Global EDFA Arrays Revenue million Forecast, by Region 2019 & 2032
- Table 2: Global EDFA Arrays Revenue million Forecast, by Application 2019 & 2032
- Table 3: Global EDFA Arrays Revenue million Forecast, by Types 2019 & 2032
- Table 4: Global EDFA Arrays Revenue million Forecast, by Region 2019 & 2032
- Table 5: Global EDFA Arrays Revenue million Forecast, by Application 2019 & 2032
- Table 6: Global EDFA Arrays Revenue million Forecast, by Types 2019 & 2032
- Table 7: Global EDFA Arrays Revenue million Forecast, by Country 2019 & 2032
- Table 8: United States EDFA Arrays Revenue (million) Forecast, by Application 2019 & 2032
- Table 9: Canada EDFA Arrays Revenue (million) Forecast, by Application 2019 & 2032
- Table 10: Mexico EDFA Arrays Revenue (million) Forecast, by Application 2019 & 2032
- Table 11: Global EDFA Arrays Revenue million Forecast, by Application 2019 & 2032
- Table 12: Global EDFA Arrays Revenue million Forecast, by Types 2019 & 2032
- Table 13: Global EDFA Arrays Revenue million Forecast, by Country 2019 & 2032
- Table 14: Brazil EDFA Arrays Revenue (million) Forecast, by Application 2019 & 2032
- Table 15: Argentina EDFA Arrays Revenue (million) Forecast, by Application 2019 & 2032
- Table 16: Rest of South America EDFA Arrays Revenue (million) Forecast, by Application 2019 & 2032
- Table 17: Global EDFA Arrays Revenue million Forecast, by Application 2019 & 2032
- Table 18: Global EDFA Arrays Revenue million Forecast, by Types 2019 & 2032
- Table 19: Global EDFA Arrays Revenue million Forecast, by Country 2019 & 2032
- Table 20: United Kingdom EDFA Arrays Revenue (million) Forecast, by Application 2019 & 2032
- Table 21: Germany EDFA Arrays Revenue (million) Forecast, by Application 2019 & 2032
- Table 22: France EDFA Arrays Revenue (million) Forecast, by Application 2019 & 2032
- Table 23: Italy EDFA Arrays Revenue (million) Forecast, by Application 2019 & 2032
- Table 24: Spain EDFA Arrays Revenue (million) Forecast, by Application 2019 & 2032
- Table 25: Russia EDFA Arrays Revenue (million) Forecast, by Application 2019 & 2032
- Table 26: Benelux EDFA Arrays Revenue (million) Forecast, by Application 2019 & 2032
- Table 27: Nordics EDFA Arrays Revenue (million) Forecast, by Application 2019 & 2032
- Table 28: Rest of Europe EDFA Arrays Revenue (million) Forecast, by Application 2019 & 2032
- Table 29: Global EDFA Arrays Revenue million Forecast, by Application 2019 & 2032
- Table 30: Global EDFA Arrays Revenue million Forecast, by Types 2019 & 2032
- Table 31: Global EDFA Arrays Revenue million Forecast, by Country 2019 & 2032
- Table 32: Turkey EDFA Arrays Revenue (million) Forecast, by Application 2019 & 2032
- Table 33: Israel EDFA Arrays Revenue (million) Forecast, by Application 2019 & 2032
- Table 34: GCC EDFA Arrays Revenue (million) Forecast, by Application 2019 & 2032
- Table 35: North Africa EDFA Arrays Revenue (million) Forecast, by Application 2019 & 2032
- Table 36: South Africa EDFA Arrays Revenue (million) Forecast, by Application 2019 & 2032
- Table 37: Rest of Middle East & Africa EDFA Arrays Revenue (million) Forecast, by Application 2019 & 2032
- Table 38: Global EDFA Arrays Revenue million Forecast, by Application 2019 & 2032
- Table 39: Global EDFA Arrays Revenue million Forecast, by Types 2019 & 2032
- Table 40: Global EDFA Arrays Revenue million Forecast, by Country 2019 & 2032
- Table 41: China EDFA Arrays Revenue (million) Forecast, by Application 2019 & 2032
- Table 42: India EDFA Arrays Revenue (million) Forecast, by Application 2019 & 2032
- Table 43: Japan EDFA Arrays Revenue (million) Forecast, by Application 2019 & 2032
- Table 44: South Korea EDFA Arrays Revenue (million) Forecast, by Application 2019 & 2032
- Table 45: ASEAN EDFA Arrays Revenue (million) Forecast, by Application 2019 & 2032
- Table 46: Oceania EDFA Arrays Revenue (million) Forecast, by Application 2019 & 2032
- Table 47: Rest of Asia Pacific EDFA Arrays Revenue (million) Forecast, by Application 2019 & 2032
Frequently Asked Questions
1. What is the projected Compound Annual Growth Rate (CAGR) of the EDFA Arrays?
The projected CAGR is approximately XX%.
2. Which companies are prominent players in the EDFA Arrays?
Key companies in the market include Finisar (II-VI Incorporated), VIAVI Solutions Inc., Lumentum, Accelink, Cisco, IPG Photonics, O-Net, Keopsys, Wuxi Taclink Optoelectronics Technology Co., Ltd., Thorlabs, Emcore.
3. What are the main segments of the EDFA Arrays?
The market segments include Application, Types.
4. Can you provide details about the market size?
The market size is estimated to be USD XXX million as of 2022.
5. What are some drivers contributing to market growth?
N/A
6. What are the notable trends driving market growth?
N/A
7. Are there any restraints impacting market growth?
N/A
8. Can you provide examples of recent developments in the market?
N/A
9. What pricing options are available for accessing the report?
Pricing options include single-user, multi-user, and enterprise licenses priced at USD 4900.00, USD 7350.00, and USD 9800.00 respectively.
10. Is the market size provided in terms of value or volume?
The market size is provided in terms of value, measured in million.
11. Are there any specific market keywords associated with the report?
Yes, the market keyword associated with the report is "EDFA Arrays," which aids in identifying and referencing the specific market segment covered.
12. How do I determine which pricing option suits my needs best?
The pricing options vary based on user requirements and access needs. Individual users may opt for single-user licenses, while businesses requiring broader access may choose multi-user or enterprise licenses for cost-effective access to the report.
13. Are there any additional resources or data provided in the EDFA Arrays report?
While the report offers comprehensive insights, it's advisable to review the specific contents or supplementary materials provided to ascertain if additional resources or data are available.
14. How can I stay updated on further developments or reports in the EDFA Arrays?
To stay informed about further developments, trends, and reports in the EDFA Arrays, consider subscribing to industry newsletters, following relevant companies and organizations, or regularly checking reputable industry news sources and publications.
Methodology
Step 1 - Identification of Relevant Samples Size from Population Database


Step 2 - Approaches for Defining Global Market Size (Value, Volume* & Price*)

Note*: In applicable scenarios
Step 3 - Data Sources
Primary Research
- Web Analytics
- Survey Reports
- Research Institute
- Latest Research Reports
- Opinion Leaders
Secondary Research
- Annual Reports
- White Paper
- Latest Press Release
- Industry Association
- Paid Database
- Investor Presentations

Step 4 - Data Triangulation
Involves using different sources of information in order to increase the validity of a study
These sources are likely to be stakeholders in a program - participants, other researchers, program staff, other community members, and so on.
Then we put all data in single framework & apply various statistical tools to find out the dynamic on the market.
During the analysis stage, feedback from the stakeholder groups would be compared to determine areas of agreement as well as areas of divergence
