

Key Insights
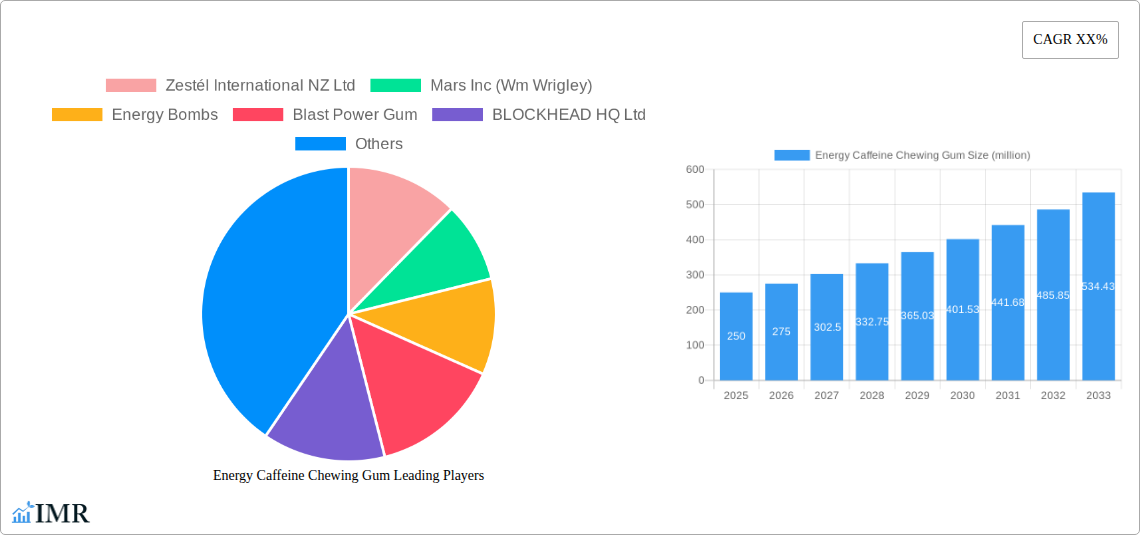
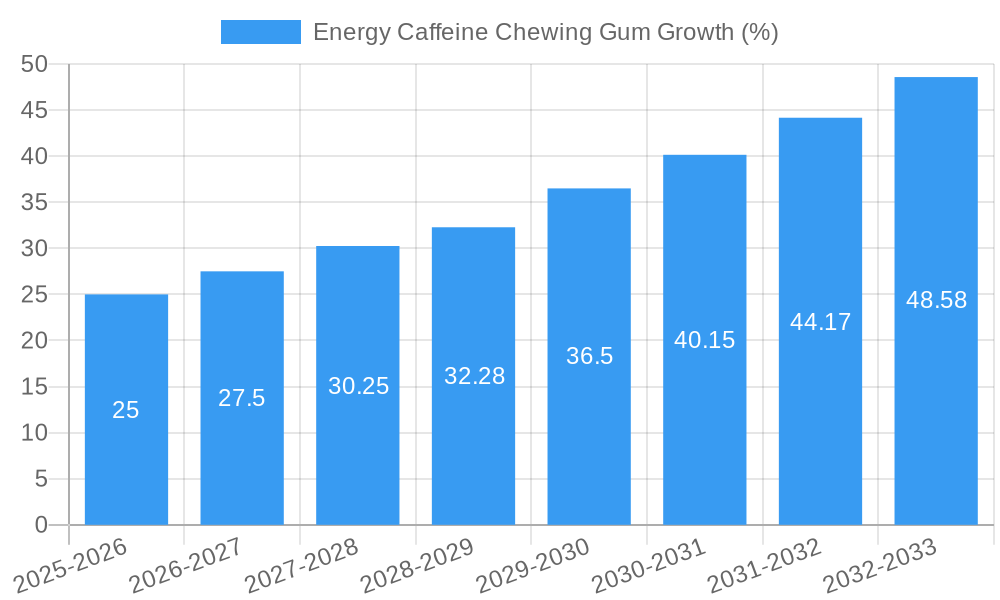
The global energy caffeine chewing gum market is experiencing robust growth, driven by increasing consumer demand for convenient and effective energy boosts. The market's expansion is fueled by several key factors, including the rising prevalence of busy lifestyles, the growing popularity of functional foods and beverages, and a preference for alternatives to traditional energy drinks and coffee. The convenience and portability of chewing gum make it an attractive option for on-the-go energy consumption, particularly among young adults and professionals. This segment is witnessing innovation in flavor profiles and the incorporation of additional functional ingredients beyond caffeine, such as vitamins and herbal extracts, to cater to diverse consumer preferences and health goals. While the market faces challenges such as concerns about the potential negative health impacts of high caffeine consumption and the presence of sugar in many products, the ongoing development of sugar-free and low-sugar options is mitigating these concerns. Major players in the confectionery industry are actively investing in research and development to enhance product formulations and expand their market presence. This competitive landscape fosters innovation and drives market growth. We estimate the market size in 2025 to be approximately $250 million, with a Compound Annual Growth Rate (CAGR) of 10% projected from 2025 to 2033, resulting in a market size exceeding $650 million by 2033. This projection considers factors like rising consumer disposable incomes, growing awareness of functional foods, and continued product innovation.
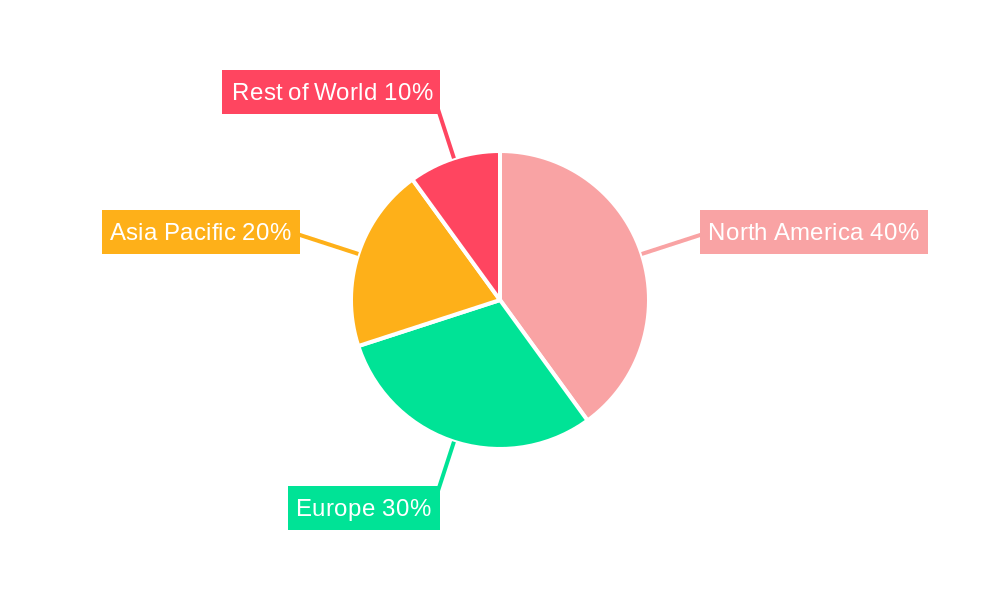
The market is segmented by type (sugar-free, regular), distribution channel (online, offline), and region. North America and Europe currently hold significant market shares due to higher consumer awareness and higher adoption rates of functional foods. However, Asia Pacific is expected to witness substantial growth in the coming years, fueled by rapid economic development and changing lifestyle patterns. Key players such as Zestél International NZ Ltd, Mars Inc (Wm Wrigley), and Mondelez International, Inc (Cadbury Trebor Bassett) are leveraging their established distribution networks and brand recognition to maintain their market positions and capture new customer segments. Smaller companies like Energy Bombs and NeuroGum are focusing on innovation and niche markets to carve a space for themselves in the competitive landscape. Regulatory changes concerning caffeine content and labeling are expected to influence the market dynamics in the years to come, further highlighting the need for ongoing product development and market adaptation.
Energy Caffeine Chewing Gum Market Report: 2019-2033
This comprehensive report provides a detailed analysis of the global energy caffeine chewing gum market, offering invaluable insights for industry professionals, investors, and strategic decision-makers. The study period covers 2019-2033, with a base year of 2025 and a forecast period of 2025-2033. The report leverages extensive data analysis to provide a clear understanding of market dynamics, growth trends, and future opportunities within this rapidly evolving sector. The parent market is the confectionery market, while the child market is the functional food and beverage segment.
Energy Caffeine Chewing Gum Market Dynamics & Structure
The global energy caffeine chewing gum market is characterized by moderate concentration, with key players vying for market share. Technological innovation, particularly in flavor profiles and caffeine delivery systems, is a significant driver. Regulatory frameworks concerning caffeine content and labeling vary across regions, impacting market dynamics. Competitive substitutes include energy drinks, coffee, and other functional foods. The end-user demographic primarily comprises young adults and professionals seeking a convenient energy boost. M&A activity has been relatively low in recent years, with xx million USD worth of deals recorded between 2019 and 2024.
- Market Concentration: Moderately concentrated, with top 5 players holding approximately 60% market share in 2024.
- Technological Innovation: Focus on improved caffeine delivery, natural ingredients, and novel flavor combinations.
- Regulatory Landscape: Varying regulations on caffeine content and labeling across geographies pose challenges.
- Competitive Substitutes: Energy drinks, coffee, and other functional food and beverage options present competition.
- End-User Demographics: Primarily young adults (18-35) and professionals seeking convenient energy solutions.
- M&A Activity: xx million USD in deals between 2019-2024, indicating potential for future consolidation.
Energy Caffeine Chewing Gum Growth Trends & Insights
The global energy caffeine chewing gum market experienced robust growth during the historical period (2019-2024), with a CAGR of xx%. This growth is primarily attributed to increasing consumer demand for convenient energy solutions and the rising popularity of functional foods and beverages. Technological disruptions, such as the development of sustained-release caffeine formulations, have further fueled market expansion. Shifts in consumer behavior towards healthier, more natural products have also influenced market dynamics. Market penetration remains relatively low, indicating significant untapped potential. The estimated market size in 2025 is xx million units, projected to reach xx million units by 2033.
Dominant Regions, Countries, or Segments in Energy Caffeine Chewing Gum
North America currently dominates the energy caffeine chewing gum market, driven by high consumer spending power, established distribution networks, and a strong preference for convenient energy solutions. The region's high adoption rates and established infrastructure contribute to its market leadership. Europe and Asia-Pacific are also exhibiting strong growth potential, driven by rising disposable incomes and increasing awareness of functional foods.
- Key Drivers in North America: High consumer spending, established distribution channels, and strong awareness of functional foods.
- Growth Potential in Asia-Pacific: Rising disposable incomes, growing awareness of health and wellness, and increasing demand for convenient energy options.
- European Market Dynamics: Growing adoption of functional foods and a focus on natural and healthier alternatives.
- Market Share: North America holds approximately 45% of the global market share in 2025.
Energy Caffeine Chewing Gum Product Landscape
The energy caffeine chewing gum market showcases a diverse range of products, from traditional formulations to innovative offerings with enhanced caffeine delivery systems and natural ingredients. Manufacturers are focusing on improved flavor profiles, longer-lasting energy effects, and convenient packaging to attract consumers. Unique selling propositions often emphasize natural ingredients, sustainable sourcing, and enhanced taste experiences. Technological advancements in caffeine encapsulation and flavor technology are driving product innovation.
Key Drivers, Barriers & Challenges in Energy Caffeine Chewing Gum
Key Drivers:
- Growing demand for convenient energy solutions.
- Increasing awareness of functional foods and beverages.
- Technological advancements in caffeine delivery and flavor enhancement.
- Rising disposable incomes in emerging markets.
Key Challenges:
- Concerns regarding high caffeine consumption and potential health risks.
- Stringent regulatory requirements regarding caffeine content and labeling.
- Competition from other convenient energy sources (energy drinks, coffee).
- Supply chain disruptions impacting raw material availability and cost. This has resulted in a xx% increase in production costs in 2024.
Emerging Opportunities in Energy Caffeine Chewing Gum
- Expansion into untapped markets in developing economies.
- Development of sugar-free and low-calorie options.
- Innovation in natural caffeine sources and sustainable sourcing practices.
- Incorporation of additional functional ingredients (e.g., vitamins, nootropics).
Growth Accelerators in the Energy Caffeine Chewing Gum Industry
Strategic partnerships between chewing gum manufacturers and health supplement companies are expected to drive market growth. Technological breakthroughs in sustained-release caffeine technology will enhance product efficacy and appeal. Expansion into new geographical markets and diversification of product offerings will further fuel market expansion.
Key Players Shaping the Energy Caffeine Chewing Gum Market
- Zestél International NZ Ltd
- Mars Inc (Wm Wrigley)
- Energy Bombs
- Blast Power Gum
- BLOCKHEAD HQ Ltd
- NeuroGum, LLC
- GelStat Corporation (Mastix LLC)
- Mondelez International,Inc (Cadbury Trebor Bassett)
- LOTTE Corp
Notable Milestones in Energy Caffeine Chewing Gum Sector
- 2020: NeuroGum, LLC launched a new line of nootropic-infused chewing gum.
- 2022: Mars Inc (Wm Wrigley) introduced a sustained-release caffeine chewing gum.
- 2023: A significant increase in investment in research and development of natural caffeine sources was observed.
In-Depth Energy Caffeine Chewing Gum Market Outlook
The future of the energy caffeine chewing gum market is promising, with continued growth driven by technological innovation, expanding consumer demand, and strategic market expansions. The market is poised for significant growth, presenting lucrative opportunities for established players and new entrants alike. Strategic partnerships and focused product development will be crucial for success in this dynamic market.
Energy Caffeine Chewing Gum Segmentation
-
1. Application
- 1.1. Online Sales
- 1.2. Offline Sales
-
2. Types
- 2.1. Fruity
- 2.2. Mint
- 2.3. Others
Energy Caffeine Chewing Gum Segmentation By Geography
-
1. North America
- 1.1. United States
- 1.2. Canada
- 1.3. Mexico
-
2. South America
- 2.1. Brazil
- 2.2. Argentina
- 2.3. Rest of South America
-
3. Europe
- 3.1. United Kingdom
- 3.2. Germany
- 3.3. France
- 3.4. Italy
- 3.5. Spain
- 3.6. Russia
- 3.7. Benelux
- 3.8. Nordics
- 3.9. Rest of Europe
-
4. Middle East & Africa
- 4.1. Turkey
- 4.2. Israel
- 4.3. GCC
- 4.4. North Africa
- 4.5. South Africa
- 4.6. Rest of Middle East & Africa
-
5. Asia Pacific
- 5.1. China
- 5.2. India
- 5.3. Japan
- 5.4. South Korea
- 5.5. ASEAN
- 5.6. Oceania
- 5.7. Rest of Asia Pacific
Energy Caffeine Chewing Gum REPORT HIGHLIGHTS
| Aspects | Details |
|---|---|
| Study Period | 2019-2033 |
| Base Year | 2024 |
| Estimated Year | 2025 |
| Forecast Period | 2025-2033 |
| Historical Period | 2019-2024 |
| Growth Rate | CAGR of XX% from 2019-2033 |
| Segmentation |
|
Table of Contents
- 1. Introduction
- 1.1. Research Scope
- 1.2. Market Segmentation
- 1.3. Research Methodology
- 1.4. Definitions and Assumptions
- 2. Executive Summary
- 2.1. Introduction
- 3. Market Dynamics
- 3.1. Introduction
- 3.2. Market Drivers
- 3.3. Market Restrains
- 3.4. Market Trends
- 4. Market Factor Analysis
- 4.1. Porters Five Forces
- 4.2. Supply/Value Chain
- 4.3. PESTEL analysis
- 4.4. Market Entropy
- 4.5. Patent/Trademark Analysis
- 5. Global Energy Caffeine Chewing Gum Analysis, Insights and Forecast, 2019-2031
- 5.1. Market Analysis, Insights and Forecast - by Application
- 5.1.1. Online Sales
- 5.1.2. Offline Sales
- 5.2. Market Analysis, Insights and Forecast - by Types
- 5.2.1. Fruity
- 5.2.2. Mint
- 5.2.3. Others
- 5.3. Market Analysis, Insights and Forecast - by Region
- 5.3.1. North America
- 5.3.2. South America
- 5.3.3. Europe
- 5.3.4. Middle East & Africa
- 5.3.5. Asia Pacific
- 5.1. Market Analysis, Insights and Forecast - by Application
- 6. North America Energy Caffeine Chewing Gum Analysis, Insights and Forecast, 2019-2031
- 6.1. Market Analysis, Insights and Forecast - by Application
- 6.1.1. Online Sales
- 6.1.2. Offline Sales
- 6.2. Market Analysis, Insights and Forecast - by Types
- 6.2.1. Fruity
- 6.2.2. Mint
- 6.2.3. Others
- 6.1. Market Analysis, Insights and Forecast - by Application
- 7. South America Energy Caffeine Chewing Gum Analysis, Insights and Forecast, 2019-2031
- 7.1. Market Analysis, Insights and Forecast - by Application
- 7.1.1. Online Sales
- 7.1.2. Offline Sales
- 7.2. Market Analysis, Insights and Forecast - by Types
- 7.2.1. Fruity
- 7.2.2. Mint
- 7.2.3. Others
- 7.1. Market Analysis, Insights and Forecast - by Application
- 8. Europe Energy Caffeine Chewing Gum Analysis, Insights and Forecast, 2019-2031
- 8.1. Market Analysis, Insights and Forecast - by Application
- 8.1.1. Online Sales
- 8.1.2. Offline Sales
- 8.2. Market Analysis, Insights and Forecast - by Types
- 8.2.1. Fruity
- 8.2.2. Mint
- 8.2.3. Others
- 8.1. Market Analysis, Insights and Forecast - by Application
- 9. Middle East & Africa Energy Caffeine Chewing Gum Analysis, Insights and Forecast, 2019-2031
- 9.1. Market Analysis, Insights and Forecast - by Application
- 9.1.1. Online Sales
- 9.1.2. Offline Sales
- 9.2. Market Analysis, Insights and Forecast - by Types
- 9.2.1. Fruity
- 9.2.2. Mint
- 9.2.3. Others
- 9.1. Market Analysis, Insights and Forecast - by Application
- 10. Asia Pacific Energy Caffeine Chewing Gum Analysis, Insights and Forecast, 2019-2031
- 10.1. Market Analysis, Insights and Forecast - by Application
- 10.1.1. Online Sales
- 10.1.2. Offline Sales
- 10.2. Market Analysis, Insights and Forecast - by Types
- 10.2.1. Fruity
- 10.2.2. Mint
- 10.2.3. Others
- 10.1. Market Analysis, Insights and Forecast - by Application
- 11. Competitive Analysis
- 11.1. Global Market Share Analysis 2024
- 11.2. Company Profiles
- 11.2.1 Zestél International NZ Ltd
- 11.2.1.1. Overview
- 11.2.1.2. Products
- 11.2.1.3. SWOT Analysis
- 11.2.1.4. Recent Developments
- 11.2.1.5. Financials (Based on Availability)
- 11.2.2 Mars Inc (Wm Wrigley)
- 11.2.2.1. Overview
- 11.2.2.2. Products
- 11.2.2.3. SWOT Analysis
- 11.2.2.4. Recent Developments
- 11.2.2.5. Financials (Based on Availability)
- 11.2.3 Energy Bombs
- 11.2.3.1. Overview
- 11.2.3.2. Products
- 11.2.3.3. SWOT Analysis
- 11.2.3.4. Recent Developments
- 11.2.3.5. Financials (Based on Availability)
- 11.2.4 Blast Power Gum
- 11.2.4.1. Overview
- 11.2.4.2. Products
- 11.2.4.3. SWOT Analysis
- 11.2.4.4. Recent Developments
- 11.2.4.5. Financials (Based on Availability)
- 11.2.5 BLOCKHEAD HQ Ltd
- 11.2.5.1. Overview
- 11.2.5.2. Products
- 11.2.5.3. SWOT Analysis
- 11.2.5.4. Recent Developments
- 11.2.5.5. Financials (Based on Availability)
- 11.2.6 NeuroGum
- 11.2.6.1. Overview
- 11.2.6.2. Products
- 11.2.6.3. SWOT Analysis
- 11.2.6.4. Recent Developments
- 11.2.6.5. Financials (Based on Availability)
- 11.2.7 LLC
- 11.2.7.1. Overview
- 11.2.7.2. Products
- 11.2.7.3. SWOT Analysis
- 11.2.7.4. Recent Developments
- 11.2.7.5. Financials (Based on Availability)
- 11.2.8 GelStat Corporation (Mastix LLC)
- 11.2.8.1. Overview
- 11.2.8.2. Products
- 11.2.8.3. SWOT Analysis
- 11.2.8.4. Recent Developments
- 11.2.8.5. Financials (Based on Availability)
- 11.2.9 Mondelez International
- 11.2.9.1. Overview
- 11.2.9.2. Products
- 11.2.9.3. SWOT Analysis
- 11.2.9.4. Recent Developments
- 11.2.9.5. Financials (Based on Availability)
- 11.2.10 Inc (Cadbury Trebor Bassett)
- 11.2.10.1. Overview
- 11.2.10.2. Products
- 11.2.10.3. SWOT Analysis
- 11.2.10.4. Recent Developments
- 11.2.10.5. Financials (Based on Availability)
- 11.2.11 LOTTE Corp
- 11.2.11.1. Overview
- 11.2.11.2. Products
- 11.2.11.3. SWOT Analysis
- 11.2.11.4. Recent Developments
- 11.2.11.5. Financials (Based on Availability)
- 11.2.1 Zestél International NZ Ltd
List of Figures
- Figure 1: Global Energy Caffeine Chewing Gum Revenue Breakdown (million, %) by Region 2024 & 2032
- Figure 2: Global Energy Caffeine Chewing Gum Volume Breakdown (K, %) by Region 2024 & 2032
- Figure 3: North America Energy Caffeine Chewing Gum Revenue (million), by Application 2024 & 2032
- Figure 4: North America Energy Caffeine Chewing Gum Volume (K), by Application 2024 & 2032
- Figure 5: North America Energy Caffeine Chewing Gum Revenue Share (%), by Application 2024 & 2032
- Figure 6: North America Energy Caffeine Chewing Gum Volume Share (%), by Application 2024 & 2032
- Figure 7: North America Energy Caffeine Chewing Gum Revenue (million), by Types 2024 & 2032
- Figure 8: North America Energy Caffeine Chewing Gum Volume (K), by Types 2024 & 2032
- Figure 9: North America Energy Caffeine Chewing Gum Revenue Share (%), by Types 2024 & 2032
- Figure 10: North America Energy Caffeine Chewing Gum Volume Share (%), by Types 2024 & 2032
- Figure 11: North America Energy Caffeine Chewing Gum Revenue (million), by Country 2024 & 2032
- Figure 12: North America Energy Caffeine Chewing Gum Volume (K), by Country 2024 & 2032
- Figure 13: North America Energy Caffeine Chewing Gum Revenue Share (%), by Country 2024 & 2032
- Figure 14: North America Energy Caffeine Chewing Gum Volume Share (%), by Country 2024 & 2032
- Figure 15: South America Energy Caffeine Chewing Gum Revenue (million), by Application 2024 & 2032
- Figure 16: South America Energy Caffeine Chewing Gum Volume (K), by Application 2024 & 2032
- Figure 17: South America Energy Caffeine Chewing Gum Revenue Share (%), by Application 2024 & 2032
- Figure 18: South America Energy Caffeine Chewing Gum Volume Share (%), by Application 2024 & 2032
- Figure 19: South America Energy Caffeine Chewing Gum Revenue (million), by Types 2024 & 2032
- Figure 20: South America Energy Caffeine Chewing Gum Volume (K), by Types 2024 & 2032
- Figure 21: South America Energy Caffeine Chewing Gum Revenue Share (%), by Types 2024 & 2032
- Figure 22: South America Energy Caffeine Chewing Gum Volume Share (%), by Types 2024 & 2032
- Figure 23: South America Energy Caffeine Chewing Gum Revenue (million), by Country 2024 & 2032
- Figure 24: South America Energy Caffeine Chewing Gum Volume (K), by Country 2024 & 2032
- Figure 25: South America Energy Caffeine Chewing Gum Revenue Share (%), by Country 2024 & 2032
- Figure 26: South America Energy Caffeine Chewing Gum Volume Share (%), by Country 2024 & 2032
- Figure 27: Europe Energy Caffeine Chewing Gum Revenue (million), by Application 2024 & 2032
- Figure 28: Europe Energy Caffeine Chewing Gum Volume (K), by Application 2024 & 2032
- Figure 29: Europe Energy Caffeine Chewing Gum Revenue Share (%), by Application 2024 & 2032
- Figure 30: Europe Energy Caffeine Chewing Gum Volume Share (%), by Application 2024 & 2032
- Figure 31: Europe Energy Caffeine Chewing Gum Revenue (million), by Types 2024 & 2032
- Figure 32: Europe Energy Caffeine Chewing Gum Volume (K), by Types 2024 & 2032
- Figure 33: Europe Energy Caffeine Chewing Gum Revenue Share (%), by Types 2024 & 2032
- Figure 34: Europe Energy Caffeine Chewing Gum Volume Share (%), by Types 2024 & 2032
- Figure 35: Europe Energy Caffeine Chewing Gum Revenue (million), by Country 2024 & 2032
- Figure 36: Europe Energy Caffeine Chewing Gum Volume (K), by Country 2024 & 2032
- Figure 37: Europe Energy Caffeine Chewing Gum Revenue Share (%), by Country 2024 & 2032
- Figure 38: Europe Energy Caffeine Chewing Gum Volume Share (%), by Country 2024 & 2032
- Figure 39: Middle East & Africa Energy Caffeine Chewing Gum Revenue (million), by Application 2024 & 2032
- Figure 40: Middle East & Africa Energy Caffeine Chewing Gum Volume (K), by Application 2024 & 2032
- Figure 41: Middle East & Africa Energy Caffeine Chewing Gum Revenue Share (%), by Application 2024 & 2032
- Figure 42: Middle East & Africa Energy Caffeine Chewing Gum Volume Share (%), by Application 2024 & 2032
- Figure 43: Middle East & Africa Energy Caffeine Chewing Gum Revenue (million), by Types 2024 & 2032
- Figure 44: Middle East & Africa Energy Caffeine Chewing Gum Volume (K), by Types 2024 & 2032
- Figure 45: Middle East & Africa Energy Caffeine Chewing Gum Revenue Share (%), by Types 2024 & 2032
- Figure 46: Middle East & Africa Energy Caffeine Chewing Gum Volume Share (%), by Types 2024 & 2032
- Figure 47: Middle East & Africa Energy Caffeine Chewing Gum Revenue (million), by Country 2024 & 2032
- Figure 48: Middle East & Africa Energy Caffeine Chewing Gum Volume (K), by Country 2024 & 2032
- Figure 49: Middle East & Africa Energy Caffeine Chewing Gum Revenue Share (%), by Country 2024 & 2032
- Figure 50: Middle East & Africa Energy Caffeine Chewing Gum Volume Share (%), by Country 2024 & 2032
- Figure 51: Asia Pacific Energy Caffeine Chewing Gum Revenue (million), by Application 2024 & 2032
- Figure 52: Asia Pacific Energy Caffeine Chewing Gum Volume (K), by Application 2024 & 2032
- Figure 53: Asia Pacific Energy Caffeine Chewing Gum Revenue Share (%), by Application 2024 & 2032
- Figure 54: Asia Pacific Energy Caffeine Chewing Gum Volume Share (%), by Application 2024 & 2032
- Figure 55: Asia Pacific Energy Caffeine Chewing Gum Revenue (million), by Types 2024 & 2032
- Figure 56: Asia Pacific Energy Caffeine Chewing Gum Volume (K), by Types 2024 & 2032
- Figure 57: Asia Pacific Energy Caffeine Chewing Gum Revenue Share (%), by Types 2024 & 2032
- Figure 58: Asia Pacific Energy Caffeine Chewing Gum Volume Share (%), by Types 2024 & 2032
- Figure 59: Asia Pacific Energy Caffeine Chewing Gum Revenue (million), by Country 2024 & 2032
- Figure 60: Asia Pacific Energy Caffeine Chewing Gum Volume (K), by Country 2024 & 2032
- Figure 61: Asia Pacific Energy Caffeine Chewing Gum Revenue Share (%), by Country 2024 & 2032
- Figure 62: Asia Pacific Energy Caffeine Chewing Gum Volume Share (%), by Country 2024 & 2032
List of Tables
- Table 1: Global Energy Caffeine Chewing Gum Revenue million Forecast, by Region 2019 & 2032
- Table 2: Global Energy Caffeine Chewing Gum Volume K Forecast, by Region 2019 & 2032
- Table 3: Global Energy Caffeine Chewing Gum Revenue million Forecast, by Application 2019 & 2032
- Table 4: Global Energy Caffeine Chewing Gum Volume K Forecast, by Application 2019 & 2032
- Table 5: Global Energy Caffeine Chewing Gum Revenue million Forecast, by Types 2019 & 2032
- Table 6: Global Energy Caffeine Chewing Gum Volume K Forecast, by Types 2019 & 2032
- Table 7: Global Energy Caffeine Chewing Gum Revenue million Forecast, by Region 2019 & 2032
- Table 8: Global Energy Caffeine Chewing Gum Volume K Forecast, by Region 2019 & 2032
- Table 9: Global Energy Caffeine Chewing Gum Revenue million Forecast, by Application 2019 & 2032
- Table 10: Global Energy Caffeine Chewing Gum Volume K Forecast, by Application 2019 & 2032
- Table 11: Global Energy Caffeine Chewing Gum Revenue million Forecast, by Types 2019 & 2032
- Table 12: Global Energy Caffeine Chewing Gum Volume K Forecast, by Types 2019 & 2032
- Table 13: Global Energy Caffeine Chewing Gum Revenue million Forecast, by Country 2019 & 2032
- Table 14: Global Energy Caffeine Chewing Gum Volume K Forecast, by Country 2019 & 2032
- Table 15: United States Energy Caffeine Chewing Gum Revenue (million) Forecast, by Application 2019 & 2032
- Table 16: United States Energy Caffeine Chewing Gum Volume (K) Forecast, by Application 2019 & 2032
- Table 17: Canada Energy Caffeine Chewing Gum Revenue (million) Forecast, by Application 2019 & 2032
- Table 18: Canada Energy Caffeine Chewing Gum Volume (K) Forecast, by Application 2019 & 2032
- Table 19: Mexico Energy Caffeine Chewing Gum Revenue (million) Forecast, by Application 2019 & 2032
- Table 20: Mexico Energy Caffeine Chewing Gum Volume (K) Forecast, by Application 2019 & 2032
- Table 21: Global Energy Caffeine Chewing Gum Revenue million Forecast, by Application 2019 & 2032
- Table 22: Global Energy Caffeine Chewing Gum Volume K Forecast, by Application 2019 & 2032
- Table 23: Global Energy Caffeine Chewing Gum Revenue million Forecast, by Types 2019 & 2032
- Table 24: Global Energy Caffeine Chewing Gum Volume K Forecast, by Types 2019 & 2032
- Table 25: Global Energy Caffeine Chewing Gum Revenue million Forecast, by Country 2019 & 2032
- Table 26: Global Energy Caffeine Chewing Gum Volume K Forecast, by Country 2019 & 2032
- Table 27: Brazil Energy Caffeine Chewing Gum Revenue (million) Forecast, by Application 2019 & 2032
- Table 28: Brazil Energy Caffeine Chewing Gum Volume (K) Forecast, by Application 2019 & 2032
- Table 29: Argentina Energy Caffeine Chewing Gum Revenue (million) Forecast, by Application 2019 & 2032
- Table 30: Argentina Energy Caffeine Chewing Gum Volume (K) Forecast, by Application 2019 & 2032
- Table 31: Rest of South America Energy Caffeine Chewing Gum Revenue (million) Forecast, by Application 2019 & 2032
- Table 32: Rest of South America Energy Caffeine Chewing Gum Volume (K) Forecast, by Application 2019 & 2032
- Table 33: Global Energy Caffeine Chewing Gum Revenue million Forecast, by Application 2019 & 2032
- Table 34: Global Energy Caffeine Chewing Gum Volume K Forecast, by Application 2019 & 2032
- Table 35: Global Energy Caffeine Chewing Gum Revenue million Forecast, by Types 2019 & 2032
- Table 36: Global Energy Caffeine Chewing Gum Volume K Forecast, by Types 2019 & 2032
- Table 37: Global Energy Caffeine Chewing Gum Revenue million Forecast, by Country 2019 & 2032
- Table 38: Global Energy Caffeine Chewing Gum Volume K Forecast, by Country 2019 & 2032
- Table 39: United Kingdom Energy Caffeine Chewing Gum Revenue (million) Forecast, by Application 2019 & 2032
- Table 40: United Kingdom Energy Caffeine Chewing Gum Volume (K) Forecast, by Application 2019 & 2032
- Table 41: Germany Energy Caffeine Chewing Gum Revenue (million) Forecast, by Application 2019 & 2032
- Table 42: Germany Energy Caffeine Chewing Gum Volume (K) Forecast, by Application 2019 & 2032
- Table 43: France Energy Caffeine Chewing Gum Revenue (million) Forecast, by Application 2019 & 2032
- Table 44: France Energy Caffeine Chewing Gum Volume (K) Forecast, by Application 2019 & 2032
- Table 45: Italy Energy Caffeine Chewing Gum Revenue (million) Forecast, by Application 2019 & 2032
- Table 46: Italy Energy Caffeine Chewing Gum Volume (K) Forecast, by Application 2019 & 2032
- Table 47: Spain Energy Caffeine Chewing Gum Revenue (million) Forecast, by Application 2019 & 2032
- Table 48: Spain Energy Caffeine Chewing Gum Volume (K) Forecast, by Application 2019 & 2032
- Table 49: Russia Energy Caffeine Chewing Gum Revenue (million) Forecast, by Application 2019 & 2032
- Table 50: Russia Energy Caffeine Chewing Gum Volume (K) Forecast, by Application 2019 & 2032
- Table 51: Benelux Energy Caffeine Chewing Gum Revenue (million) Forecast, by Application 2019 & 2032
- Table 52: Benelux Energy Caffeine Chewing Gum Volume (K) Forecast, by Application 2019 & 2032
- Table 53: Nordics Energy Caffeine Chewing Gum Revenue (million) Forecast, by Application 2019 & 2032
- Table 54: Nordics Energy Caffeine Chewing Gum Volume (K) Forecast, by Application 2019 & 2032
- Table 55: Rest of Europe Energy Caffeine Chewing Gum Revenue (million) Forecast, by Application 2019 & 2032
- Table 56: Rest of Europe Energy Caffeine Chewing Gum Volume (K) Forecast, by Application 2019 & 2032
- Table 57: Global Energy Caffeine Chewing Gum Revenue million Forecast, by Application 2019 & 2032
- Table 58: Global Energy Caffeine Chewing Gum Volume K Forecast, by Application 2019 & 2032
- Table 59: Global Energy Caffeine Chewing Gum Revenue million Forecast, by Types 2019 & 2032
- Table 60: Global Energy Caffeine Chewing Gum Volume K Forecast, by Types 2019 & 2032
- Table 61: Global Energy Caffeine Chewing Gum Revenue million Forecast, by Country 2019 & 2032
- Table 62: Global Energy Caffeine Chewing Gum Volume K Forecast, by Country 2019 & 2032
- Table 63: Turkey Energy Caffeine Chewing Gum Revenue (million) Forecast, by Application 2019 & 2032
- Table 64: Turkey Energy Caffeine Chewing Gum Volume (K) Forecast, by Application 2019 & 2032
- Table 65: Israel Energy Caffeine Chewing Gum Revenue (million) Forecast, by Application 2019 & 2032
- Table 66: Israel Energy Caffeine Chewing Gum Volume (K) Forecast, by Application 2019 & 2032
- Table 67: GCC Energy Caffeine Chewing Gum Revenue (million) Forecast, by Application 2019 & 2032
- Table 68: GCC Energy Caffeine Chewing Gum Volume (K) Forecast, by Application 2019 & 2032
- Table 69: North Africa Energy Caffeine Chewing Gum Revenue (million) Forecast, by Application 2019 & 2032
- Table 70: North Africa Energy Caffeine Chewing Gum Volume (K) Forecast, by Application 2019 & 2032
- Table 71: South Africa Energy Caffeine Chewing Gum Revenue (million) Forecast, by Application 2019 & 2032
- Table 72: South Africa Energy Caffeine Chewing Gum Volume (K) Forecast, by Application 2019 & 2032
- Table 73: Rest of Middle East & Africa Energy Caffeine Chewing Gum Revenue (million) Forecast, by Application 2019 & 2032
- Table 74: Rest of Middle East & Africa Energy Caffeine Chewing Gum Volume (K) Forecast, by Application 2019 & 2032
- Table 75: Global Energy Caffeine Chewing Gum Revenue million Forecast, by Application 2019 & 2032
- Table 76: Global Energy Caffeine Chewing Gum Volume K Forecast, by Application 2019 & 2032
- Table 77: Global Energy Caffeine Chewing Gum Revenue million Forecast, by Types 2019 & 2032
- Table 78: Global Energy Caffeine Chewing Gum Volume K Forecast, by Types 2019 & 2032
- Table 79: Global Energy Caffeine Chewing Gum Revenue million Forecast, by Country 2019 & 2032
- Table 80: Global Energy Caffeine Chewing Gum Volume K Forecast, by Country 2019 & 2032
- Table 81: China Energy Caffeine Chewing Gum Revenue (million) Forecast, by Application 2019 & 2032
- Table 82: China Energy Caffeine Chewing Gum Volume (K) Forecast, by Application 2019 & 2032
- Table 83: India Energy Caffeine Chewing Gum Revenue (million) Forecast, by Application 2019 & 2032
- Table 84: India Energy Caffeine Chewing Gum Volume (K) Forecast, by Application 2019 & 2032
- Table 85: Japan Energy Caffeine Chewing Gum Revenue (million) Forecast, by Application 2019 & 2032
- Table 86: Japan Energy Caffeine Chewing Gum Volume (K) Forecast, by Application 2019 & 2032
- Table 87: South Korea Energy Caffeine Chewing Gum Revenue (million) Forecast, by Application 2019 & 2032
- Table 88: South Korea Energy Caffeine Chewing Gum Volume (K) Forecast, by Application 2019 & 2032
- Table 89: ASEAN Energy Caffeine Chewing Gum Revenue (million) Forecast, by Application 2019 & 2032
- Table 90: ASEAN Energy Caffeine Chewing Gum Volume (K) Forecast, by Application 2019 & 2032
- Table 91: Oceania Energy Caffeine Chewing Gum Revenue (million) Forecast, by Application 2019 & 2032
- Table 92: Oceania Energy Caffeine Chewing Gum Volume (K) Forecast, by Application 2019 & 2032
- Table 93: Rest of Asia Pacific Energy Caffeine Chewing Gum Revenue (million) Forecast, by Application 2019 & 2032
- Table 94: Rest of Asia Pacific Energy Caffeine Chewing Gum Volume (K) Forecast, by Application 2019 & 2032
Frequently Asked Questions
1. What is the projected Compound Annual Growth Rate (CAGR) of the Energy Caffeine Chewing Gum?
The projected CAGR is approximately XX%.
2. Which companies are prominent players in the Energy Caffeine Chewing Gum?
Key companies in the market include Zestél International NZ Ltd, Mars Inc (Wm Wrigley), Energy Bombs, Blast Power Gum, BLOCKHEAD HQ Ltd, NeuroGum, LLC, GelStat Corporation (Mastix LLC), Mondelez International, Inc (Cadbury Trebor Bassett), LOTTE Corp.
3. What are the main segments of the Energy Caffeine Chewing Gum?
The market segments include Application, Types.
4. Can you provide details about the market size?
The market size is estimated to be USD XXX million as of 2022.
5. What are some drivers contributing to market growth?
N/A
6. What are the notable trends driving market growth?
N/A
7. Are there any restraints impacting market growth?
N/A
8. Can you provide examples of recent developments in the market?
N/A
9. What pricing options are available for accessing the report?
Pricing options include single-user, multi-user, and enterprise licenses priced at USD 3950.00, USD 5925.00, and USD 7900.00 respectively.
10. Is the market size provided in terms of value or volume?
The market size is provided in terms of value, measured in million and volume, measured in K.
11. Are there any specific market keywords associated with the report?
Yes, the market keyword associated with the report is "Energy Caffeine Chewing Gum," which aids in identifying and referencing the specific market segment covered.
12. How do I determine which pricing option suits my needs best?
The pricing options vary based on user requirements and access needs. Individual users may opt for single-user licenses, while businesses requiring broader access may choose multi-user or enterprise licenses for cost-effective access to the report.
13. Are there any additional resources or data provided in the Energy Caffeine Chewing Gum report?
While the report offers comprehensive insights, it's advisable to review the specific contents or supplementary materials provided to ascertain if additional resources or data are available.
14. How can I stay updated on further developments or reports in the Energy Caffeine Chewing Gum?
To stay informed about further developments, trends, and reports in the Energy Caffeine Chewing Gum, consider subscribing to industry newsletters, following relevant companies and organizations, or regularly checking reputable industry news sources and publications.
Methodology
Step 1 - Identification of Relevant Samples Size from Population Database


Step 2 - Approaches for Defining Global Market Size (Value, Volume* & Price*)

Note*: In applicable scenarios
Step 3 - Data Sources
Primary Research
- Web Analytics
- Survey Reports
- Research Institute
- Latest Research Reports
- Opinion Leaders
Secondary Research
- Annual Reports
- White Paper
- Latest Press Release
- Industry Association
- Paid Database
- Investor Presentations

Step 4 - Data Triangulation
Involves using different sources of information in order to increase the validity of a study
These sources are likely to be stakeholders in a program - participants, other researchers, program staff, other community members, and so on.
Then we put all data in single framework & apply various statistical tools to find out the dynamic on the market.
During the analysis stage, feedback from the stakeholder groups would be compared to determine areas of agreement as well as areas of divergence
