

Key Insights
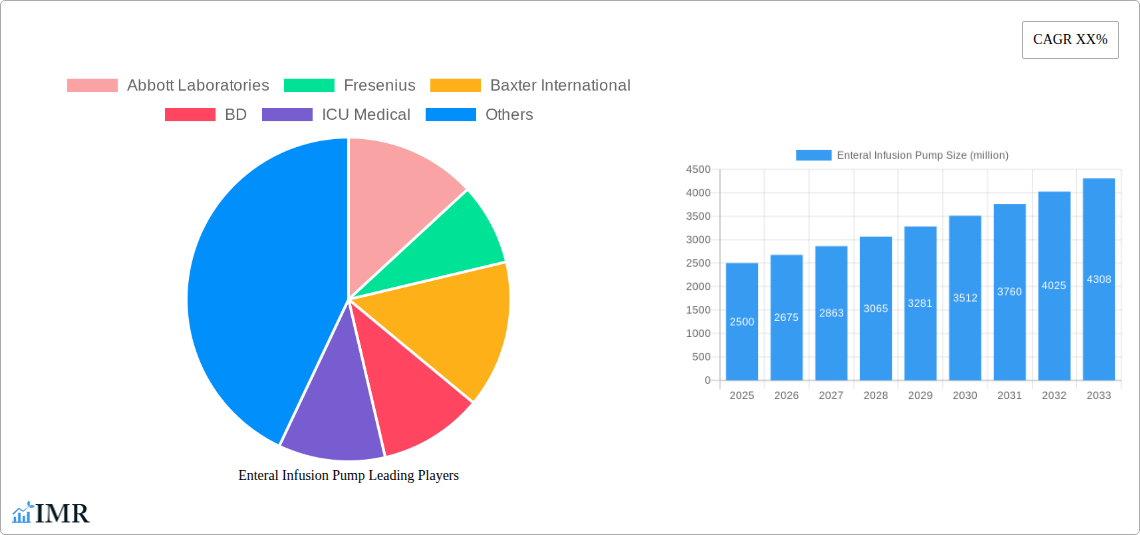
The global enteral infusion pump market is experiencing robust growth, driven by factors such as the rising prevalence of chronic diseases requiring enteral nutrition, technological advancements leading to improved pump features (e.g., wireless connectivity, bolus delivery options), and an increasing geriatric population. The market's compound annual growth rate (CAGR) is estimated to be around 7% for the forecast period (2025-2033), reflecting consistent demand and ongoing innovation within the sector. Key players like Abbott Laboratories, Fresenius, and Baxter International are actively contributing to market growth through product diversification and strategic partnerships. The market segmentation is likely diverse, encompassing various pump types (e.g., volumetric, peristaltic), applications (hospitals, home care), and delivery methods. Growth is expected to be particularly strong in emerging economies, fueled by rising healthcare expenditure and improving healthcare infrastructure. Restraining factors include the high cost of advanced pumps, stringent regulatory approvals, and potential risks associated with pump malfunctions.
The market size in 2025 is estimated to be $2.5 billion, based on industry reports and analysis of similar medical device sectors. This figure is projected to reach approximately $4 billion by 2033, reflecting the steady growth trajectory. Regional market share will likely show North America and Europe dominating initially, with Asia-Pacific and other emerging regions exhibiting faster growth rates over the forecast period. This is due to increasing healthcare awareness, growing disposable income, and supportive government initiatives promoting better healthcare access in these regions. Competitive landscape analysis reveals a mix of established multinational corporations and regional players. Competition is based on technological innovation, pricing strategies, and distribution networks.
Enteral Infusion Pump Market Report: 2019-2033
This comprehensive report provides a detailed analysis of the global enteral infusion pump market, encompassing market dynamics, growth trends, regional insights, competitive landscape, and future outlook. The study period covers 2019-2033, with 2025 as the base year and estimated year. The forecast period spans 2025-2033, and the historical period encompasses 2019-2024. This report is invaluable for industry professionals, investors, and strategic decision-makers seeking to understand and capitalize on the opportunities within this dynamic sector. The parent market is the medical device market (valued at xx million units in 2025), while the child market is the enteral feeding market (valued at xx million units in 2025).
Enteral Infusion Pump Market Dynamics & Structure
The enteral infusion pump market is characterized by moderate concentration, with key players like Abbott Laboratories, Fresenius, and Baxter International holding significant market share (estimated at xx% collectively in 2025). Technological innovation, particularly in areas such as wireless connectivity and closed-system drug delivery, is a major driver. Stringent regulatory frameworks governing medical devices influence market access and product development. Competitive substitutes include gravity-fed feeding systems, but the increasing preference for precise medication delivery fuels demand for infusion pumps. The end-user demographics primarily comprise hospitals, long-term care facilities, and home healthcare settings. M&A activity in the sector has been moderate (xx deals in the past five years), reflecting a focus on consolidation and expansion into adjacent markets.
- Market Concentration: Moderately concentrated, with top 3 players holding xx% market share in 2025.
- Technological Innovation: Focus on wireless connectivity, closed-system drug delivery, and improved accuracy.
- Regulatory Landscape: Stringent FDA and other international regulatory approvals needed.
- Competitive Substitutes: Gravity-fed systems; however, infusion pumps offer superior precision.
- End-User Demographics: Hospitals, long-term care facilities, home healthcare.
- M&A Activity: Moderate activity (xx deals in the last 5 years), driven by consolidation and expansion.
Enteral Infusion Pump Growth Trends & Insights
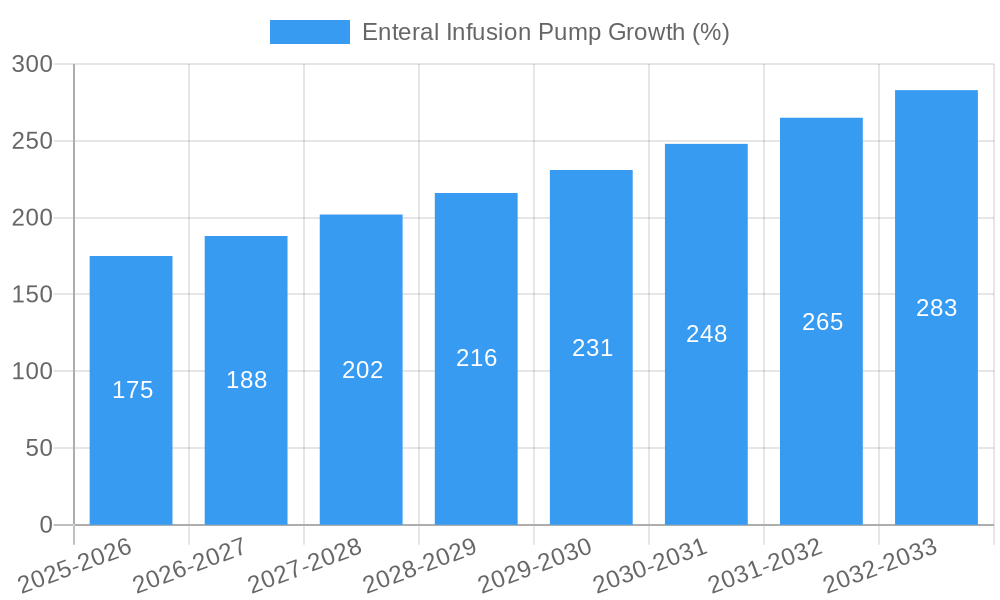
The global enteral infusion pump market is experiencing steady growth, driven by increasing prevalence of chronic diseases requiring enteral nutrition, rising geriatric population, and technological advancements enhancing device capabilities. The market size reached xx million units in 2024, exhibiting a CAGR of xx% during 2019-2024. Adoption rates are particularly high in developed regions, with market penetration exceeding xx% in some countries. Technological disruptions, such as the introduction of smart pumps with advanced monitoring features, are fueling further growth. Consumer behavior shifts are evident in the increasing preference for portable and user-friendly devices for home healthcare applications. The forecast period (2025-2033) projects a CAGR of xx%, with the market size expected to reach xx million units by 2033.
Dominant Regions, Countries, or Segments in Enteral Infusion Pump
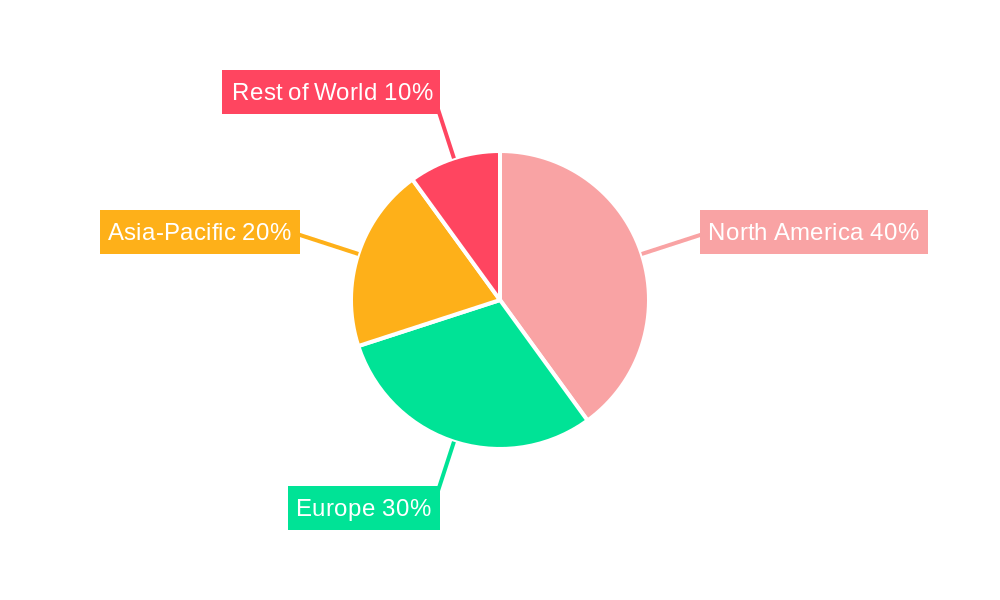
North America currently dominates the enteral infusion pump market, driven by robust healthcare infrastructure, high adoption rates of advanced medical technologies, and a large geriatric population. This region holds an estimated xx% market share in 2025. Europe follows closely, contributing a xx% market share. However, emerging economies in Asia-Pacific are showing significant growth potential, fueled by rising healthcare expenditure and increasing awareness of enteral nutrition.
- Key Drivers in North America: Well-established healthcare infrastructure, high technological adoption, large geriatric population.
- Key Drivers in Europe: Similar to North America but with varying healthcare systems and regulatory landscapes.
- Key Drivers in Asia-Pacific: Rising healthcare expenditure, growing awareness of enteral nutrition, increasing disposable incomes.
- Market Share (2025): North America (xx%), Europe (xx%), Asia-Pacific (xx%), Rest of World (xx%).
Enteral Infusion Pump Product Landscape
The enteral infusion pump market encompasses a range of products with varying features, including bolus delivery, continuous infusion, and multi-channel capabilities. Recent innovations focus on improved accuracy, smaller form factors, and enhanced safety features. Smart pumps with wireless connectivity and data-logging capabilities are gaining traction. Key selling propositions include ease of use, precise medication delivery, and improved patient safety. Technological advancements focus on reducing occlusion risks, enhancing pump reliability, and integrating advanced alarm systems.
Key Drivers, Barriers & Challenges in Enteral Infusion Pump
Key Drivers: The aging population, rising prevalence of chronic diseases requiring enteral nutrition, and technological advancements in pump design are key drivers. Increased demand for home healthcare solutions also fuels growth. Favorable regulatory environment in some regions facilitates market expansion.
Key Challenges & Restraints: High initial costs, concerns about device malfunctions, and potential for medication errors pose challenges. Complex regulatory processes for product approvals and reimbursement policies present hurdles. Intense competition among established players and emerging companies puts pressure on profit margins. Supply chain disruptions due to global events can impact product availability.
Emerging Opportunities in Enteral Infusion Pump
Emerging markets in developing countries present significant growth opportunities. The development of advanced features, such as smart pump technology, remote monitoring, and integration with electronic health records (EHRs), can create new avenues for growth. Focus on customized and user-friendly solutions for home healthcare can also tap into untapped markets.
Growth Accelerators in the Enteral Infusion Pump Industry
Strategic partnerships between pump manufacturers and healthcare providers, investments in research and development of innovative pump technologies, and the increasing integration of enteral infusion pumps with other medical devices to create comprehensive care solutions are crucial growth accelerators.
Key Players Shaping the Enteral Infusion Pump Market
- Abbott Laboratories
- Fresenius
- Baxter International
- BD
- ICU Medical
- ACE Medical
- B.Braun
- Medtronic
- Apon Medical
- Mindray
- HENAN TUOREN MEDICAL DEVICE
- Royal Fornia Medical Equipment
Notable Milestones in Enteral Infusion Pump Sector
- 2020: Abbott Laboratories launched a new smart pump with advanced features.
- 2022: Fresenius acquired a smaller enteral pump company, expanding its product portfolio.
- 2023: FDA approval for a novel closed-system enteral feeding pump.
- 2024: Significant investments announced in R&D for next-generation pumps by several key players.
In-Depth Enteral Infusion Pump Market Outlook
The enteral infusion pump market is poised for sustained growth, driven by technological advancements, increasing demand in emerging markets, and the growing need for precise and safe medication delivery. Strategic partnerships, focusing on developing innovative technologies and expanding into new market segments, offer significant opportunities for players in this sector. The projected CAGR and market size by 2033 highlight the substantial potential for future growth and investment.
Enteral Infusion Pump Segmentation
-
1. Application
- 1.1. Hospital
- 1.2. Clinic
- 1.3. Other
-
2. Types
- 2.1. Volumetric Infusion Pumps
- 2.2. Syringe Infusion Pumps
- 2.3. Others
Enteral Infusion Pump Segmentation By Geography
-
1. North America
- 1.1. United States
- 1.2. Canada
- 1.3. Mexico
-
2. South America
- 2.1. Brazil
- 2.2. Argentina
- 2.3. Rest of South America
-
3. Europe
- 3.1. United Kingdom
- 3.2. Germany
- 3.3. France
- 3.4. Italy
- 3.5. Spain
- 3.6. Russia
- 3.7. Benelux
- 3.8. Nordics
- 3.9. Rest of Europe
-
4. Middle East & Africa
- 4.1. Turkey
- 4.2. Israel
- 4.3. GCC
- 4.4. North Africa
- 4.5. South Africa
- 4.6. Rest of Middle East & Africa
-
5. Asia Pacific
- 5.1. China
- 5.2. India
- 5.3. Japan
- 5.4. South Korea
- 5.5. ASEAN
- 5.6. Oceania
- 5.7. Rest of Asia Pacific
Enteral Infusion Pump REPORT HIGHLIGHTS
| Aspects | Details |
|---|---|
| Study Period | 2019-2033 |
| Base Year | 2024 |
| Estimated Year | 2025 |
| Forecast Period | 2025-2033 |
| Historical Period | 2019-2024 |
| Growth Rate | CAGR of XX% from 2019-2033 |
| Segmentation |
|
Table of Contents
- 1. Introduction
- 1.1. Research Scope
- 1.2. Market Segmentation
- 1.3. Research Methodology
- 1.4. Definitions and Assumptions
- 2. Executive Summary
- 2.1. Introduction
- 3. Market Dynamics
- 3.1. Introduction
- 3.2. Market Drivers
- 3.3. Market Restrains
- 3.4. Market Trends
- 4. Market Factor Analysis
- 4.1. Porters Five Forces
- 4.2. Supply/Value Chain
- 4.3. PESTEL analysis
- 4.4. Market Entropy
- 4.5. Patent/Trademark Analysis
- 5. Global Enteral Infusion Pump Analysis, Insights and Forecast, 2019-2031
- 5.1. Market Analysis, Insights and Forecast - by Application
- 5.1.1. Hospital
- 5.1.2. Clinic
- 5.1.3. Other
- 5.2. Market Analysis, Insights and Forecast - by Types
- 5.2.1. Volumetric Infusion Pumps
- 5.2.2. Syringe Infusion Pumps
- 5.2.3. Others
- 5.3. Market Analysis, Insights and Forecast - by Region
- 5.3.1. North America
- 5.3.2. South America
- 5.3.3. Europe
- 5.3.4. Middle East & Africa
- 5.3.5. Asia Pacific
- 5.1. Market Analysis, Insights and Forecast - by Application
- 6. North America Enteral Infusion Pump Analysis, Insights and Forecast, 2019-2031
- 6.1. Market Analysis, Insights and Forecast - by Application
- 6.1.1. Hospital
- 6.1.2. Clinic
- 6.1.3. Other
- 6.2. Market Analysis, Insights and Forecast - by Types
- 6.2.1. Volumetric Infusion Pumps
- 6.2.2. Syringe Infusion Pumps
- 6.2.3. Others
- 6.1. Market Analysis, Insights and Forecast - by Application
- 7. South America Enteral Infusion Pump Analysis, Insights and Forecast, 2019-2031
- 7.1. Market Analysis, Insights and Forecast - by Application
- 7.1.1. Hospital
- 7.1.2. Clinic
- 7.1.3. Other
- 7.2. Market Analysis, Insights and Forecast - by Types
- 7.2.1. Volumetric Infusion Pumps
- 7.2.2. Syringe Infusion Pumps
- 7.2.3. Others
- 7.1. Market Analysis, Insights and Forecast - by Application
- 8. Europe Enteral Infusion Pump Analysis, Insights and Forecast, 2019-2031
- 8.1. Market Analysis, Insights and Forecast - by Application
- 8.1.1. Hospital
- 8.1.2. Clinic
- 8.1.3. Other
- 8.2. Market Analysis, Insights and Forecast - by Types
- 8.2.1. Volumetric Infusion Pumps
- 8.2.2. Syringe Infusion Pumps
- 8.2.3. Others
- 8.1. Market Analysis, Insights and Forecast - by Application
- 9. Middle East & Africa Enteral Infusion Pump Analysis, Insights and Forecast, 2019-2031
- 9.1. Market Analysis, Insights and Forecast - by Application
- 9.1.1. Hospital
- 9.1.2. Clinic
- 9.1.3. Other
- 9.2. Market Analysis, Insights and Forecast - by Types
- 9.2.1. Volumetric Infusion Pumps
- 9.2.2. Syringe Infusion Pumps
- 9.2.3. Others
- 9.1. Market Analysis, Insights and Forecast - by Application
- 10. Asia Pacific Enteral Infusion Pump Analysis, Insights and Forecast, 2019-2031
- 10.1. Market Analysis, Insights and Forecast - by Application
- 10.1.1. Hospital
- 10.1.2. Clinic
- 10.1.3. Other
- 10.2. Market Analysis, Insights and Forecast - by Types
- 10.2.1. Volumetric Infusion Pumps
- 10.2.2. Syringe Infusion Pumps
- 10.2.3. Others
- 10.1. Market Analysis, Insights and Forecast - by Application
- 11. Competitive Analysis
- 11.1. Global Market Share Analysis 2024
- 11.2. Company Profiles
- 11.2.1 Abbott Laboratories
- 11.2.1.1. Overview
- 11.2.1.2. Products
- 11.2.1.3. SWOT Analysis
- 11.2.1.4. Recent Developments
- 11.2.1.5. Financials (Based on Availability)
- 11.2.2 Fresenius
- 11.2.2.1. Overview
- 11.2.2.2. Products
- 11.2.2.3. SWOT Analysis
- 11.2.2.4. Recent Developments
- 11.2.2.5. Financials (Based on Availability)
- 11.2.3 Baxter International
- 11.2.3.1. Overview
- 11.2.3.2. Products
- 11.2.3.3. SWOT Analysis
- 11.2.3.4. Recent Developments
- 11.2.3.5. Financials (Based on Availability)
- 11.2.4 BD
- 11.2.4.1. Overview
- 11.2.4.2. Products
- 11.2.4.3. SWOT Analysis
- 11.2.4.4. Recent Developments
- 11.2.4.5. Financials (Based on Availability)
- 11.2.5 ICU Medical
- 11.2.5.1. Overview
- 11.2.5.2. Products
- 11.2.5.3. SWOT Analysis
- 11.2.5.4. Recent Developments
- 11.2.5.5. Financials (Based on Availability)
- 11.2.6 ACE Medical
- 11.2.6.1. Overview
- 11.2.6.2. Products
- 11.2.6.3. SWOT Analysis
- 11.2.6.4. Recent Developments
- 11.2.6.5. Financials (Based on Availability)
- 11.2.7 B.Braun
- 11.2.7.1. Overview
- 11.2.7.2. Products
- 11.2.7.3. SWOT Analysis
- 11.2.7.4. Recent Developments
- 11.2.7.5. Financials (Based on Availability)
- 11.2.8 Medtronic
- 11.2.8.1. Overview
- 11.2.8.2. Products
- 11.2.8.3. SWOT Analysis
- 11.2.8.4. Recent Developments
- 11.2.8.5. Financials (Based on Availability)
- 11.2.9 Apon Medical
- 11.2.9.1. Overview
- 11.2.9.2. Products
- 11.2.9.3. SWOT Analysis
- 11.2.9.4. Recent Developments
- 11.2.9.5. Financials (Based on Availability)
- 11.2.10 Mindray
- 11.2.10.1. Overview
- 11.2.10.2. Products
- 11.2.10.3. SWOT Analysis
- 11.2.10.4. Recent Developments
- 11.2.10.5. Financials (Based on Availability)
- 11.2.11 HENAN TUOREN MEDICAL DEVICE
- 11.2.11.1. Overview
- 11.2.11.2. Products
- 11.2.11.3. SWOT Analysis
- 11.2.11.4. Recent Developments
- 11.2.11.5. Financials (Based on Availability)
- 11.2.12 Royal Fornia Medical Equipment
- 11.2.12.1. Overview
- 11.2.12.2. Products
- 11.2.12.3. SWOT Analysis
- 11.2.12.4. Recent Developments
- 11.2.12.5. Financials (Based on Availability)
- 11.2.1 Abbott Laboratories
List of Figures
- Figure 1: Global Enteral Infusion Pump Revenue Breakdown (million, %) by Region 2024 & 2032
- Figure 2: Global Enteral Infusion Pump Volume Breakdown (K, %) by Region 2024 & 2032
- Figure 3: North America Enteral Infusion Pump Revenue (million), by Application 2024 & 2032
- Figure 4: North America Enteral Infusion Pump Volume (K), by Application 2024 & 2032
- Figure 5: North America Enteral Infusion Pump Revenue Share (%), by Application 2024 & 2032
- Figure 6: North America Enteral Infusion Pump Volume Share (%), by Application 2024 & 2032
- Figure 7: North America Enteral Infusion Pump Revenue (million), by Types 2024 & 2032
- Figure 8: North America Enteral Infusion Pump Volume (K), by Types 2024 & 2032
- Figure 9: North America Enteral Infusion Pump Revenue Share (%), by Types 2024 & 2032
- Figure 10: North America Enteral Infusion Pump Volume Share (%), by Types 2024 & 2032
- Figure 11: North America Enteral Infusion Pump Revenue (million), by Country 2024 & 2032
- Figure 12: North America Enteral Infusion Pump Volume (K), by Country 2024 & 2032
- Figure 13: North America Enteral Infusion Pump Revenue Share (%), by Country 2024 & 2032
- Figure 14: North America Enteral Infusion Pump Volume Share (%), by Country 2024 & 2032
- Figure 15: South America Enteral Infusion Pump Revenue (million), by Application 2024 & 2032
- Figure 16: South America Enteral Infusion Pump Volume (K), by Application 2024 & 2032
- Figure 17: South America Enteral Infusion Pump Revenue Share (%), by Application 2024 & 2032
- Figure 18: South America Enteral Infusion Pump Volume Share (%), by Application 2024 & 2032
- Figure 19: South America Enteral Infusion Pump Revenue (million), by Types 2024 & 2032
- Figure 20: South America Enteral Infusion Pump Volume (K), by Types 2024 & 2032
- Figure 21: South America Enteral Infusion Pump Revenue Share (%), by Types 2024 & 2032
- Figure 22: South America Enteral Infusion Pump Volume Share (%), by Types 2024 & 2032
- Figure 23: South America Enteral Infusion Pump Revenue (million), by Country 2024 & 2032
- Figure 24: South America Enteral Infusion Pump Volume (K), by Country 2024 & 2032
- Figure 25: South America Enteral Infusion Pump Revenue Share (%), by Country 2024 & 2032
- Figure 26: South America Enteral Infusion Pump Volume Share (%), by Country 2024 & 2032
- Figure 27: Europe Enteral Infusion Pump Revenue (million), by Application 2024 & 2032
- Figure 28: Europe Enteral Infusion Pump Volume (K), by Application 2024 & 2032
- Figure 29: Europe Enteral Infusion Pump Revenue Share (%), by Application 2024 & 2032
- Figure 30: Europe Enteral Infusion Pump Volume Share (%), by Application 2024 & 2032
- Figure 31: Europe Enteral Infusion Pump Revenue (million), by Types 2024 & 2032
- Figure 32: Europe Enteral Infusion Pump Volume (K), by Types 2024 & 2032
- Figure 33: Europe Enteral Infusion Pump Revenue Share (%), by Types 2024 & 2032
- Figure 34: Europe Enteral Infusion Pump Volume Share (%), by Types 2024 & 2032
- Figure 35: Europe Enteral Infusion Pump Revenue (million), by Country 2024 & 2032
- Figure 36: Europe Enteral Infusion Pump Volume (K), by Country 2024 & 2032
- Figure 37: Europe Enteral Infusion Pump Revenue Share (%), by Country 2024 & 2032
- Figure 38: Europe Enteral Infusion Pump Volume Share (%), by Country 2024 & 2032
- Figure 39: Middle East & Africa Enteral Infusion Pump Revenue (million), by Application 2024 & 2032
- Figure 40: Middle East & Africa Enteral Infusion Pump Volume (K), by Application 2024 & 2032
- Figure 41: Middle East & Africa Enteral Infusion Pump Revenue Share (%), by Application 2024 & 2032
- Figure 42: Middle East & Africa Enteral Infusion Pump Volume Share (%), by Application 2024 & 2032
- Figure 43: Middle East & Africa Enteral Infusion Pump Revenue (million), by Types 2024 & 2032
- Figure 44: Middle East & Africa Enteral Infusion Pump Volume (K), by Types 2024 & 2032
- Figure 45: Middle East & Africa Enteral Infusion Pump Revenue Share (%), by Types 2024 & 2032
- Figure 46: Middle East & Africa Enteral Infusion Pump Volume Share (%), by Types 2024 & 2032
- Figure 47: Middle East & Africa Enteral Infusion Pump Revenue (million), by Country 2024 & 2032
- Figure 48: Middle East & Africa Enteral Infusion Pump Volume (K), by Country 2024 & 2032
- Figure 49: Middle East & Africa Enteral Infusion Pump Revenue Share (%), by Country 2024 & 2032
- Figure 50: Middle East & Africa Enteral Infusion Pump Volume Share (%), by Country 2024 & 2032
- Figure 51: Asia Pacific Enteral Infusion Pump Revenue (million), by Application 2024 & 2032
- Figure 52: Asia Pacific Enteral Infusion Pump Volume (K), by Application 2024 & 2032
- Figure 53: Asia Pacific Enteral Infusion Pump Revenue Share (%), by Application 2024 & 2032
- Figure 54: Asia Pacific Enteral Infusion Pump Volume Share (%), by Application 2024 & 2032
- Figure 55: Asia Pacific Enteral Infusion Pump Revenue (million), by Types 2024 & 2032
- Figure 56: Asia Pacific Enteral Infusion Pump Volume (K), by Types 2024 & 2032
- Figure 57: Asia Pacific Enteral Infusion Pump Revenue Share (%), by Types 2024 & 2032
- Figure 58: Asia Pacific Enteral Infusion Pump Volume Share (%), by Types 2024 & 2032
- Figure 59: Asia Pacific Enteral Infusion Pump Revenue (million), by Country 2024 & 2032
- Figure 60: Asia Pacific Enteral Infusion Pump Volume (K), by Country 2024 & 2032
- Figure 61: Asia Pacific Enteral Infusion Pump Revenue Share (%), by Country 2024 & 2032
- Figure 62: Asia Pacific Enteral Infusion Pump Volume Share (%), by Country 2024 & 2032
List of Tables
- Table 1: Global Enteral Infusion Pump Revenue million Forecast, by Region 2019 & 2032
- Table 2: Global Enteral Infusion Pump Volume K Forecast, by Region 2019 & 2032
- Table 3: Global Enteral Infusion Pump Revenue million Forecast, by Application 2019 & 2032
- Table 4: Global Enteral Infusion Pump Volume K Forecast, by Application 2019 & 2032
- Table 5: Global Enteral Infusion Pump Revenue million Forecast, by Types 2019 & 2032
- Table 6: Global Enteral Infusion Pump Volume K Forecast, by Types 2019 & 2032
- Table 7: Global Enteral Infusion Pump Revenue million Forecast, by Region 2019 & 2032
- Table 8: Global Enteral Infusion Pump Volume K Forecast, by Region 2019 & 2032
- Table 9: Global Enteral Infusion Pump Revenue million Forecast, by Application 2019 & 2032
- Table 10: Global Enteral Infusion Pump Volume K Forecast, by Application 2019 & 2032
- Table 11: Global Enteral Infusion Pump Revenue million Forecast, by Types 2019 & 2032
- Table 12: Global Enteral Infusion Pump Volume K Forecast, by Types 2019 & 2032
- Table 13: Global Enteral Infusion Pump Revenue million Forecast, by Country 2019 & 2032
- Table 14: Global Enteral Infusion Pump Volume K Forecast, by Country 2019 & 2032
- Table 15: United States Enteral Infusion Pump Revenue (million) Forecast, by Application 2019 & 2032
- Table 16: United States Enteral Infusion Pump Volume (K) Forecast, by Application 2019 & 2032
- Table 17: Canada Enteral Infusion Pump Revenue (million) Forecast, by Application 2019 & 2032
- Table 18: Canada Enteral Infusion Pump Volume (K) Forecast, by Application 2019 & 2032
- Table 19: Mexico Enteral Infusion Pump Revenue (million) Forecast, by Application 2019 & 2032
- Table 20: Mexico Enteral Infusion Pump Volume (K) Forecast, by Application 2019 & 2032
- Table 21: Global Enteral Infusion Pump Revenue million Forecast, by Application 2019 & 2032
- Table 22: Global Enteral Infusion Pump Volume K Forecast, by Application 2019 & 2032
- Table 23: Global Enteral Infusion Pump Revenue million Forecast, by Types 2019 & 2032
- Table 24: Global Enteral Infusion Pump Volume K Forecast, by Types 2019 & 2032
- Table 25: Global Enteral Infusion Pump Revenue million Forecast, by Country 2019 & 2032
- Table 26: Global Enteral Infusion Pump Volume K Forecast, by Country 2019 & 2032
- Table 27: Brazil Enteral Infusion Pump Revenue (million) Forecast, by Application 2019 & 2032
- Table 28: Brazil Enteral Infusion Pump Volume (K) Forecast, by Application 2019 & 2032
- Table 29: Argentina Enteral Infusion Pump Revenue (million) Forecast, by Application 2019 & 2032
- Table 30: Argentina Enteral Infusion Pump Volume (K) Forecast, by Application 2019 & 2032
- Table 31: Rest of South America Enteral Infusion Pump Revenue (million) Forecast, by Application 2019 & 2032
- Table 32: Rest of South America Enteral Infusion Pump Volume (K) Forecast, by Application 2019 & 2032
- Table 33: Global Enteral Infusion Pump Revenue million Forecast, by Application 2019 & 2032
- Table 34: Global Enteral Infusion Pump Volume K Forecast, by Application 2019 & 2032
- Table 35: Global Enteral Infusion Pump Revenue million Forecast, by Types 2019 & 2032
- Table 36: Global Enteral Infusion Pump Volume K Forecast, by Types 2019 & 2032
- Table 37: Global Enteral Infusion Pump Revenue million Forecast, by Country 2019 & 2032
- Table 38: Global Enteral Infusion Pump Volume K Forecast, by Country 2019 & 2032
- Table 39: United Kingdom Enteral Infusion Pump Revenue (million) Forecast, by Application 2019 & 2032
- Table 40: United Kingdom Enteral Infusion Pump Volume (K) Forecast, by Application 2019 & 2032
- Table 41: Germany Enteral Infusion Pump Revenue (million) Forecast, by Application 2019 & 2032
- Table 42: Germany Enteral Infusion Pump Volume (K) Forecast, by Application 2019 & 2032
- Table 43: France Enteral Infusion Pump Revenue (million) Forecast, by Application 2019 & 2032
- Table 44: France Enteral Infusion Pump Volume (K) Forecast, by Application 2019 & 2032
- Table 45: Italy Enteral Infusion Pump Revenue (million) Forecast, by Application 2019 & 2032
- Table 46: Italy Enteral Infusion Pump Volume (K) Forecast, by Application 2019 & 2032
- Table 47: Spain Enteral Infusion Pump Revenue (million) Forecast, by Application 2019 & 2032
- Table 48: Spain Enteral Infusion Pump Volume (K) Forecast, by Application 2019 & 2032
- Table 49: Russia Enteral Infusion Pump Revenue (million) Forecast, by Application 2019 & 2032
- Table 50: Russia Enteral Infusion Pump Volume (K) Forecast, by Application 2019 & 2032
- Table 51: Benelux Enteral Infusion Pump Revenue (million) Forecast, by Application 2019 & 2032
- Table 52: Benelux Enteral Infusion Pump Volume (K) Forecast, by Application 2019 & 2032
- Table 53: Nordics Enteral Infusion Pump Revenue (million) Forecast, by Application 2019 & 2032
- Table 54: Nordics Enteral Infusion Pump Volume (K) Forecast, by Application 2019 & 2032
- Table 55: Rest of Europe Enteral Infusion Pump Revenue (million) Forecast, by Application 2019 & 2032
- Table 56: Rest of Europe Enteral Infusion Pump Volume (K) Forecast, by Application 2019 & 2032
- Table 57: Global Enteral Infusion Pump Revenue million Forecast, by Application 2019 & 2032
- Table 58: Global Enteral Infusion Pump Volume K Forecast, by Application 2019 & 2032
- Table 59: Global Enteral Infusion Pump Revenue million Forecast, by Types 2019 & 2032
- Table 60: Global Enteral Infusion Pump Volume K Forecast, by Types 2019 & 2032
- Table 61: Global Enteral Infusion Pump Revenue million Forecast, by Country 2019 & 2032
- Table 62: Global Enteral Infusion Pump Volume K Forecast, by Country 2019 & 2032
- Table 63: Turkey Enteral Infusion Pump Revenue (million) Forecast, by Application 2019 & 2032
- Table 64: Turkey Enteral Infusion Pump Volume (K) Forecast, by Application 2019 & 2032
- Table 65: Israel Enteral Infusion Pump Revenue (million) Forecast, by Application 2019 & 2032
- Table 66: Israel Enteral Infusion Pump Volume (K) Forecast, by Application 2019 & 2032
- Table 67: GCC Enteral Infusion Pump Revenue (million) Forecast, by Application 2019 & 2032
- Table 68: GCC Enteral Infusion Pump Volume (K) Forecast, by Application 2019 & 2032
- Table 69: North Africa Enteral Infusion Pump Revenue (million) Forecast, by Application 2019 & 2032
- Table 70: North Africa Enteral Infusion Pump Volume (K) Forecast, by Application 2019 & 2032
- Table 71: South Africa Enteral Infusion Pump Revenue (million) Forecast, by Application 2019 & 2032
- Table 72: South Africa Enteral Infusion Pump Volume (K) Forecast, by Application 2019 & 2032
- Table 73: Rest of Middle East & Africa Enteral Infusion Pump Revenue (million) Forecast, by Application 2019 & 2032
- Table 74: Rest of Middle East & Africa Enteral Infusion Pump Volume (K) Forecast, by Application 2019 & 2032
- Table 75: Global Enteral Infusion Pump Revenue million Forecast, by Application 2019 & 2032
- Table 76: Global Enteral Infusion Pump Volume K Forecast, by Application 2019 & 2032
- Table 77: Global Enteral Infusion Pump Revenue million Forecast, by Types 2019 & 2032
- Table 78: Global Enteral Infusion Pump Volume K Forecast, by Types 2019 & 2032
- Table 79: Global Enteral Infusion Pump Revenue million Forecast, by Country 2019 & 2032
- Table 80: Global Enteral Infusion Pump Volume K Forecast, by Country 2019 & 2032
- Table 81: China Enteral Infusion Pump Revenue (million) Forecast, by Application 2019 & 2032
- Table 82: China Enteral Infusion Pump Volume (K) Forecast, by Application 2019 & 2032
- Table 83: India Enteral Infusion Pump Revenue (million) Forecast, by Application 2019 & 2032
- Table 84: India Enteral Infusion Pump Volume (K) Forecast, by Application 2019 & 2032
- Table 85: Japan Enteral Infusion Pump Revenue (million) Forecast, by Application 2019 & 2032
- Table 86: Japan Enteral Infusion Pump Volume (K) Forecast, by Application 2019 & 2032
- Table 87: South Korea Enteral Infusion Pump Revenue (million) Forecast, by Application 2019 & 2032
- Table 88: South Korea Enteral Infusion Pump Volume (K) Forecast, by Application 2019 & 2032
- Table 89: ASEAN Enteral Infusion Pump Revenue (million) Forecast, by Application 2019 & 2032
- Table 90: ASEAN Enteral Infusion Pump Volume (K) Forecast, by Application 2019 & 2032
- Table 91: Oceania Enteral Infusion Pump Revenue (million) Forecast, by Application 2019 & 2032
- Table 92: Oceania Enteral Infusion Pump Volume (K) Forecast, by Application 2019 & 2032
- Table 93: Rest of Asia Pacific Enteral Infusion Pump Revenue (million) Forecast, by Application 2019 & 2032
- Table 94: Rest of Asia Pacific Enteral Infusion Pump Volume (K) Forecast, by Application 2019 & 2032
Frequently Asked Questions
1. What is the projected Compound Annual Growth Rate (CAGR) of the Enteral Infusion Pump?
The projected CAGR is approximately XX%.
2. Which companies are prominent players in the Enteral Infusion Pump?
Key companies in the market include Abbott Laboratories, Fresenius, Baxter International, BD, ICU Medical, ACE Medical, B.Braun, Medtronic, Apon Medical, Mindray, HENAN TUOREN MEDICAL DEVICE, Royal Fornia Medical Equipment.
3. What are the main segments of the Enteral Infusion Pump?
The market segments include Application, Types.
4. Can you provide details about the market size?
The market size is estimated to be USD XXX million as of 2022.
5. What are some drivers contributing to market growth?
N/A
6. What are the notable trends driving market growth?
N/A
7. Are there any restraints impacting market growth?
N/A
8. Can you provide examples of recent developments in the market?
N/A
9. What pricing options are available for accessing the report?
Pricing options include single-user, multi-user, and enterprise licenses priced at USD 4350.00, USD 6525.00, and USD 8700.00 respectively.
10. Is the market size provided in terms of value or volume?
The market size is provided in terms of value, measured in million and volume, measured in K.
11. Are there any specific market keywords associated with the report?
Yes, the market keyword associated with the report is "Enteral Infusion Pump," which aids in identifying and referencing the specific market segment covered.
12. How do I determine which pricing option suits my needs best?
The pricing options vary based on user requirements and access needs. Individual users may opt for single-user licenses, while businesses requiring broader access may choose multi-user or enterprise licenses for cost-effective access to the report.
13. Are there any additional resources or data provided in the Enteral Infusion Pump report?
While the report offers comprehensive insights, it's advisable to review the specific contents or supplementary materials provided to ascertain if additional resources or data are available.
14. How can I stay updated on further developments or reports in the Enteral Infusion Pump?
To stay informed about further developments, trends, and reports in the Enteral Infusion Pump, consider subscribing to industry newsletters, following relevant companies and organizations, or regularly checking reputable industry news sources and publications.
Methodology
Step 1 - Identification of Relevant Samples Size from Population Database


Step 2 - Approaches for Defining Global Market Size (Value, Volume* & Price*)

Note*: In applicable scenarios
Step 3 - Data Sources
Primary Research
- Web Analytics
- Survey Reports
- Research Institute
- Latest Research Reports
- Opinion Leaders
Secondary Research
- Annual Reports
- White Paper
- Latest Press Release
- Industry Association
- Paid Database
- Investor Presentations

Step 4 - Data Triangulation
Involves using different sources of information in order to increase the validity of a study
These sources are likely to be stakeholders in a program - participants, other researchers, program staff, other community members, and so on.
Then we put all data in single framework & apply various statistical tools to find out the dynamic on the market.
During the analysis stage, feedback from the stakeholder groups would be compared to determine areas of agreement as well as areas of divergence
