

Key Insights
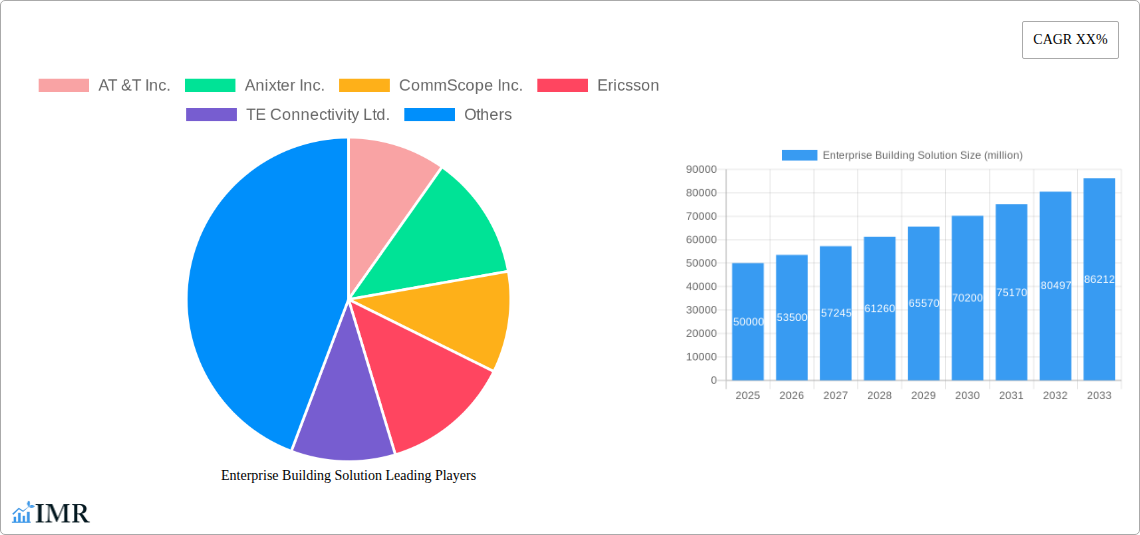
The Enterprise Building Solutions market is experiencing robust growth, driven by the increasing adoption of smart building technologies, the expanding need for enhanced security systems, and the rising demand for improved workplace efficiency. The market's value is estimated to be around $50 billion in 2025, with a Compound Annual Growth Rate (CAGR) of approximately 7% projected from 2025 to 2033. This growth is fueled by several key factors: the widespread deployment of Internet of Things (IoT) devices for building automation and data analytics; a heightened focus on energy efficiency and sustainability initiatives; and the ongoing evolution of cloud-based building management systems. Significant investments in infrastructure modernization across various sectors, including commercial real estate and healthcare, further contribute to this market expansion. The market is segmented by solution type (e.g., access control, security, HVAC, lighting), deployment type (on-premise, cloud), and end-user industry (e.g., corporate offices, healthcare facilities, educational institutions). Major players, including AT&T, Cisco, Honeywell, and others, are continuously innovating and expanding their product portfolios to capitalize on this expanding market.
However, the market is not without its challenges. One significant restraint is the high initial investment costs associated with implementing advanced building solutions. Furthermore, the integration of diverse systems from multiple vendors can present complexities, leading to interoperability issues and increasing deployment timelines. Concerns regarding data security and privacy within connected building systems also pose a potential barrier to adoption. Despite these challenges, the long-term outlook for the Enterprise Building Solutions market remains positive, driven by continuous technological advancements, growing awareness of operational efficiency gains, and the increasing demand for intelligent and sustainable buildings. The competitive landscape is characterized by both established players and emerging technology companies, leading to a dynamic market environment.
Enterprise Building Solution Market Report: 2019-2033
This comprehensive report provides an in-depth analysis of the Enterprise Building Solution market, encompassing market dynamics, growth trends, regional insights, product landscape, key players, and future outlook. The study period covers 2019-2033, with 2025 as the base and estimated year. The forecast period spans 2025-2033, and the historical period encompasses 2019-2024. This report is essential for industry professionals, investors, and strategists seeking to understand and capitalize on the opportunities within this dynamic market. The total market size in 2025 is estimated at $XX billion.
Enterprise Building Solution Market Dynamics & Structure
This section analyzes the competitive landscape of the Enterprise Building Solution market, examining market concentration, technological innovation, regulatory frameworks, competitive substitutes, and M&A trends. The parent market is the broader building solutions market, while the child market focuses specifically on enterprise-level solutions.
- Market Concentration: The market is moderately concentrated, with a few dominant players like Cisco, Huawei, and CommScope holding significant market share (estimated at xx% combined in 2025). However, numerous smaller players contribute significantly to the overall market activity.
- Technological Innovation: Key drivers include advancements in IoT, AI, cloud computing, and 5G technologies, leading to the development of smart building solutions and improved network infrastructure. Innovation barriers include high R&D costs and the need for interoperability standards.
- Regulatory Frameworks: Government regulations related to building codes, data privacy, and cybersecurity significantly impact the market, influencing product development and deployment.
- Competitive Product Substitutes: Alternative solutions, such as traditional wired networks, present competition, although the advantages of enterprise-grade wireless and integrated systems are driving market growth.
- End-User Demographics: Large enterprises, government agencies, and educational institutions represent the primary end-users. The increasing demand for enhanced security, scalability, and efficiency fuels market growth.
- M&A Trends: The market has witnessed a significant number of mergers and acquisitions (xx deals in the past 5 years) with larger players acquiring smaller companies to expand their product portfolios and market reach.
Enterprise Building Solution Growth Trends & Insights
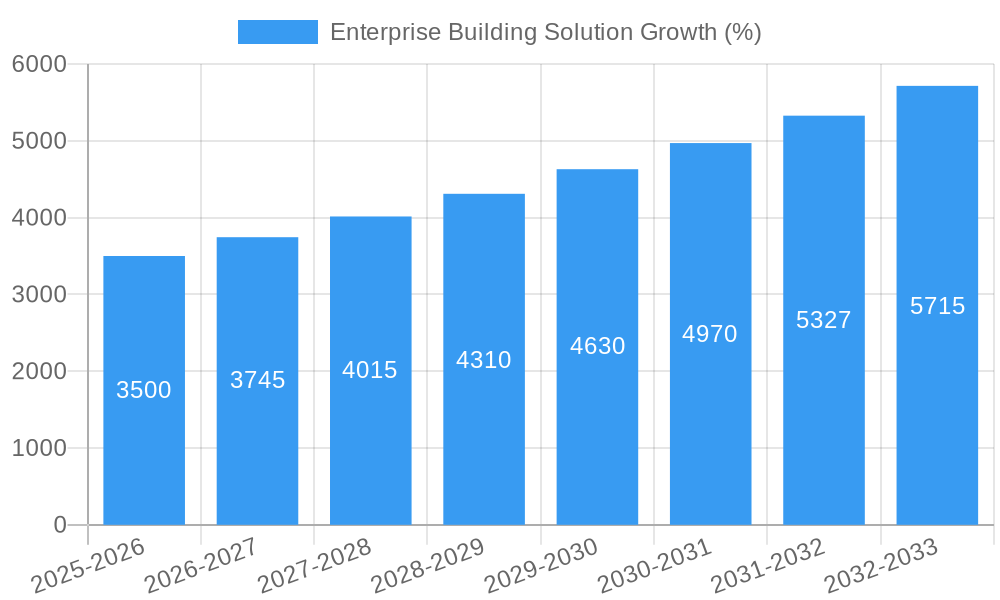
The Enterprise Building Solution market has experienced robust growth over the historical period, driven by technological advancements and increasing demand for smart building solutions. The market size is projected to reach $XX billion by 2033, exhibiting a Compound Annual Growth Rate (CAGR) of xx% during the forecast period. This growth is attributed to several factors, including:
- Rising adoption of cloud-based solutions for improved data management and remote access.
- Increased investment in smart building infrastructure across various sectors.
- Growing demand for enhanced security and network management features.
- Expansion of 5G networks, facilitating seamless connectivity and high-speed data transfer.
- Increased focus on energy efficiency and sustainability in building design and operations.
Market penetration is expected to increase from xx% in 2025 to xx% by 2033, reflecting the growing adoption of enterprise building solutions across different industries and geographical regions. The shift towards hybrid work models has also accelerated the demand for secure and reliable network solutions, contributing to the market's overall growth.
Dominant Regions, Countries, or Segments in Enterprise Building Solution
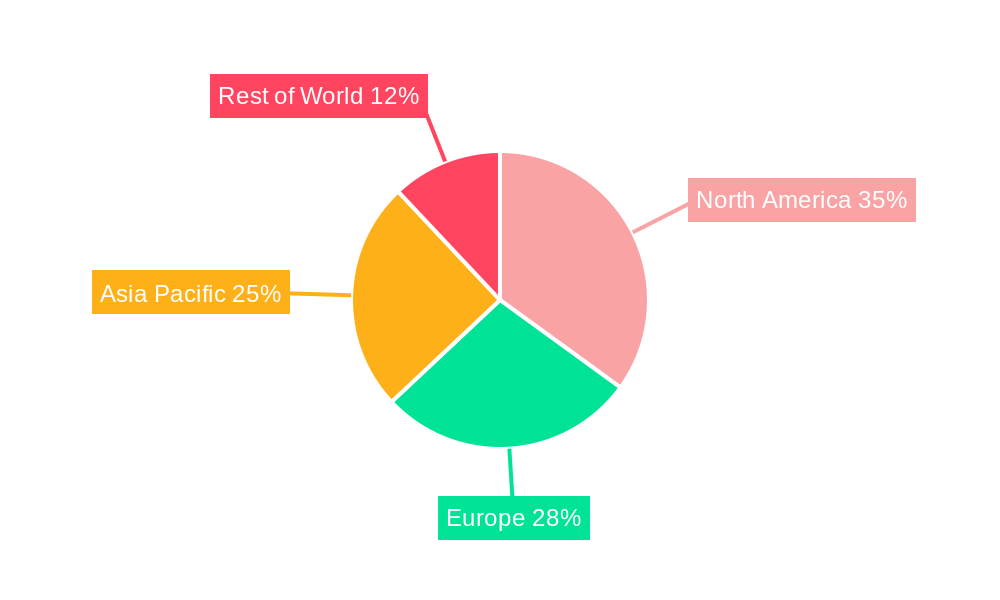
North America currently holds the largest market share (xx%) in the Enterprise Building Solution market, driven by strong technological advancements, robust infrastructure investments, and high adoption rates among large enterprises. Europe follows with a market share of xx%, while Asia Pacific is poised for rapid growth in the coming years, fueled by expanding urbanization and increasing government investments in smart city initiatives.
- Key Drivers in North America: Strong R&D investments, early adoption of new technologies, and a highly developed IT infrastructure.
- Key Drivers in Europe: Stringent data privacy regulations driving secure solutions demand, and government initiatives supporting digital transformation.
- Key Drivers in Asia Pacific: Rapid urbanization, increasing infrastructure spending, and growing demand for advanced connectivity solutions.
Growth potential is high in developing economies, offering significant opportunities for market expansion and new player entry. The segments showing the highest growth are those incorporating IoT sensors and data analytics for enhanced building management and improved operational efficiency.
Enterprise Building Solution Product Landscape
The Enterprise Building Solution market offers a wide range of products, including wired and wireless networking equipment, security systems, building management systems (BMS), and various software solutions for network monitoring, control, and data analytics. Recent innovations focus on integrating these systems into unified platforms, enhancing interoperability and streamlining management. Products are differentiated based on scalability, security features, ease of management, and energy efficiency. Key features include advanced security protocols, cloud-based management interfaces, and AI-powered analytics for optimized resource utilization.
Key Drivers, Barriers & Challenges in Enterprise Building Solution
Key Drivers:
- Technological advancements in networking, security, and building management systems.
- Growing demand for smart building solutions to improve operational efficiency and sustainability.
- Increasing adoption of cloud-based solutions for enhanced data management and accessibility.
- Government initiatives supporting smart city development and digital transformation.
Key Challenges:
- High initial investment costs associated with implementation and upgrades.
- Complexity in integrating different systems and ensuring interoperability.
- Cybersecurity threats and vulnerabilities require robust security measures.
- The need for skilled professionals to manage and maintain complex systems. This shortage limits implementation and efficient operation.
Emerging Opportunities in Enterprise Building Solution
Emerging opportunities lie in integrating emerging technologies like AI, machine learning, and blockchain for enhanced security, predictive maintenance, and optimized energy management. The development of low-power wide-area network (LPWAN) technologies opens new possibilities for connecting a broader range of devices in buildings. Untapped markets in developing countries and niche applications in specialized sectors, such as healthcare and manufacturing, offer significant potential for growth.
Growth Accelerators in the Enterprise Building Solution Industry
Strategic partnerships between technology providers and building contractors are accelerating market growth by fostering collaboration and streamlining the integration process. Increased government funding for smart city initiatives and infrastructure development further fuels adoption. Technological breakthroughs in areas such as edge computing and advanced sensor technologies will create new possibilities for enhancing building efficiency and security.
Key Players Shaping the Enterprise Building Solution Market
- AT&T Inc.
- Anixter Inc.
- CommScope Inc.
- Ericsson
- TE Connectivity Ltd.
- Alcatel-Lucent
- Cobham PLC
- Corning Incorporated
- Smiths Group PLC
- Verizon Communications Inc.
- Honeywell International Inc.
- Cisco Systems Inc.
- Acuity Brands Inc.
- Robert Bosch GmbH
- Chemring Group PLC
- Ubiquiti Networks
- D-Link
- Extreme
- Fortinet
- Huawei
- NETGEAR
- T-Mobile
- CenturyLink
- American Tower
- Black Box Corporation
- Cox Communication
Notable Milestones in Enterprise Building Solution Sector
- 2020: Increased adoption of remote working solutions due to the COVID-19 pandemic.
- 2021: Significant investments in 5G infrastructure development globally.
- 2022: Launch of several new building management systems with integrated AI capabilities.
- 2023: Increased focus on cybersecurity and data privacy regulations within the industry.
In-Depth Enterprise Building Solution Market Outlook
The Enterprise Building Solution market is poised for continued strong growth, driven by technological advancements, increasing digitalization, and the growing need for efficient, secure, and sustainable building operations. The long-term outlook is positive, with significant opportunities for innovation and market expansion. Strategic partnerships, investments in R&D, and the development of new applications will continue to drive growth throughout the forecast period. The convergence of technologies, such as IoT, AI, and 5G, will create new possibilities for creating truly intelligent and interconnected building environments.
Enterprise Building Solution Segmentation
-
1. Application
- 1.1. Residential
- 1.2. Commercial
-
2. Types
- 2.1. Cloud
- 2.2. On-premise
Enterprise Building Solution Segmentation By Geography
-
1. North America
- 1.1. United States
- 1.2. Canada
- 1.3. Mexico
-
2. South America
- 2.1. Brazil
- 2.2. Argentina
- 2.3. Rest of South America
-
3. Europe
- 3.1. United Kingdom
- 3.2. Germany
- 3.3. France
- 3.4. Italy
- 3.5. Spain
- 3.6. Russia
- 3.7. Benelux
- 3.8. Nordics
- 3.9. Rest of Europe
-
4. Middle East & Africa
- 4.1. Turkey
- 4.2. Israel
- 4.3. GCC
- 4.4. North Africa
- 4.5. South Africa
- 4.6. Rest of Middle East & Africa
-
5. Asia Pacific
- 5.1. China
- 5.2. India
- 5.3. Japan
- 5.4. South Korea
- 5.5. ASEAN
- 5.6. Oceania
- 5.7. Rest of Asia Pacific
Enterprise Building Solution REPORT HIGHLIGHTS
| Aspects | Details |
|---|---|
| Study Period | 2019-2033 |
| Base Year | 2024 |
| Estimated Year | 2025 |
| Forecast Period | 2025-2033 |
| Historical Period | 2019-2024 |
| Growth Rate | CAGR of XX% from 2019-2033 |
| Segmentation |
|
Table of Contents
- 1. Introduction
- 1.1. Research Scope
- 1.2. Market Segmentation
- 1.3. Research Methodology
- 1.4. Definitions and Assumptions
- 2. Executive Summary
- 2.1. Introduction
- 3. Market Dynamics
- 3.1. Introduction
- 3.2. Market Drivers
- 3.3. Market Restrains
- 3.4. Market Trends
- 4. Market Factor Analysis
- 4.1. Porters Five Forces
- 4.2. Supply/Value Chain
- 4.3. PESTEL analysis
- 4.4. Market Entropy
- 4.5. Patent/Trademark Analysis
- 5. Global Enterprise Building Solution Analysis, Insights and Forecast, 2019-2031
- 5.1. Market Analysis, Insights and Forecast - by Application
- 5.1.1. Residential
- 5.1.2. Commercial
- 5.2. Market Analysis, Insights and Forecast - by Types
- 5.2.1. Cloud
- 5.2.2. On-premise
- 5.3. Market Analysis, Insights and Forecast - by Region
- 5.3.1. North America
- 5.3.2. South America
- 5.3.3. Europe
- 5.3.4. Middle East & Africa
- 5.3.5. Asia Pacific
- 5.1. Market Analysis, Insights and Forecast - by Application
- 6. North America Enterprise Building Solution Analysis, Insights and Forecast, 2019-2031
- 6.1. Market Analysis, Insights and Forecast - by Application
- 6.1.1. Residential
- 6.1.2. Commercial
- 6.2. Market Analysis, Insights and Forecast - by Types
- 6.2.1. Cloud
- 6.2.2. On-premise
- 6.1. Market Analysis, Insights and Forecast - by Application
- 7. South America Enterprise Building Solution Analysis, Insights and Forecast, 2019-2031
- 7.1. Market Analysis, Insights and Forecast - by Application
- 7.1.1. Residential
- 7.1.2. Commercial
- 7.2. Market Analysis, Insights and Forecast - by Types
- 7.2.1. Cloud
- 7.2.2. On-premise
- 7.1. Market Analysis, Insights and Forecast - by Application
- 8. Europe Enterprise Building Solution Analysis, Insights and Forecast, 2019-2031
- 8.1. Market Analysis, Insights and Forecast - by Application
- 8.1.1. Residential
- 8.1.2. Commercial
- 8.2. Market Analysis, Insights and Forecast - by Types
- 8.2.1. Cloud
- 8.2.2. On-premise
- 8.1. Market Analysis, Insights and Forecast - by Application
- 9. Middle East & Africa Enterprise Building Solution Analysis, Insights and Forecast, 2019-2031
- 9.1. Market Analysis, Insights and Forecast - by Application
- 9.1.1. Residential
- 9.1.2. Commercial
- 9.2. Market Analysis, Insights and Forecast - by Types
- 9.2.1. Cloud
- 9.2.2. On-premise
- 9.1. Market Analysis, Insights and Forecast - by Application
- 10. Asia Pacific Enterprise Building Solution Analysis, Insights and Forecast, 2019-2031
- 10.1. Market Analysis, Insights and Forecast - by Application
- 10.1.1. Residential
- 10.1.2. Commercial
- 10.2. Market Analysis, Insights and Forecast - by Types
- 10.2.1. Cloud
- 10.2.2. On-premise
- 10.1. Market Analysis, Insights and Forecast - by Application
- 11. Competitive Analysis
- 11.1. Global Market Share Analysis 2024
- 11.2. Company Profiles
- 11.2.1 AT &T Inc.
- 11.2.1.1. Overview
- 11.2.1.2. Products
- 11.2.1.3. SWOT Analysis
- 11.2.1.4. Recent Developments
- 11.2.1.5. Financials (Based on Availability)
- 11.2.2 Anixter Inc.
- 11.2.2.1. Overview
- 11.2.2.2. Products
- 11.2.2.3. SWOT Analysis
- 11.2.2.4. Recent Developments
- 11.2.2.5. Financials (Based on Availability)
- 11.2.3 CommScope Inc.
- 11.2.3.1. Overview
- 11.2.3.2. Products
- 11.2.3.3. SWOT Analysis
- 11.2.3.4. Recent Developments
- 11.2.3.5. Financials (Based on Availability)
- 11.2.4 Ericsson
- 11.2.4.1. Overview
- 11.2.4.2. Products
- 11.2.4.3. SWOT Analysis
- 11.2.4.4. Recent Developments
- 11.2.4.5. Financials (Based on Availability)
- 11.2.5 TE Connectivity Ltd.
- 11.2.5.1. Overview
- 11.2.5.2. Products
- 11.2.5.3. SWOT Analysis
- 11.2.5.4. Recent Developments
- 11.2.5.5. Financials (Based on Availability)
- 11.2.6 Alcatel-Lucent
- 11.2.6.1. Overview
- 11.2.6.2. Products
- 11.2.6.3. SWOT Analysis
- 11.2.6.4. Recent Developments
- 11.2.6.5. Financials (Based on Availability)
- 11.2.7 Cobham PLC
- 11.2.7.1. Overview
- 11.2.7.2. Products
- 11.2.7.3. SWOT Analysis
- 11.2.7.4. Recent Developments
- 11.2.7.5. Financials (Based on Availability)
- 11.2.8 Corning Incorporated
- 11.2.8.1. Overview
- 11.2.8.2. Products
- 11.2.8.3. SWOT Analysis
- 11.2.8.4. Recent Developments
- 11.2.8.5. Financials (Based on Availability)
- 11.2.9 Smiths Group PLC
- 11.2.9.1. Overview
- 11.2.9.2. Products
- 11.2.9.3. SWOT Analysis
- 11.2.9.4. Recent Developments
- 11.2.9.5. Financials (Based on Availability)
- 11.2.10 Verizon Communications Inc.
- 11.2.10.1. Overview
- 11.2.10.2. Products
- 11.2.10.3. SWOT Analysis
- 11.2.10.4. Recent Developments
- 11.2.10.5. Financials (Based on Availability)
- 11.2.11 Honeywell International Inc.
- 11.2.11.1. Overview
- 11.2.11.2. Products
- 11.2.11.3. SWOT Analysis
- 11.2.11.4. Recent Developments
- 11.2.11.5. Financials (Based on Availability)
- 11.2.12 Cisco Systems Inc.
- 11.2.12.1. Overview
- 11.2.12.2. Products
- 11.2.12.3. SWOT Analysis
- 11.2.12.4. Recent Developments
- 11.2.12.5. Financials (Based on Availability)
- 11.2.13 Acuity Brands Inc.
- 11.2.13.1. Overview
- 11.2.13.2. Products
- 11.2.13.3. SWOT Analysis
- 11.2.13.4. Recent Developments
- 11.2.13.5. Financials (Based on Availability)
- 11.2.14 Robert Bosch GmbH
- 11.2.14.1. Overview
- 11.2.14.2. Products
- 11.2.14.3. SWOT Analysis
- 11.2.14.4. Recent Developments
- 11.2.14.5. Financials (Based on Availability)
- 11.2.15 Chemring Group
- 11.2.15.1. Overview
- 11.2.15.2. Products
- 11.2.15.3. SWOT Analysis
- 11.2.15.4. Recent Developments
- 11.2.15.5. Financials (Based on Availability)
- 11.2.16 PLC
- 11.2.16.1. Overview
- 11.2.16.2. Products
- 11.2.16.3. SWOT Analysis
- 11.2.16.4. Recent Developments
- 11.2.16.5. Financials (Based on Availability)
- 11.2.17 Cisco
- 11.2.17.1. Overview
- 11.2.17.2. Products
- 11.2.17.3. SWOT Analysis
- 11.2.17.4. Recent Developments
- 11.2.17.5. Financials (Based on Availability)
- 11.2.18 Ubiquiti Networks
- 11.2.18.1. Overview
- 11.2.18.2. Products
- 11.2.18.3. SWOT Analysis
- 11.2.18.4. Recent Developments
- 11.2.18.5. Financials (Based on Availability)
- 11.2.19 D-Link
- 11.2.19.1. Overview
- 11.2.19.2. Products
- 11.2.19.3. SWOT Analysis
- 11.2.19.4. Recent Developments
- 11.2.19.5. Financials (Based on Availability)
- 11.2.20 Extreme
- 11.2.20.1. Overview
- 11.2.20.2. Products
- 11.2.20.3. SWOT Analysis
- 11.2.20.4. Recent Developments
- 11.2.20.5. Financials (Based on Availability)
- 11.2.21 Fortinet
- 11.2.21.1. Overview
- 11.2.21.2. Products
- 11.2.21.3. SWOT Analysis
- 11.2.21.4. Recent Developments
- 11.2.21.5. Financials (Based on Availability)
- 11.2.22 Huawei
- 11.2.22.1. Overview
- 11.2.22.2. Products
- 11.2.22.3. SWOT Analysis
- 11.2.22.4. Recent Developments
- 11.2.22.5. Financials (Based on Availability)
- 11.2.23 NETGEAR
- 11.2.23.1. Overview
- 11.2.23.2. Products
- 11.2.23.3. SWOT Analysis
- 11.2.23.4. Recent Developments
- 11.2.23.5. Financials (Based on Availability)
- 11.2.24 T-Mobile
- 11.2.24.1. Overview
- 11.2.24.2. Products
- 11.2.24.3. SWOT Analysis
- 11.2.24.4. Recent Developments
- 11.2.24.5. Financials (Based on Availability)
- 11.2.25 CenturyLink
- 11.2.25.1. Overview
- 11.2.25.2. Products
- 11.2.25.3. SWOT Analysis
- 11.2.25.4. Recent Developments
- 11.2.25.5. Financials (Based on Availability)
- 11.2.26 American Tower
- 11.2.26.1. Overview
- 11.2.26.2. Products
- 11.2.26.3. SWOT Analysis
- 11.2.26.4. Recent Developments
- 11.2.26.5. Financials (Based on Availability)
- 11.2.27 Black Box Corporation
- 11.2.27.1. Overview
- 11.2.27.2. Products
- 11.2.27.3. SWOT Analysis
- 11.2.27.4. Recent Developments
- 11.2.27.5. Financials (Based on Availability)
- 11.2.28 Cox Communication
- 11.2.28.1. Overview
- 11.2.28.2. Products
- 11.2.28.3. SWOT Analysis
- 11.2.28.4. Recent Developments
- 11.2.28.5. Financials (Based on Availability)
- 11.2.1 AT &T Inc.
List of Figures
- Figure 1: Global Enterprise Building Solution Revenue Breakdown (million, %) by Region 2024 & 2032
- Figure 2: North America Enterprise Building Solution Revenue (million), by Application 2024 & 2032
- Figure 3: North America Enterprise Building Solution Revenue Share (%), by Application 2024 & 2032
- Figure 4: North America Enterprise Building Solution Revenue (million), by Types 2024 & 2032
- Figure 5: North America Enterprise Building Solution Revenue Share (%), by Types 2024 & 2032
- Figure 6: North America Enterprise Building Solution Revenue (million), by Country 2024 & 2032
- Figure 7: North America Enterprise Building Solution Revenue Share (%), by Country 2024 & 2032
- Figure 8: South America Enterprise Building Solution Revenue (million), by Application 2024 & 2032
- Figure 9: South America Enterprise Building Solution Revenue Share (%), by Application 2024 & 2032
- Figure 10: South America Enterprise Building Solution Revenue (million), by Types 2024 & 2032
- Figure 11: South America Enterprise Building Solution Revenue Share (%), by Types 2024 & 2032
- Figure 12: South America Enterprise Building Solution Revenue (million), by Country 2024 & 2032
- Figure 13: South America Enterprise Building Solution Revenue Share (%), by Country 2024 & 2032
- Figure 14: Europe Enterprise Building Solution Revenue (million), by Application 2024 & 2032
- Figure 15: Europe Enterprise Building Solution Revenue Share (%), by Application 2024 & 2032
- Figure 16: Europe Enterprise Building Solution Revenue (million), by Types 2024 & 2032
- Figure 17: Europe Enterprise Building Solution Revenue Share (%), by Types 2024 & 2032
- Figure 18: Europe Enterprise Building Solution Revenue (million), by Country 2024 & 2032
- Figure 19: Europe Enterprise Building Solution Revenue Share (%), by Country 2024 & 2032
- Figure 20: Middle East & Africa Enterprise Building Solution Revenue (million), by Application 2024 & 2032
- Figure 21: Middle East & Africa Enterprise Building Solution Revenue Share (%), by Application 2024 & 2032
- Figure 22: Middle East & Africa Enterprise Building Solution Revenue (million), by Types 2024 & 2032
- Figure 23: Middle East & Africa Enterprise Building Solution Revenue Share (%), by Types 2024 & 2032
- Figure 24: Middle East & Africa Enterprise Building Solution Revenue (million), by Country 2024 & 2032
- Figure 25: Middle East & Africa Enterprise Building Solution Revenue Share (%), by Country 2024 & 2032
- Figure 26: Asia Pacific Enterprise Building Solution Revenue (million), by Application 2024 & 2032
- Figure 27: Asia Pacific Enterprise Building Solution Revenue Share (%), by Application 2024 & 2032
- Figure 28: Asia Pacific Enterprise Building Solution Revenue (million), by Types 2024 & 2032
- Figure 29: Asia Pacific Enterprise Building Solution Revenue Share (%), by Types 2024 & 2032
- Figure 30: Asia Pacific Enterprise Building Solution Revenue (million), by Country 2024 & 2032
- Figure 31: Asia Pacific Enterprise Building Solution Revenue Share (%), by Country 2024 & 2032
List of Tables
- Table 1: Global Enterprise Building Solution Revenue million Forecast, by Region 2019 & 2032
- Table 2: Global Enterprise Building Solution Revenue million Forecast, by Application 2019 & 2032
- Table 3: Global Enterprise Building Solution Revenue million Forecast, by Types 2019 & 2032
- Table 4: Global Enterprise Building Solution Revenue million Forecast, by Region 2019 & 2032
- Table 5: Global Enterprise Building Solution Revenue million Forecast, by Application 2019 & 2032
- Table 6: Global Enterprise Building Solution Revenue million Forecast, by Types 2019 & 2032
- Table 7: Global Enterprise Building Solution Revenue million Forecast, by Country 2019 & 2032
- Table 8: United States Enterprise Building Solution Revenue (million) Forecast, by Application 2019 & 2032
- Table 9: Canada Enterprise Building Solution Revenue (million) Forecast, by Application 2019 & 2032
- Table 10: Mexico Enterprise Building Solution Revenue (million) Forecast, by Application 2019 & 2032
- Table 11: Global Enterprise Building Solution Revenue million Forecast, by Application 2019 & 2032
- Table 12: Global Enterprise Building Solution Revenue million Forecast, by Types 2019 & 2032
- Table 13: Global Enterprise Building Solution Revenue million Forecast, by Country 2019 & 2032
- Table 14: Brazil Enterprise Building Solution Revenue (million) Forecast, by Application 2019 & 2032
- Table 15: Argentina Enterprise Building Solution Revenue (million) Forecast, by Application 2019 & 2032
- Table 16: Rest of South America Enterprise Building Solution Revenue (million) Forecast, by Application 2019 & 2032
- Table 17: Global Enterprise Building Solution Revenue million Forecast, by Application 2019 & 2032
- Table 18: Global Enterprise Building Solution Revenue million Forecast, by Types 2019 & 2032
- Table 19: Global Enterprise Building Solution Revenue million Forecast, by Country 2019 & 2032
- Table 20: United Kingdom Enterprise Building Solution Revenue (million) Forecast, by Application 2019 & 2032
- Table 21: Germany Enterprise Building Solution Revenue (million) Forecast, by Application 2019 & 2032
- Table 22: France Enterprise Building Solution Revenue (million) Forecast, by Application 2019 & 2032
- Table 23: Italy Enterprise Building Solution Revenue (million) Forecast, by Application 2019 & 2032
- Table 24: Spain Enterprise Building Solution Revenue (million) Forecast, by Application 2019 & 2032
- Table 25: Russia Enterprise Building Solution Revenue (million) Forecast, by Application 2019 & 2032
- Table 26: Benelux Enterprise Building Solution Revenue (million) Forecast, by Application 2019 & 2032
- Table 27: Nordics Enterprise Building Solution Revenue (million) Forecast, by Application 2019 & 2032
- Table 28: Rest of Europe Enterprise Building Solution Revenue (million) Forecast, by Application 2019 & 2032
- Table 29: Global Enterprise Building Solution Revenue million Forecast, by Application 2019 & 2032
- Table 30: Global Enterprise Building Solution Revenue million Forecast, by Types 2019 & 2032
- Table 31: Global Enterprise Building Solution Revenue million Forecast, by Country 2019 & 2032
- Table 32: Turkey Enterprise Building Solution Revenue (million) Forecast, by Application 2019 & 2032
- Table 33: Israel Enterprise Building Solution Revenue (million) Forecast, by Application 2019 & 2032
- Table 34: GCC Enterprise Building Solution Revenue (million) Forecast, by Application 2019 & 2032
- Table 35: North Africa Enterprise Building Solution Revenue (million) Forecast, by Application 2019 & 2032
- Table 36: South Africa Enterprise Building Solution Revenue (million) Forecast, by Application 2019 & 2032
- Table 37: Rest of Middle East & Africa Enterprise Building Solution Revenue (million) Forecast, by Application 2019 & 2032
- Table 38: Global Enterprise Building Solution Revenue million Forecast, by Application 2019 & 2032
- Table 39: Global Enterprise Building Solution Revenue million Forecast, by Types 2019 & 2032
- Table 40: Global Enterprise Building Solution Revenue million Forecast, by Country 2019 & 2032
- Table 41: China Enterprise Building Solution Revenue (million) Forecast, by Application 2019 & 2032
- Table 42: India Enterprise Building Solution Revenue (million) Forecast, by Application 2019 & 2032
- Table 43: Japan Enterprise Building Solution Revenue (million) Forecast, by Application 2019 & 2032
- Table 44: South Korea Enterprise Building Solution Revenue (million) Forecast, by Application 2019 & 2032
- Table 45: ASEAN Enterprise Building Solution Revenue (million) Forecast, by Application 2019 & 2032
- Table 46: Oceania Enterprise Building Solution Revenue (million) Forecast, by Application 2019 & 2032
- Table 47: Rest of Asia Pacific Enterprise Building Solution Revenue (million) Forecast, by Application 2019 & 2032
Frequently Asked Questions
1. What is the projected Compound Annual Growth Rate (CAGR) of the Enterprise Building Solution?
The projected CAGR is approximately XX%.
2. Which companies are prominent players in the Enterprise Building Solution?
Key companies in the market include AT &T Inc., Anixter Inc., CommScope Inc., Ericsson, TE Connectivity Ltd., Alcatel-Lucent, Cobham PLC, Corning Incorporated, Smiths Group PLC, Verizon Communications Inc., Honeywell International Inc., Cisco Systems Inc., Acuity Brands Inc., Robert Bosch GmbH, Chemring Group, PLC, Cisco, Ubiquiti Networks, D-Link, Extreme, Fortinet, Huawei, NETGEAR, T-Mobile, CenturyLink, American Tower, Black Box Corporation, Cox Communication.
3. What are the main segments of the Enterprise Building Solution?
The market segments include Application, Types.
4. Can you provide details about the market size?
The market size is estimated to be USD XXX million as of 2022.
5. What are some drivers contributing to market growth?
N/A
6. What are the notable trends driving market growth?
N/A
7. Are there any restraints impacting market growth?
N/A
8. Can you provide examples of recent developments in the market?
N/A
9. What pricing options are available for accessing the report?
Pricing options include single-user, multi-user, and enterprise licenses priced at USD 4900.00, USD 7350.00, and USD 9800.00 respectively.
10. Is the market size provided in terms of value or volume?
The market size is provided in terms of value, measured in million.
11. Are there any specific market keywords associated with the report?
Yes, the market keyword associated with the report is "Enterprise Building Solution," which aids in identifying and referencing the specific market segment covered.
12. How do I determine which pricing option suits my needs best?
The pricing options vary based on user requirements and access needs. Individual users may opt for single-user licenses, while businesses requiring broader access may choose multi-user or enterprise licenses for cost-effective access to the report.
13. Are there any additional resources or data provided in the Enterprise Building Solution report?
While the report offers comprehensive insights, it's advisable to review the specific contents or supplementary materials provided to ascertain if additional resources or data are available.
14. How can I stay updated on further developments or reports in the Enterprise Building Solution?
To stay informed about further developments, trends, and reports in the Enterprise Building Solution, consider subscribing to industry newsletters, following relevant companies and organizations, or regularly checking reputable industry news sources and publications.
Methodology
Step 1 - Identification of Relevant Samples Size from Population Database


Step 2 - Approaches for Defining Global Market Size (Value, Volume* & Price*)

Note*: In applicable scenarios
Step 3 - Data Sources
Primary Research
- Web Analytics
- Survey Reports
- Research Institute
- Latest Research Reports
- Opinion Leaders
Secondary Research
- Annual Reports
- White Paper
- Latest Press Release
- Industry Association
- Paid Database
- Investor Presentations

Step 4 - Data Triangulation
Involves using different sources of information in order to increase the validity of a study
These sources are likely to be stakeholders in a program - participants, other researchers, program staff, other community members, and so on.
Then we put all data in single framework & apply various statistical tools to find out the dynamic on the market.
During the analysis stage, feedback from the stakeholder groups would be compared to determine areas of agreement as well as areas of divergence
