

Key Insights
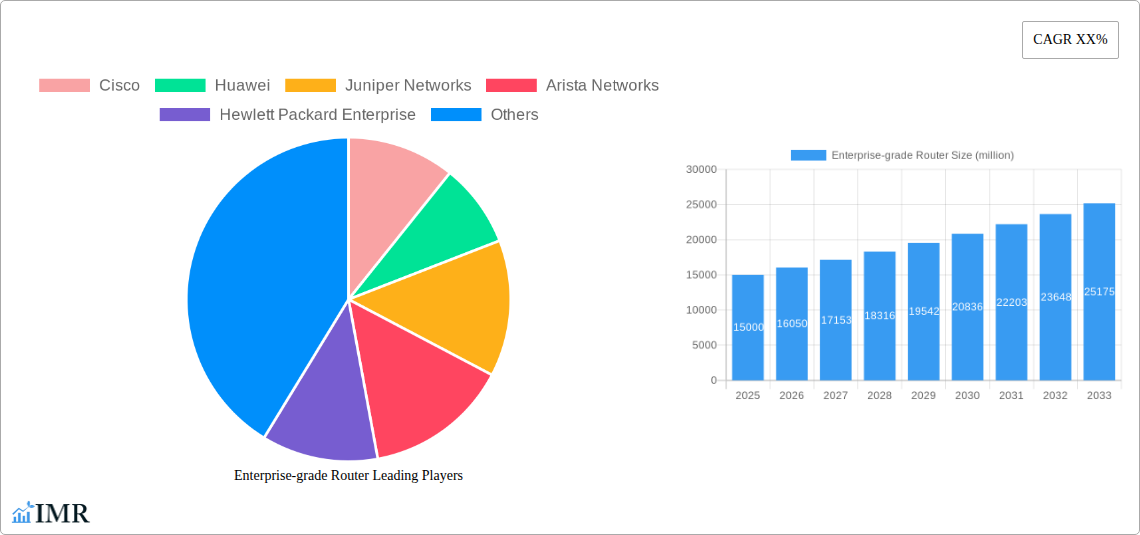
The enterprise-grade router market is experiencing robust growth, driven by the increasing adoption of cloud computing, the expansion of 5G networks, and the surge in demand for secure and high-performance networking solutions within businesses of all sizes. The market, estimated at $15 billion in 2025, is projected to exhibit a Compound Annual Growth Rate (CAGR) of 7% from 2025 to 2033, reaching an estimated $25 billion by 2033. This growth is fueled by several key trends, including the migration to software-defined networking (SDN) and network function virtualization (NFV), which offer greater flexibility and scalability. The increasing adoption of IoT devices and the demand for improved network security, especially with the rise in cyber threats, also contribute significantly to market expansion. Major players like Cisco, Huawei, and Juniper Networks are leading the charge, investing heavily in research and development to innovate and cater to evolving business needs.
However, certain restraints are impacting the market's trajectory. High initial investment costs associated with implementing and maintaining enterprise-grade routers can hinder adoption, especially for smaller businesses. Furthermore, the complexity of managing large and sophisticated networks poses a challenge, requiring specialized IT expertise. Competition among established players and emerging vendors is also fierce, impacting profit margins. Despite these challenges, the long-term outlook for the enterprise-grade router market remains positive, driven by the continued digital transformation across various industries and the increasing reliance on robust networking infrastructure. Segmentation within the market includes routers categorized by performance (e.g., high-end, mid-range, low-end), by technology (e.g., SDN-enabled, traditional), and by deployment (e.g., on-premise, cloud-based).
Enterprise-Grade Router Market Report: 2019-2033
This comprehensive report provides an in-depth analysis of the global enterprise-grade router market, encompassing market dynamics, growth trends, regional performance, competitive landscape, and future outlook. The study covers the period from 2019 to 2033, with a focus on the forecast period 2025-2033, using 2025 as the base year and estimated year. The report is essential for industry professionals, investors, and strategic decision-makers seeking to understand and capitalize on opportunities within this dynamic market. The market is segmented by various factors including but not limited to technology, application, end-user, and region.
Keywords: Enterprise-grade router, network router, networking equipment, WAN router, LAN router, Cisco, Huawei, Juniper Networks, Arista Networks, market analysis, market forecast, market size, market share, CAGR, growth drivers, market challenges, competitive landscape, industry trends, technological innovation, M&A activity, regional analysis, networking infrastructure, data center networking, cloud networking.
Enterprise-grade Router Market Dynamics & Structure
The enterprise-grade router market is characterized by a high degree of concentration, with a few major players controlling a significant portion of the market share. Cisco, Huawei, and Juniper Networks consistently hold leading positions, driven by their extensive product portfolios, strong brand recognition, and robust global distribution networks. Technological innovation, particularly in areas such as software-defined networking (SDN), network function virtualization (NFV), and 5G, is a major driver of market growth. However, regulatory frameworks, particularly concerning data security and privacy, pose significant challenges. The market also experiences competitive pressure from emerging players offering cost-effective alternatives. Mergers and acquisitions (M&A) activity remains moderate but strategic, enabling larger companies to expand their product offerings and market reach.
- Market Concentration: The top 5 players account for approximately xx% of the market in 2025 (estimated).
- Technological Innovation: SDN, NFV, and 5G are key drivers of innovation, fostering higher bandwidth and improved network management.
- Regulatory Framework: Compliance with data privacy regulations (e.g., GDPR) and cybersecurity standards (e.g., NIST) impacts product development and market access.
- Competitive Substitutes: Software-defined WAN (SD-WAN) solutions are emerging as alternatives, although they often complement rather than replace traditional routers.
- End-User Demographics: The primary end-users are large enterprises, telecommunication companies, government agencies, and cloud service providers.
- M&A Trends: The number of M&A deals in the enterprise-grade router sector averaged xx per year during the historical period (2019-2024), resulting in significant consolidation and market share shifts.
Enterprise-grade Router Growth Trends & Insights
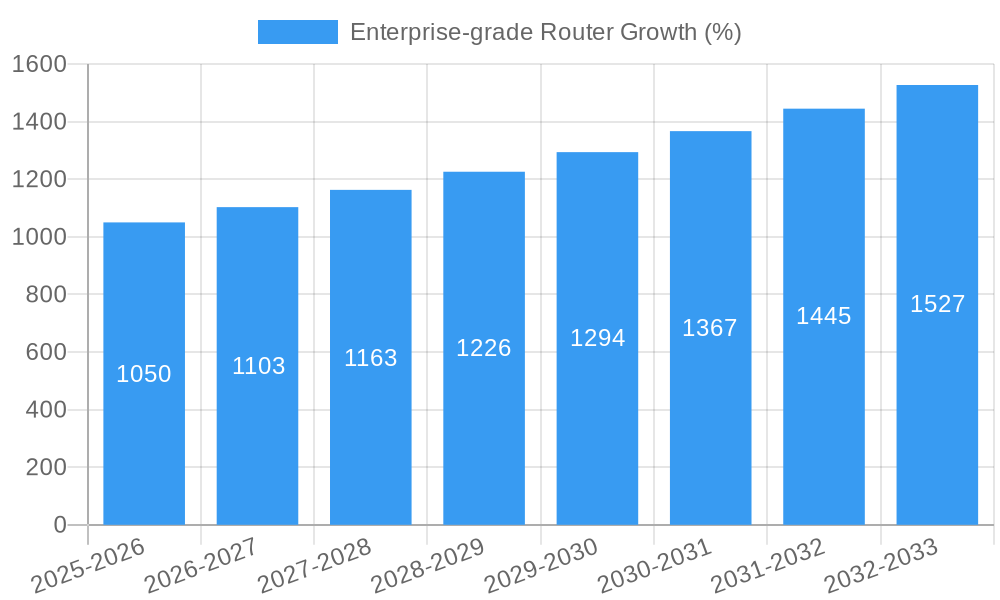
The enterprise-grade router market experienced robust growth during the historical period (2019-2024), driven by factors such as the increasing adoption of cloud computing, the expansion of 5G networks, and the growing demand for high-bandwidth, low-latency connectivity. Market size reached xx million units in 2024, with a compound annual growth rate (CAGR) of xx%. Technological disruptions, including the rise of SD-WAN and the integration of artificial intelligence (AI) into network management systems, have significantly impacted the market. The adoption of these technologies is expected to accelerate further in the forecast period (2025-2033), leading to continued market growth. Furthermore, changing consumer behavior, with a growing preference for remote work and increased reliance on digital services, is driving demand for robust and scalable network infrastructure, thereby fueling the adoption of advanced enterprise-grade routers.
Dominant Regions, Countries, or Segments in Enterprise-grade Router
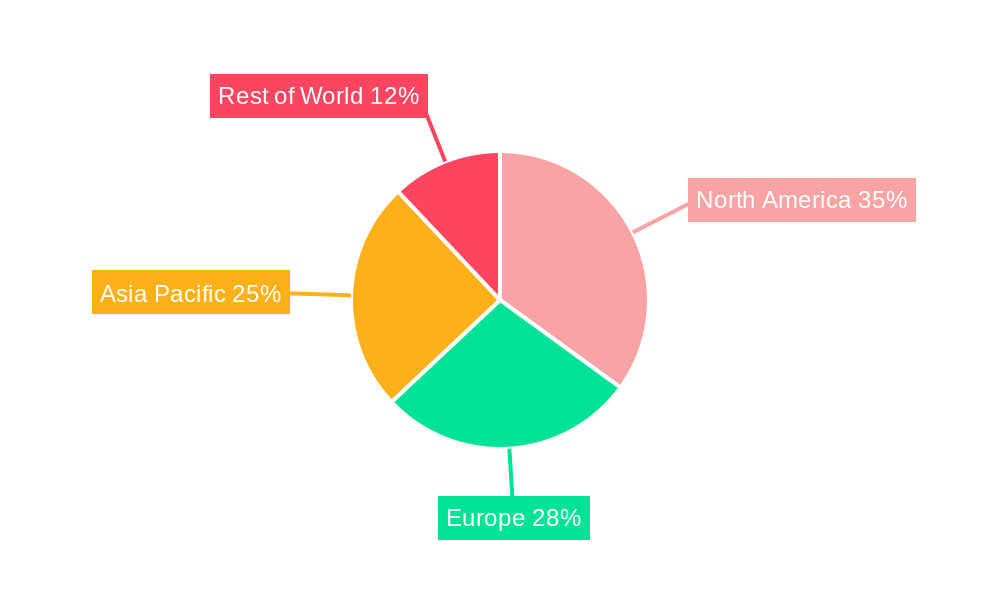
North America holds the largest market share in the enterprise-grade router market, driven by the presence of major technology companies, substantial investment in infrastructure development, and high levels of technological adoption. However, Asia-Pacific is projected to witness the highest growth rate in the forecast period, owing to rapid economic development, expanding digitalization efforts, and increasing government investments in network infrastructure.
- Key Drivers in North America: Strong presence of major vendors, high technological adoption rate, robust IT spending.
- Key Drivers in Asia-Pacific: Rapid economic growth, increasing urbanization, rising demand for digital services, and governmental initiatives promoting digital infrastructure development.
- Market Share: North America accounts for approximately xx% of the global market in 2025 (estimated), while Asia-Pacific is projected to reach xx% by 2033.
Enterprise-grade Router Product Landscape
The enterprise-grade router market offers a range of products catering to diverse network requirements, from small office/home office (SOHO) routers to high-capacity routers for large data centers. Key features include advanced routing protocols, robust security features (e.g., firewalls, intrusion detection/prevention systems), high bandwidth capacity, and Quality of Service (QoS) capabilities. Recent innovations include increased support for virtualization, software-defined networking (SDN), and integration with cloud-based management platforms. These advancements enhance network flexibility, scalability, and manageability, leading to improved overall network performance and efficiency.
Key Drivers, Barriers & Challenges in Enterprise-grade Router
Key Drivers: The increasing adoption of cloud computing, the expansion of 5G networks, and the growing demand for high-bandwidth, low-latency connectivity are major factors driving market growth. The need for enhanced network security and the rise of the Internet of Things (IoT) also contribute to the increased demand for sophisticated enterprise-grade routers.
Key Barriers and Challenges: Supply chain disruptions, especially concerning semiconductor components, can impact production capacity and lead to increased costs. Stringent regulatory compliance requirements, such as data privacy and cybersecurity standards, increase the cost and complexity of product development and deployment. Intense competition from established and emerging vendors can put downward pressure on prices and profitability.
Emerging Opportunities in Enterprise-grade Router
Emerging opportunities lie in the expansion of 5G network infrastructure, the growing adoption of SD-WAN technologies, and the increasing demand for secure and reliable network connectivity for IoT devices. The market for software-defined routers and routers integrated with AI-based network management systems presents significant growth potential. Untapped markets in developing economies also offer substantial opportunities for expansion.
Growth Accelerators in the Enterprise-grade Router Industry
Technological breakthroughs, especially in areas such as 5G, SDN, and AI-powered network management, significantly accelerate market growth. Strategic partnerships between router vendors and cloud service providers enable the integration of router solutions with cloud-based services, creating new opportunities. Expanding into untapped markets and developing innovative applications for specific industry verticals further accelerate growth.
Key Players Shaping the Enterprise-grade Router Market
- Cisco
- Huawei
- Juniper Networks
- Arista Networks
- Hewlett Packard Enterprise
- ZTE
- Cradlepoint
- Avaya
- Nokia
- Dell
- TP-Link
- Alcatel-Lucent
- D-Link
- NETGEAR
- ASUS
Notable Milestones in Enterprise-grade Router Sector
- 2020: Cisco launched its Catalyst 9000 series routers, emphasizing improved security and programmability.
- 2021: Juniper Networks announced its commitment to increased investment in 5G-ready routers.
- 2022: Huawei released its CloudEngine series of routers, promoting cloud-native capabilities.
- 2023: Several smaller acquisitions within the networking space occurred, consolidating market share.
- 2024: A significant increase in demand for SD-WAN solutions was observed, increasing pressure on traditional router vendors.
In-Depth Enterprise-grade Router Market Outlook
The enterprise-grade router market is poised for continued growth over the forecast period, driven by technological advancements, expanding digitalization, and rising demand for high-bandwidth network solutions. The adoption of innovative technologies, such as SD-WAN and AI-driven network management, is expected to transform the market landscape, presenting significant opportunities for vendors to develop and offer advanced solutions. Strategic partnerships, investments in research and development, and expansion into untapped markets will be crucial for success in this dynamic and evolving sector. The overall market presents a positive outlook with significant potential for growth and innovation.
Enterprise-grade Router Segmentation
-
1. Application
- 1.1. BFSI
- 1.2. IT and Telecom
- 1.3. Healthcare
- 1.4. Retail
- 1.5. Manufacturing
- 1.6. Others
-
2. Types
- 2.1. Wired Router
- 2.2. Wireless Router
Enterprise-grade Router Segmentation By Geography
-
1. North America
- 1.1. United States
- 1.2. Canada
- 1.3. Mexico
-
2. South America
- 2.1. Brazil
- 2.2. Argentina
- 2.3. Rest of South America
-
3. Europe
- 3.1. United Kingdom
- 3.2. Germany
- 3.3. France
- 3.4. Italy
- 3.5. Spain
- 3.6. Russia
- 3.7. Benelux
- 3.8. Nordics
- 3.9. Rest of Europe
-
4. Middle East & Africa
- 4.1. Turkey
- 4.2. Israel
- 4.3. GCC
- 4.4. North Africa
- 4.5. South Africa
- 4.6. Rest of Middle East & Africa
-
5. Asia Pacific
- 5.1. China
- 5.2. India
- 5.3. Japan
- 5.4. South Korea
- 5.5. ASEAN
- 5.6. Oceania
- 5.7. Rest of Asia Pacific
Enterprise-grade Router REPORT HIGHLIGHTS
| Aspects | Details |
|---|---|
| Study Period | 2019-2033 |
| Base Year | 2024 |
| Estimated Year | 2025 |
| Forecast Period | 2025-2033 |
| Historical Period | 2019-2024 |
| Growth Rate | CAGR of XX% from 2019-2033 |
| Segmentation |
|
Table of Contents
- 1. Introduction
- 1.1. Research Scope
- 1.2. Market Segmentation
- 1.3. Research Methodology
- 1.4. Definitions and Assumptions
- 2. Executive Summary
- 2.1. Introduction
- 3. Market Dynamics
- 3.1. Introduction
- 3.2. Market Drivers
- 3.3. Market Restrains
- 3.4. Market Trends
- 4. Market Factor Analysis
- 4.1. Porters Five Forces
- 4.2. Supply/Value Chain
- 4.3. PESTEL analysis
- 4.4. Market Entropy
- 4.5. Patent/Trademark Analysis
- 5. Global Enterprise-grade Router Analysis, Insights and Forecast, 2019-2031
- 5.1. Market Analysis, Insights and Forecast - by Application
- 5.1.1. BFSI
- 5.1.2. IT and Telecom
- 5.1.3. Healthcare
- 5.1.4. Retail
- 5.1.5. Manufacturing
- 5.1.6. Others
- 5.2. Market Analysis, Insights and Forecast - by Types
- 5.2.1. Wired Router
- 5.2.2. Wireless Router
- 5.3. Market Analysis, Insights and Forecast - by Region
- 5.3.1. North America
- 5.3.2. South America
- 5.3.3. Europe
- 5.3.4. Middle East & Africa
- 5.3.5. Asia Pacific
- 5.1. Market Analysis, Insights and Forecast - by Application
- 6. North America Enterprise-grade Router Analysis, Insights and Forecast, 2019-2031
- 6.1. Market Analysis, Insights and Forecast - by Application
- 6.1.1. BFSI
- 6.1.2. IT and Telecom
- 6.1.3. Healthcare
- 6.1.4. Retail
- 6.1.5. Manufacturing
- 6.1.6. Others
- 6.2. Market Analysis, Insights and Forecast - by Types
- 6.2.1. Wired Router
- 6.2.2. Wireless Router
- 6.1. Market Analysis, Insights and Forecast - by Application
- 7. South America Enterprise-grade Router Analysis, Insights and Forecast, 2019-2031
- 7.1. Market Analysis, Insights and Forecast - by Application
- 7.1.1. BFSI
- 7.1.2. IT and Telecom
- 7.1.3. Healthcare
- 7.1.4. Retail
- 7.1.5. Manufacturing
- 7.1.6. Others
- 7.2. Market Analysis, Insights and Forecast - by Types
- 7.2.1. Wired Router
- 7.2.2. Wireless Router
- 7.1. Market Analysis, Insights and Forecast - by Application
- 8. Europe Enterprise-grade Router Analysis, Insights and Forecast, 2019-2031
- 8.1. Market Analysis, Insights and Forecast - by Application
- 8.1.1. BFSI
- 8.1.2. IT and Telecom
- 8.1.3. Healthcare
- 8.1.4. Retail
- 8.1.5. Manufacturing
- 8.1.6. Others
- 8.2. Market Analysis, Insights and Forecast - by Types
- 8.2.1. Wired Router
- 8.2.2. Wireless Router
- 8.1. Market Analysis, Insights and Forecast - by Application
- 9. Middle East & Africa Enterprise-grade Router Analysis, Insights and Forecast, 2019-2031
- 9.1. Market Analysis, Insights and Forecast - by Application
- 9.1.1. BFSI
- 9.1.2. IT and Telecom
- 9.1.3. Healthcare
- 9.1.4. Retail
- 9.1.5. Manufacturing
- 9.1.6. Others
- 9.2. Market Analysis, Insights and Forecast - by Types
- 9.2.1. Wired Router
- 9.2.2. Wireless Router
- 9.1. Market Analysis, Insights and Forecast - by Application
- 10. Asia Pacific Enterprise-grade Router Analysis, Insights and Forecast, 2019-2031
- 10.1. Market Analysis, Insights and Forecast - by Application
- 10.1.1. BFSI
- 10.1.2. IT and Telecom
- 10.1.3. Healthcare
- 10.1.4. Retail
- 10.1.5. Manufacturing
- 10.1.6. Others
- 10.2. Market Analysis, Insights and Forecast - by Types
- 10.2.1. Wired Router
- 10.2.2. Wireless Router
- 10.1. Market Analysis, Insights and Forecast - by Application
- 11. Competitive Analysis
- 11.1. Global Market Share Analysis 2024
- 11.2. Company Profiles
- 11.2.1 Cisco
- 11.2.1.1. Overview
- 11.2.1.2. Products
- 11.2.1.3. SWOT Analysis
- 11.2.1.4. Recent Developments
- 11.2.1.5. Financials (Based on Availability)
- 11.2.2 Huawei
- 11.2.2.1. Overview
- 11.2.2.2. Products
- 11.2.2.3. SWOT Analysis
- 11.2.2.4. Recent Developments
- 11.2.2.5. Financials (Based on Availability)
- 11.2.3 Juniper Networks
- 11.2.3.1. Overview
- 11.2.3.2. Products
- 11.2.3.3. SWOT Analysis
- 11.2.3.4. Recent Developments
- 11.2.3.5. Financials (Based on Availability)
- 11.2.4 Arista Networks
- 11.2.4.1. Overview
- 11.2.4.2. Products
- 11.2.4.3. SWOT Analysis
- 11.2.4.4. Recent Developments
- 11.2.4.5. Financials (Based on Availability)
- 11.2.5 Hewlett Packard Enterprise
- 11.2.5.1. Overview
- 11.2.5.2. Products
- 11.2.5.3. SWOT Analysis
- 11.2.5.4. Recent Developments
- 11.2.5.5. Financials (Based on Availability)
- 11.2.6 ZTE
- 11.2.6.1. Overview
- 11.2.6.2. Products
- 11.2.6.3. SWOT Analysis
- 11.2.6.4. Recent Developments
- 11.2.6.5. Financials (Based on Availability)
- 11.2.7 Cradlepoint
- 11.2.7.1. Overview
- 11.2.7.2. Products
- 11.2.7.3. SWOT Analysis
- 11.2.7.4. Recent Developments
- 11.2.7.5. Financials (Based on Availability)
- 11.2.8 Avaya
- 11.2.8.1. Overview
- 11.2.8.2. Products
- 11.2.8.3. SWOT Analysis
- 11.2.8.4. Recent Developments
- 11.2.8.5. Financials (Based on Availability)
- 11.2.9 Nokia
- 11.2.9.1. Overview
- 11.2.9.2. Products
- 11.2.9.3. SWOT Analysis
- 11.2.9.4. Recent Developments
- 11.2.9.5. Financials (Based on Availability)
- 11.2.10 Dell
- 11.2.10.1. Overview
- 11.2.10.2. Products
- 11.2.10.3. SWOT Analysis
- 11.2.10.4. Recent Developments
- 11.2.10.5. Financials (Based on Availability)
- 11.2.11 TP-Link
- 11.2.11.1. Overview
- 11.2.11.2. Products
- 11.2.11.3. SWOT Analysis
- 11.2.11.4. Recent Developments
- 11.2.11.5. Financials (Based on Availability)
- 11.2.12 Alcatel-Lucent
- 11.2.12.1. Overview
- 11.2.12.2. Products
- 11.2.12.3. SWOT Analysis
- 11.2.12.4. Recent Developments
- 11.2.12.5. Financials (Based on Availability)
- 11.2.13 D-Link
- 11.2.13.1. Overview
- 11.2.13.2. Products
- 11.2.13.3. SWOT Analysis
- 11.2.13.4. Recent Developments
- 11.2.13.5. Financials (Based on Availability)
- 11.2.14 NETGEAR
- 11.2.14.1. Overview
- 11.2.14.2. Products
- 11.2.14.3. SWOT Analysis
- 11.2.14.4. Recent Developments
- 11.2.14.5. Financials (Based on Availability)
- 11.2.15 ASUS
- 11.2.15.1. Overview
- 11.2.15.2. Products
- 11.2.15.3. SWOT Analysis
- 11.2.15.4. Recent Developments
- 11.2.15.5. Financials (Based on Availability)
- 11.2.1 Cisco
List of Figures
- Figure 1: Global Enterprise-grade Router Revenue Breakdown (million, %) by Region 2024 & 2032
- Figure 2: Global Enterprise-grade Router Volume Breakdown (K, %) by Region 2024 & 2032
- Figure 3: North America Enterprise-grade Router Revenue (million), by Application 2024 & 2032
- Figure 4: North America Enterprise-grade Router Volume (K), by Application 2024 & 2032
- Figure 5: North America Enterprise-grade Router Revenue Share (%), by Application 2024 & 2032
- Figure 6: North America Enterprise-grade Router Volume Share (%), by Application 2024 & 2032
- Figure 7: North America Enterprise-grade Router Revenue (million), by Types 2024 & 2032
- Figure 8: North America Enterprise-grade Router Volume (K), by Types 2024 & 2032
- Figure 9: North America Enterprise-grade Router Revenue Share (%), by Types 2024 & 2032
- Figure 10: North America Enterprise-grade Router Volume Share (%), by Types 2024 & 2032
- Figure 11: North America Enterprise-grade Router Revenue (million), by Country 2024 & 2032
- Figure 12: North America Enterprise-grade Router Volume (K), by Country 2024 & 2032
- Figure 13: North America Enterprise-grade Router Revenue Share (%), by Country 2024 & 2032
- Figure 14: North America Enterprise-grade Router Volume Share (%), by Country 2024 & 2032
- Figure 15: South America Enterprise-grade Router Revenue (million), by Application 2024 & 2032
- Figure 16: South America Enterprise-grade Router Volume (K), by Application 2024 & 2032
- Figure 17: South America Enterprise-grade Router Revenue Share (%), by Application 2024 & 2032
- Figure 18: South America Enterprise-grade Router Volume Share (%), by Application 2024 & 2032
- Figure 19: South America Enterprise-grade Router Revenue (million), by Types 2024 & 2032
- Figure 20: South America Enterprise-grade Router Volume (K), by Types 2024 & 2032
- Figure 21: South America Enterprise-grade Router Revenue Share (%), by Types 2024 & 2032
- Figure 22: South America Enterprise-grade Router Volume Share (%), by Types 2024 & 2032
- Figure 23: South America Enterprise-grade Router Revenue (million), by Country 2024 & 2032
- Figure 24: South America Enterprise-grade Router Volume (K), by Country 2024 & 2032
- Figure 25: South America Enterprise-grade Router Revenue Share (%), by Country 2024 & 2032
- Figure 26: South America Enterprise-grade Router Volume Share (%), by Country 2024 & 2032
- Figure 27: Europe Enterprise-grade Router Revenue (million), by Application 2024 & 2032
- Figure 28: Europe Enterprise-grade Router Volume (K), by Application 2024 & 2032
- Figure 29: Europe Enterprise-grade Router Revenue Share (%), by Application 2024 & 2032
- Figure 30: Europe Enterprise-grade Router Volume Share (%), by Application 2024 & 2032
- Figure 31: Europe Enterprise-grade Router Revenue (million), by Types 2024 & 2032
- Figure 32: Europe Enterprise-grade Router Volume (K), by Types 2024 & 2032
- Figure 33: Europe Enterprise-grade Router Revenue Share (%), by Types 2024 & 2032
- Figure 34: Europe Enterprise-grade Router Volume Share (%), by Types 2024 & 2032
- Figure 35: Europe Enterprise-grade Router Revenue (million), by Country 2024 & 2032
- Figure 36: Europe Enterprise-grade Router Volume (K), by Country 2024 & 2032
- Figure 37: Europe Enterprise-grade Router Revenue Share (%), by Country 2024 & 2032
- Figure 38: Europe Enterprise-grade Router Volume Share (%), by Country 2024 & 2032
- Figure 39: Middle East & Africa Enterprise-grade Router Revenue (million), by Application 2024 & 2032
- Figure 40: Middle East & Africa Enterprise-grade Router Volume (K), by Application 2024 & 2032
- Figure 41: Middle East & Africa Enterprise-grade Router Revenue Share (%), by Application 2024 & 2032
- Figure 42: Middle East & Africa Enterprise-grade Router Volume Share (%), by Application 2024 & 2032
- Figure 43: Middle East & Africa Enterprise-grade Router Revenue (million), by Types 2024 & 2032
- Figure 44: Middle East & Africa Enterprise-grade Router Volume (K), by Types 2024 & 2032
- Figure 45: Middle East & Africa Enterprise-grade Router Revenue Share (%), by Types 2024 & 2032
- Figure 46: Middle East & Africa Enterprise-grade Router Volume Share (%), by Types 2024 & 2032
- Figure 47: Middle East & Africa Enterprise-grade Router Revenue (million), by Country 2024 & 2032
- Figure 48: Middle East & Africa Enterprise-grade Router Volume (K), by Country 2024 & 2032
- Figure 49: Middle East & Africa Enterprise-grade Router Revenue Share (%), by Country 2024 & 2032
- Figure 50: Middle East & Africa Enterprise-grade Router Volume Share (%), by Country 2024 & 2032
- Figure 51: Asia Pacific Enterprise-grade Router Revenue (million), by Application 2024 & 2032
- Figure 52: Asia Pacific Enterprise-grade Router Volume (K), by Application 2024 & 2032
- Figure 53: Asia Pacific Enterprise-grade Router Revenue Share (%), by Application 2024 & 2032
- Figure 54: Asia Pacific Enterprise-grade Router Volume Share (%), by Application 2024 & 2032
- Figure 55: Asia Pacific Enterprise-grade Router Revenue (million), by Types 2024 & 2032
- Figure 56: Asia Pacific Enterprise-grade Router Volume (K), by Types 2024 & 2032
- Figure 57: Asia Pacific Enterprise-grade Router Revenue Share (%), by Types 2024 & 2032
- Figure 58: Asia Pacific Enterprise-grade Router Volume Share (%), by Types 2024 & 2032
- Figure 59: Asia Pacific Enterprise-grade Router Revenue (million), by Country 2024 & 2032
- Figure 60: Asia Pacific Enterprise-grade Router Volume (K), by Country 2024 & 2032
- Figure 61: Asia Pacific Enterprise-grade Router Revenue Share (%), by Country 2024 & 2032
- Figure 62: Asia Pacific Enterprise-grade Router Volume Share (%), by Country 2024 & 2032
List of Tables
- Table 1: Global Enterprise-grade Router Revenue million Forecast, by Region 2019 & 2032
- Table 2: Global Enterprise-grade Router Volume K Forecast, by Region 2019 & 2032
- Table 3: Global Enterprise-grade Router Revenue million Forecast, by Application 2019 & 2032
- Table 4: Global Enterprise-grade Router Volume K Forecast, by Application 2019 & 2032
- Table 5: Global Enterprise-grade Router Revenue million Forecast, by Types 2019 & 2032
- Table 6: Global Enterprise-grade Router Volume K Forecast, by Types 2019 & 2032
- Table 7: Global Enterprise-grade Router Revenue million Forecast, by Region 2019 & 2032
- Table 8: Global Enterprise-grade Router Volume K Forecast, by Region 2019 & 2032
- Table 9: Global Enterprise-grade Router Revenue million Forecast, by Application 2019 & 2032
- Table 10: Global Enterprise-grade Router Volume K Forecast, by Application 2019 & 2032
- Table 11: Global Enterprise-grade Router Revenue million Forecast, by Types 2019 & 2032
- Table 12: Global Enterprise-grade Router Volume K Forecast, by Types 2019 & 2032
- Table 13: Global Enterprise-grade Router Revenue million Forecast, by Country 2019 & 2032
- Table 14: Global Enterprise-grade Router Volume K Forecast, by Country 2019 & 2032
- Table 15: United States Enterprise-grade Router Revenue (million) Forecast, by Application 2019 & 2032
- Table 16: United States Enterprise-grade Router Volume (K) Forecast, by Application 2019 & 2032
- Table 17: Canada Enterprise-grade Router Revenue (million) Forecast, by Application 2019 & 2032
- Table 18: Canada Enterprise-grade Router Volume (K) Forecast, by Application 2019 & 2032
- Table 19: Mexico Enterprise-grade Router Revenue (million) Forecast, by Application 2019 & 2032
- Table 20: Mexico Enterprise-grade Router Volume (K) Forecast, by Application 2019 & 2032
- Table 21: Global Enterprise-grade Router Revenue million Forecast, by Application 2019 & 2032
- Table 22: Global Enterprise-grade Router Volume K Forecast, by Application 2019 & 2032
- Table 23: Global Enterprise-grade Router Revenue million Forecast, by Types 2019 & 2032
- Table 24: Global Enterprise-grade Router Volume K Forecast, by Types 2019 & 2032
- Table 25: Global Enterprise-grade Router Revenue million Forecast, by Country 2019 & 2032
- Table 26: Global Enterprise-grade Router Volume K Forecast, by Country 2019 & 2032
- Table 27: Brazil Enterprise-grade Router Revenue (million) Forecast, by Application 2019 & 2032
- Table 28: Brazil Enterprise-grade Router Volume (K) Forecast, by Application 2019 & 2032
- Table 29: Argentina Enterprise-grade Router Revenue (million) Forecast, by Application 2019 & 2032
- Table 30: Argentina Enterprise-grade Router Volume (K) Forecast, by Application 2019 & 2032
- Table 31: Rest of South America Enterprise-grade Router Revenue (million) Forecast, by Application 2019 & 2032
- Table 32: Rest of South America Enterprise-grade Router Volume (K) Forecast, by Application 2019 & 2032
- Table 33: Global Enterprise-grade Router Revenue million Forecast, by Application 2019 & 2032
- Table 34: Global Enterprise-grade Router Volume K Forecast, by Application 2019 & 2032
- Table 35: Global Enterprise-grade Router Revenue million Forecast, by Types 2019 & 2032
- Table 36: Global Enterprise-grade Router Volume K Forecast, by Types 2019 & 2032
- Table 37: Global Enterprise-grade Router Revenue million Forecast, by Country 2019 & 2032
- Table 38: Global Enterprise-grade Router Volume K Forecast, by Country 2019 & 2032
- Table 39: United Kingdom Enterprise-grade Router Revenue (million) Forecast, by Application 2019 & 2032
- Table 40: United Kingdom Enterprise-grade Router Volume (K) Forecast, by Application 2019 & 2032
- Table 41: Germany Enterprise-grade Router Revenue (million) Forecast, by Application 2019 & 2032
- Table 42: Germany Enterprise-grade Router Volume (K) Forecast, by Application 2019 & 2032
- Table 43: France Enterprise-grade Router Revenue (million) Forecast, by Application 2019 & 2032
- Table 44: France Enterprise-grade Router Volume (K) Forecast, by Application 2019 & 2032
- Table 45: Italy Enterprise-grade Router Revenue (million) Forecast, by Application 2019 & 2032
- Table 46: Italy Enterprise-grade Router Volume (K) Forecast, by Application 2019 & 2032
- Table 47: Spain Enterprise-grade Router Revenue (million) Forecast, by Application 2019 & 2032
- Table 48: Spain Enterprise-grade Router Volume (K) Forecast, by Application 2019 & 2032
- Table 49: Russia Enterprise-grade Router Revenue (million) Forecast, by Application 2019 & 2032
- Table 50: Russia Enterprise-grade Router Volume (K) Forecast, by Application 2019 & 2032
- Table 51: Benelux Enterprise-grade Router Revenue (million) Forecast, by Application 2019 & 2032
- Table 52: Benelux Enterprise-grade Router Volume (K) Forecast, by Application 2019 & 2032
- Table 53: Nordics Enterprise-grade Router Revenue (million) Forecast, by Application 2019 & 2032
- Table 54: Nordics Enterprise-grade Router Volume (K) Forecast, by Application 2019 & 2032
- Table 55: Rest of Europe Enterprise-grade Router Revenue (million) Forecast, by Application 2019 & 2032
- Table 56: Rest of Europe Enterprise-grade Router Volume (K) Forecast, by Application 2019 & 2032
- Table 57: Global Enterprise-grade Router Revenue million Forecast, by Application 2019 & 2032
- Table 58: Global Enterprise-grade Router Volume K Forecast, by Application 2019 & 2032
- Table 59: Global Enterprise-grade Router Revenue million Forecast, by Types 2019 & 2032
- Table 60: Global Enterprise-grade Router Volume K Forecast, by Types 2019 & 2032
- Table 61: Global Enterprise-grade Router Revenue million Forecast, by Country 2019 & 2032
- Table 62: Global Enterprise-grade Router Volume K Forecast, by Country 2019 & 2032
- Table 63: Turkey Enterprise-grade Router Revenue (million) Forecast, by Application 2019 & 2032
- Table 64: Turkey Enterprise-grade Router Volume (K) Forecast, by Application 2019 & 2032
- Table 65: Israel Enterprise-grade Router Revenue (million) Forecast, by Application 2019 & 2032
- Table 66: Israel Enterprise-grade Router Volume (K) Forecast, by Application 2019 & 2032
- Table 67: GCC Enterprise-grade Router Revenue (million) Forecast, by Application 2019 & 2032
- Table 68: GCC Enterprise-grade Router Volume (K) Forecast, by Application 2019 & 2032
- Table 69: North Africa Enterprise-grade Router Revenue (million) Forecast, by Application 2019 & 2032
- Table 70: North Africa Enterprise-grade Router Volume (K) Forecast, by Application 2019 & 2032
- Table 71: South Africa Enterprise-grade Router Revenue (million) Forecast, by Application 2019 & 2032
- Table 72: South Africa Enterprise-grade Router Volume (K) Forecast, by Application 2019 & 2032
- Table 73: Rest of Middle East & Africa Enterprise-grade Router Revenue (million) Forecast, by Application 2019 & 2032
- Table 74: Rest of Middle East & Africa Enterprise-grade Router Volume (K) Forecast, by Application 2019 & 2032
- Table 75: Global Enterprise-grade Router Revenue million Forecast, by Application 2019 & 2032
- Table 76: Global Enterprise-grade Router Volume K Forecast, by Application 2019 & 2032
- Table 77: Global Enterprise-grade Router Revenue million Forecast, by Types 2019 & 2032
- Table 78: Global Enterprise-grade Router Volume K Forecast, by Types 2019 & 2032
- Table 79: Global Enterprise-grade Router Revenue million Forecast, by Country 2019 & 2032
- Table 80: Global Enterprise-grade Router Volume K Forecast, by Country 2019 & 2032
- Table 81: China Enterprise-grade Router Revenue (million) Forecast, by Application 2019 & 2032
- Table 82: China Enterprise-grade Router Volume (K) Forecast, by Application 2019 & 2032
- Table 83: India Enterprise-grade Router Revenue (million) Forecast, by Application 2019 & 2032
- Table 84: India Enterprise-grade Router Volume (K) Forecast, by Application 2019 & 2032
- Table 85: Japan Enterprise-grade Router Revenue (million) Forecast, by Application 2019 & 2032
- Table 86: Japan Enterprise-grade Router Volume (K) Forecast, by Application 2019 & 2032
- Table 87: South Korea Enterprise-grade Router Revenue (million) Forecast, by Application 2019 & 2032
- Table 88: South Korea Enterprise-grade Router Volume (K) Forecast, by Application 2019 & 2032
- Table 89: ASEAN Enterprise-grade Router Revenue (million) Forecast, by Application 2019 & 2032
- Table 90: ASEAN Enterprise-grade Router Volume (K) Forecast, by Application 2019 & 2032
- Table 91: Oceania Enterprise-grade Router Revenue (million) Forecast, by Application 2019 & 2032
- Table 92: Oceania Enterprise-grade Router Volume (K) Forecast, by Application 2019 & 2032
- Table 93: Rest of Asia Pacific Enterprise-grade Router Revenue (million) Forecast, by Application 2019 & 2032
- Table 94: Rest of Asia Pacific Enterprise-grade Router Volume (K) Forecast, by Application 2019 & 2032
Frequently Asked Questions
1. What is the projected Compound Annual Growth Rate (CAGR) of the Enterprise-grade Router?
The projected CAGR is approximately XX%.
2. Which companies are prominent players in the Enterprise-grade Router?
Key companies in the market include Cisco, Huawei, Juniper Networks, Arista Networks, Hewlett Packard Enterprise, ZTE, Cradlepoint, Avaya, Nokia, Dell, TP-Link, Alcatel-Lucent, D-Link, NETGEAR, ASUS.
3. What are the main segments of the Enterprise-grade Router?
The market segments include Application, Types.
4. Can you provide details about the market size?
The market size is estimated to be USD XXX million as of 2022.
5. What are some drivers contributing to market growth?
N/A
6. What are the notable trends driving market growth?
N/A
7. Are there any restraints impacting market growth?
N/A
8. Can you provide examples of recent developments in the market?
N/A
9. What pricing options are available for accessing the report?
Pricing options include single-user, multi-user, and enterprise licenses priced at USD 3350.00, USD 5025.00, and USD 6700.00 respectively.
10. Is the market size provided in terms of value or volume?
The market size is provided in terms of value, measured in million and volume, measured in K.
11. Are there any specific market keywords associated with the report?
Yes, the market keyword associated with the report is "Enterprise-grade Router," which aids in identifying and referencing the specific market segment covered.
12. How do I determine which pricing option suits my needs best?
The pricing options vary based on user requirements and access needs. Individual users may opt for single-user licenses, while businesses requiring broader access may choose multi-user or enterprise licenses for cost-effective access to the report.
13. Are there any additional resources or data provided in the Enterprise-grade Router report?
While the report offers comprehensive insights, it's advisable to review the specific contents or supplementary materials provided to ascertain if additional resources or data are available.
14. How can I stay updated on further developments or reports in the Enterprise-grade Router?
To stay informed about further developments, trends, and reports in the Enterprise-grade Router, consider subscribing to industry newsletters, following relevant companies and organizations, or regularly checking reputable industry news sources and publications.
Methodology
Step 1 - Identification of Relevant Samples Size from Population Database


Step 2 - Approaches for Defining Global Market Size (Value, Volume* & Price*)

Note*: In applicable scenarios
Step 3 - Data Sources
Primary Research
- Web Analytics
- Survey Reports
- Research Institute
- Latest Research Reports
- Opinion Leaders
Secondary Research
- Annual Reports
- White Paper
- Latest Press Release
- Industry Association
- Paid Database
- Investor Presentations

Step 4 - Data Triangulation
Involves using different sources of information in order to increase the validity of a study
These sources are likely to be stakeholders in a program - participants, other researchers, program staff, other community members, and so on.
Then we put all data in single framework & apply various statistical tools to find out the dynamic on the market.
During the analysis stage, feedback from the stakeholder groups would be compared to determine areas of agreement as well as areas of divergence
