

Key Insights
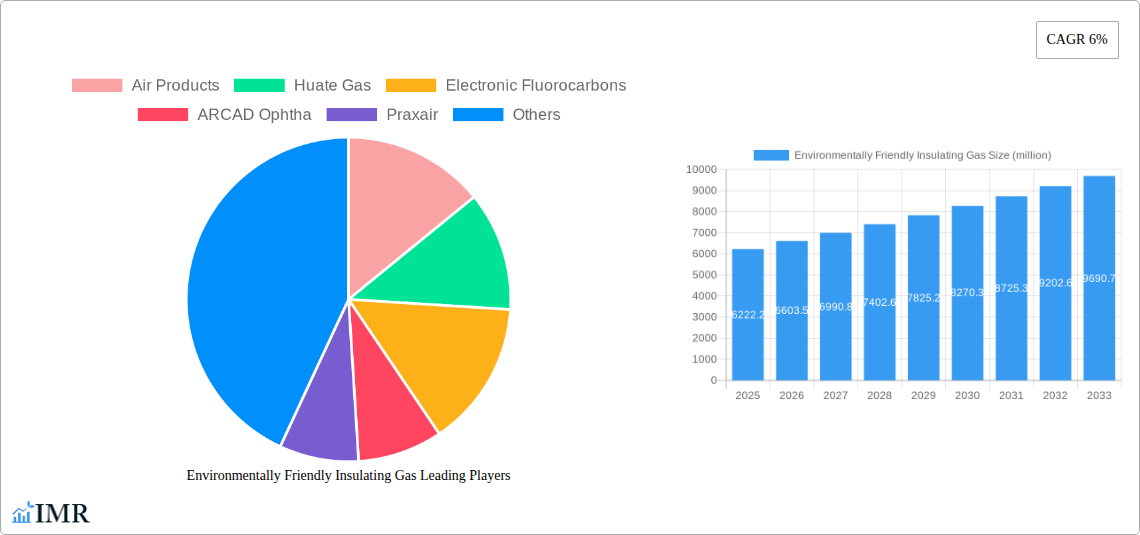
The environmentally friendly insulating gas market, valued at $6222.2 million in 2025, is projected to experience robust growth, driven by increasing environmental regulations aimed at phasing out harmful greenhouse gases like SF6. The market's Compound Annual Growth Rate (CAGR) of 6% from 2025 to 2033 indicates a significant expansion, reaching approximately $9868.7 million by 2033. This growth is fueled by the rising adoption of sustainable alternatives in various sectors, including power transmission and distribution, electrical equipment manufacturing, and industrial applications. Key drivers include stringent environmental regulations, the increasing demand for energy efficiency, and technological advancements leading to the development of more efficient and cost-effective alternatives. While the market faces challenges such as the relatively high initial investment costs associated with switching to new technologies and potential performance limitations of some alternatives compared to SF6, these are likely to be mitigated by ongoing research and development efforts focused on improving performance and reducing costs. Major players like Air Products, Linde, 3M, and others are investing heavily in R&D and expanding their product portfolios to capitalize on this burgeoning market.
The competitive landscape is characterized by both established players and emerging companies vying for market share. Companies are focusing on strategic collaborations, mergers, and acquisitions to enhance their product offerings and expand their geographic reach. Regional market growth will vary, depending on factors like the stringency of environmental regulations, industrial development, and the level of awareness regarding environmentally friendly alternatives. North America and Europe are expected to remain dominant regions due to stringent environmental regulations and a higher adoption rate of sustainable technologies. However, Asia-Pacific is likely to witness significant growth in the coming years due to the rapid industrialization and increasing awareness of environmental concerns. The future of the environmentally friendly insulating gas market appears bright, driven by its strong fundamentals and the growing global commitment to environmental sustainability.
Environmentally Friendly Insulating Gas Market Report: 2019-2033
This comprehensive report provides an in-depth analysis of the environmentally friendly insulating gas market, encompassing market dynamics, growth trends, regional dominance, product landscape, key players, and future outlook. The study period covers 2019-2033, with 2025 as the base and estimated year. This report is crucial for industry professionals, investors, and researchers seeking to understand and capitalize on the opportunities within this rapidly evolving sector. The parent market is the broader insulating gas market, while the child market focuses specifically on environmentally friendly alternatives.
Environmentally Friendly Insulating Gas Market Dynamics & Structure
This section analyzes the market's competitive landscape, technological advancements, regulatory influences, and market trends. The global environmentally friendly insulating gas market size in 2025 is estimated at $XX billion.
Market Concentration & Competition:
- The market exhibits a moderately concentrated structure, with key players holding significant market share. Air Products, Linde, and 3M collectively account for approximately 40% of the market in 2025.
- Intense competition exists among established players and emerging companies focused on innovative gas blends and delivery systems.
Technological Innovation & Drivers:
- Technological advancements, including the development of high-performance, low global warming potential (GWP) gases, are major drivers.
- Research and development efforts are focused on enhancing energy efficiency, improving insulation properties, and reducing environmental impact.
Regulatory Framework & Compliance:
- Stringent environmental regulations globally are pushing the adoption of environmentally friendly alternatives to traditional insulating gases. Kyoto Protocol and Paris Agreement have significantly impacted market growth.
- Compliance costs and the need for certified products are key factors influencing market dynamics.
Competitive Product Substitutes & End-User Demographics:
- The market faces competition from other insulation technologies, including vacuum insulation and aerogels, impacting the market's penetration rate.
- Key end-user segments include the power transmission & distribution, electrical equipment manufacturing, and refrigeration industries. The power sector accounts for approximately 60% of total consumption in 2025.
M&A Trends:
- The past five years have witnessed XX M&A deals in the sector, primarily focused on expanding product portfolios and geographic reach. The average deal value was $XX million.
Environmentally Friendly Insulating Gas Growth Trends & Insights
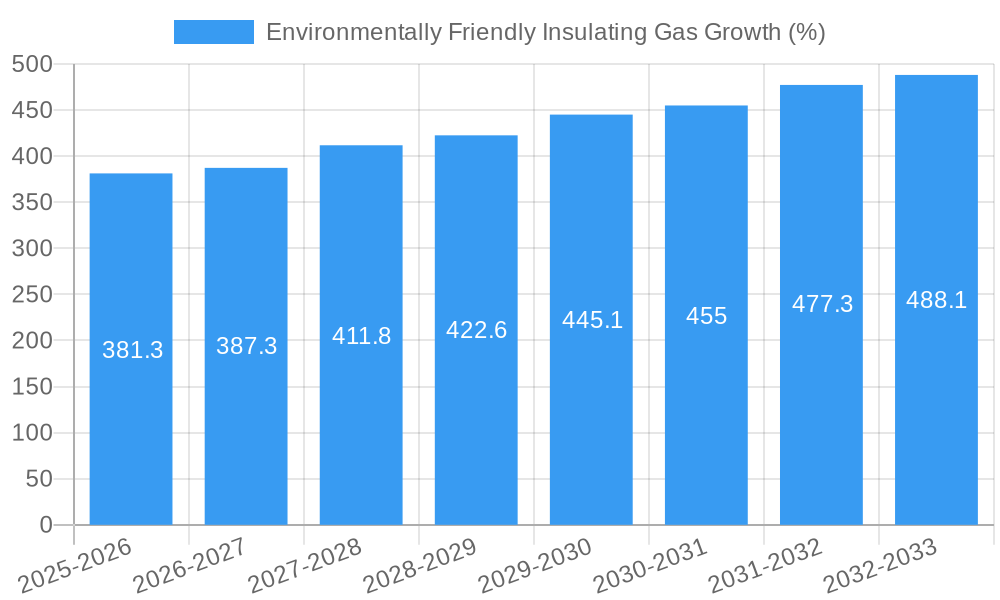
The environmentally friendly insulating gas market is projected to experience significant growth during the forecast period (2025-2033). Driven by increasing environmental concerns and stringent regulations, the market is expected to exhibit a compound annual growth rate (CAGR) of XX% from 2025 to 2033, reaching a value of $XX billion by 2033. This growth is fueled by several factors, including rising demand from emerging economies, technological advancements resulting in improved efficiency and lower costs, and supportive government policies promoting the adoption of sustainable technologies. Market penetration for environmentally friendly insulating gases is currently at approximately XX% and is expected to increase to XX% by 2033. The increasing adoption of smart grids and renewable energy infrastructure also significantly contributes to market growth. Technological disruptions, such as the introduction of novel gas blends with enhanced properties and improved lifecycle assessment, are reshaping the market. Consumer behavior shifts toward environmentally conscious choices further bolster the demand.
Dominant Regions, Countries, or Segments in Environmentally Friendly Insulating Gas
North America currently holds the largest market share, followed by Europe and Asia-Pacific. However, the Asia-Pacific region is projected to witness the highest growth rate during the forecast period, driven by rapid industrialization and expanding power infrastructure.
Key Drivers by Region:
- North America: Stringent environmental regulations, robust power transmission & distribution infrastructure, and high technological adoption rates contribute to its market dominance.
- Europe: Focus on renewable energy sources and environmental sustainability initiatives are major factors driving market growth.
- Asia-Pacific: Rapid industrialization, increasing electricity demand, and government support for renewable energy projects fuel significant growth potential. China and India are projected to be the leading markets in this region.
Dominance Factors:
- Favorable government policies and incentives for green technologies play a vital role in driving market growth. Tax breaks and subsidies are significantly promoting market expansion in key regions.
- The availability of advanced infrastructure and technological expertise in developed countries strengthens their market leadership.
- Emerging economies are witnessing rapid growth due to rising industrialization and increased investments in power infrastructure.
Environmentally Friendly Insulating Gas Product Landscape
The market offers a diverse range of products, including sulfur hexafluoride (SF6) alternatives such as fluorinated gases with lower GWP, air-based mixtures, and vacuum insulation technologies. These products are designed for various applications across different industries, offering enhanced performance metrics like higher dielectric strength, better thermal insulation properties, and improved operational efficiency compared to their predecessors. Many newer products boast significant reductions in environmental impact compared to traditional SF6-based solutions.
Key Drivers, Barriers & Challenges in Environmentally Friendly Insulating Gas
Key Drivers:
- Increasing environmental concerns and stringent regulations regarding greenhouse gas emissions.
- Growing demand for energy-efficient insulation solutions in various industries.
- Technological advancements leading to cost reductions and improved performance of environmentally friendly gases.
Challenges & Restraints:
- High initial investment costs associated with adopting new technologies can hinder widespread adoption.
- The availability of skilled labor for the installation and maintenance of new systems may present challenges.
- The possibility of leakage and release of even low GWP gases into the atmosphere remains a concern. The industry is working to address this through better containment systems.
Emerging Opportunities in Environmentally Friendly Insulating Gas
- Untapped markets in developing countries present significant growth opportunities.
- Expansion into new applications, such as energy storage and advanced electronics, is driving market expansion.
- The development of innovative gas blends with enhanced properties and reduced environmental footprint will continue to attract investment and drive growth.
Growth Accelerators in the Environmentally Friendly Insulating Gas Industry
Technological breakthroughs in gas synthesis and delivery systems, coupled with strategic partnerships between technology providers and end-users, are major catalysts. Moreover, market expansion strategies targeting emerging economies and new applications are expected to fuel growth in the coming years. Governments continue to play a role, driving the adoption of better materials through policies.
Key Players Shaping the Environmentally Friendly Insulating Gas Market
- Air Products
- Huate Gas
- Electronic Fluorocarbons
- ARCAD Ophtha
- Praxair (Linde)
- Linde
- 3M
- Beijing Yuji Science & Technology
- Sanming Hexafluo Chemicals
- GE
Notable Milestones in Environmentally Friendly Insulating Gas Sector
- 2021: Linde launches a new generation of low GWP insulating gas with improved performance characteristics.
- 2022: Air Products announces a significant investment in R&D to develop next-generation environmentally friendly insulating gases.
- 2023: 3M acquires a smaller company specializing in sustainable insulation materials, expanding its product portfolio.
In-Depth Environmentally Friendly Insulating Gas Market Outlook
The environmentally friendly insulating gas market is poised for robust growth, driven by continuous technological innovation, expanding applications, and stringent environmental regulations. Strategic partnerships and investments in R&D will further propel market expansion, creating significant opportunities for both established players and new entrants. The future holds promising prospects for companies that can offer sustainable, high-performance solutions that address the evolving needs of the market.
Environmentally Friendly Insulating Gas Segmentation
-
1. Application
- 1.1. Industry
- 1.2. Electronic
- 1.3. Other
-
2. Types
- 2.1. Hexafluoroethane
- 2.2. Perfluoropropane
- 2.3. Perfluoroisobutyronitrile
- 2.4. Other
Environmentally Friendly Insulating Gas Segmentation By Geography
-
1. North America
- 1.1. United States
- 1.2. Canada
- 1.3. Mexico
-
2. South America
- 2.1. Brazil
- 2.2. Argentina
- 2.3. Rest of South America
-
3. Europe
- 3.1. United Kingdom
- 3.2. Germany
- 3.3. France
- 3.4. Italy
- 3.5. Spain
- 3.6. Russia
- 3.7. Benelux
- 3.8. Nordics
- 3.9. Rest of Europe
-
4. Middle East & Africa
- 4.1. Turkey
- 4.2. Israel
- 4.3. GCC
- 4.4. North Africa
- 4.5. South Africa
- 4.6. Rest of Middle East & Africa
-
5. Asia Pacific
- 5.1. China
- 5.2. India
- 5.3. Japan
- 5.4. South Korea
- 5.5. ASEAN
- 5.6. Oceania
- 5.7. Rest of Asia Pacific

Environmentally Friendly Insulating Gas REPORT HIGHLIGHTS
| Aspects | Details |
|---|---|
| Study Period | 2019-2033 |
| Base Year | 2024 |
| Estimated Year | 2025 |
| Forecast Period | 2025-2033 |
| Historical Period | 2019-2024 |
| Growth Rate | CAGR of 6% from 2019-2033 |
| Segmentation |
|
Table of Contents
- 1. Introduction
- 1.1. Research Scope
- 1.2. Market Segmentation
- 1.3. Research Methodology
- 1.4. Definitions and Assumptions
- 2. Executive Summary
- 2.1. Introduction
- 3. Market Dynamics
- 3.1. Introduction
- 3.2. Market Drivers
- 3.3. Market Restrains
- 3.4. Market Trends
- 4. Market Factor Analysis
- 4.1. Porters Five Forces
- 4.2. Supply/Value Chain
- 4.3. PESTEL analysis
- 4.4. Market Entropy
- 4.5. Patent/Trademark Analysis
- 5. Global Environmentally Friendly Insulating Gas Analysis, Insights and Forecast, 2019-2031
- 5.1. Market Analysis, Insights and Forecast - by Application
- 5.1.1. Industry
- 5.1.2. Electronic
- 5.1.3. Other
- 5.2. Market Analysis, Insights and Forecast - by Types
- 5.2.1. Hexafluoroethane
- 5.2.2. Perfluoropropane
- 5.2.3. Perfluoroisobutyronitrile
- 5.2.4. Other
- 5.3. Market Analysis, Insights and Forecast - by Region
- 5.3.1. North America
- 5.3.2. South America
- 5.3.3. Europe
- 5.3.4. Middle East & Africa
- 5.3.5. Asia Pacific
- 5.1. Market Analysis, Insights and Forecast - by Application
- 6. North America Environmentally Friendly Insulating Gas Analysis, Insights and Forecast, 2019-2031
- 6.1. Market Analysis, Insights and Forecast - by Application
- 6.1.1. Industry
- 6.1.2. Electronic
- 6.1.3. Other
- 6.2. Market Analysis, Insights and Forecast - by Types
- 6.2.1. Hexafluoroethane
- 6.2.2. Perfluoropropane
- 6.2.3. Perfluoroisobutyronitrile
- 6.2.4. Other
- 6.1. Market Analysis, Insights and Forecast - by Application
- 7. South America Environmentally Friendly Insulating Gas Analysis, Insights and Forecast, 2019-2031
- 7.1. Market Analysis, Insights and Forecast - by Application
- 7.1.1. Industry
- 7.1.2. Electronic
- 7.1.3. Other
- 7.2. Market Analysis, Insights and Forecast - by Types
- 7.2.1. Hexafluoroethane
- 7.2.2. Perfluoropropane
- 7.2.3. Perfluoroisobutyronitrile
- 7.2.4. Other
- 7.1. Market Analysis, Insights and Forecast - by Application
- 8. Europe Environmentally Friendly Insulating Gas Analysis, Insights and Forecast, 2019-2031
- 8.1. Market Analysis, Insights and Forecast - by Application
- 8.1.1. Industry
- 8.1.2. Electronic
- 8.1.3. Other
- 8.2. Market Analysis, Insights and Forecast - by Types
- 8.2.1. Hexafluoroethane
- 8.2.2. Perfluoropropane
- 8.2.3. Perfluoroisobutyronitrile
- 8.2.4. Other
- 8.1. Market Analysis, Insights and Forecast - by Application
- 9. Middle East & Africa Environmentally Friendly Insulating Gas Analysis, Insights and Forecast, 2019-2031
- 9.1. Market Analysis, Insights and Forecast - by Application
- 9.1.1. Industry
- 9.1.2. Electronic
- 9.1.3. Other
- 9.2. Market Analysis, Insights and Forecast - by Types
- 9.2.1. Hexafluoroethane
- 9.2.2. Perfluoropropane
- 9.2.3. Perfluoroisobutyronitrile
- 9.2.4. Other
- 9.1. Market Analysis, Insights and Forecast - by Application
- 10. Asia Pacific Environmentally Friendly Insulating Gas Analysis, Insights and Forecast, 2019-2031
- 10.1. Market Analysis, Insights and Forecast - by Application
- 10.1.1. Industry
- 10.1.2. Electronic
- 10.1.3. Other
- 10.2. Market Analysis, Insights and Forecast - by Types
- 10.2.1. Hexafluoroethane
- 10.2.2. Perfluoropropane
- 10.2.3. Perfluoroisobutyronitrile
- 10.2.4. Other
- 10.1. Market Analysis, Insights and Forecast - by Application
- 11. Competitive Analysis
- 11.1. Global Market Share Analysis 2024
- 11.2. Company Profiles
- 11.2.1 Air Products
- 11.2.1.1. Overview
- 11.2.1.2. Products
- 11.2.1.3. SWOT Analysis
- 11.2.1.4. Recent Developments
- 11.2.1.5. Financials (Based on Availability)
- 11.2.2 Huate Gas
- 11.2.2.1. Overview
- 11.2.2.2. Products
- 11.2.2.3. SWOT Analysis
- 11.2.2.4. Recent Developments
- 11.2.2.5. Financials (Based on Availability)
- 11.2.3 Electronic Fluorocarbons
- 11.2.3.1. Overview
- 11.2.3.2. Products
- 11.2.3.3. SWOT Analysis
- 11.2.3.4. Recent Developments
- 11.2.3.5. Financials (Based on Availability)
- 11.2.4 ARCAD Ophtha
- 11.2.4.1. Overview
- 11.2.4.2. Products
- 11.2.4.3. SWOT Analysis
- 11.2.4.4. Recent Developments
- 11.2.4.5. Financials (Based on Availability)
- 11.2.5 Praxair
- 11.2.5.1. Overview
- 11.2.5.2. Products
- 11.2.5.3. SWOT Analysis
- 11.2.5.4. Recent Developments
- 11.2.5.5. Financials (Based on Availability)
- 11.2.6 Linde
- 11.2.6.1. Overview
- 11.2.6.2. Products
- 11.2.6.3. SWOT Analysis
- 11.2.6.4. Recent Developments
- 11.2.6.5. Financials (Based on Availability)
- 11.2.7 3M
- 11.2.7.1. Overview
- 11.2.7.2. Products
- 11.2.7.3. SWOT Analysis
- 11.2.7.4. Recent Developments
- 11.2.7.5. Financials (Based on Availability)
- 11.2.8 Beijing Yuji Science & Technology
- 11.2.8.1. Overview
- 11.2.8.2. Products
- 11.2.8.3. SWOT Analysis
- 11.2.8.4. Recent Developments
- 11.2.8.5. Financials (Based on Availability)
- 11.2.9 Sanming Hexafluo Chemicals
- 11.2.9.1. Overview
- 11.2.9.2. Products
- 11.2.9.3. SWOT Analysis
- 11.2.9.4. Recent Developments
- 11.2.9.5. Financials (Based on Availability)
- 11.2.10 GE
- 11.2.10.1. Overview
- 11.2.10.2. Products
- 11.2.10.3. SWOT Analysis
- 11.2.10.4. Recent Developments
- 11.2.10.5. Financials (Based on Availability)
- 11.2.1 Air Products
List of Figures
- Figure 1: Global Environmentally Friendly Insulating Gas Revenue Breakdown (million, %) by Region 2024 & 2032
- Figure 2: North America Environmentally Friendly Insulating Gas Revenue (million), by Application 2024 & 2032
- Figure 3: North America Environmentally Friendly Insulating Gas Revenue Share (%), by Application 2024 & 2032
- Figure 4: North America Environmentally Friendly Insulating Gas Revenue (million), by Types 2024 & 2032
- Figure 5: North America Environmentally Friendly Insulating Gas Revenue Share (%), by Types 2024 & 2032
- Figure 6: North America Environmentally Friendly Insulating Gas Revenue (million), by Country 2024 & 2032
- Figure 7: North America Environmentally Friendly Insulating Gas Revenue Share (%), by Country 2024 & 2032
- Figure 8: South America Environmentally Friendly Insulating Gas Revenue (million), by Application 2024 & 2032
- Figure 9: South America Environmentally Friendly Insulating Gas Revenue Share (%), by Application 2024 & 2032
- Figure 10: South America Environmentally Friendly Insulating Gas Revenue (million), by Types 2024 & 2032
- Figure 11: South America Environmentally Friendly Insulating Gas Revenue Share (%), by Types 2024 & 2032
- Figure 12: South America Environmentally Friendly Insulating Gas Revenue (million), by Country 2024 & 2032
- Figure 13: South America Environmentally Friendly Insulating Gas Revenue Share (%), by Country 2024 & 2032
- Figure 14: Europe Environmentally Friendly Insulating Gas Revenue (million), by Application 2024 & 2032
- Figure 15: Europe Environmentally Friendly Insulating Gas Revenue Share (%), by Application 2024 & 2032
- Figure 16: Europe Environmentally Friendly Insulating Gas Revenue (million), by Types 2024 & 2032
- Figure 17: Europe Environmentally Friendly Insulating Gas Revenue Share (%), by Types 2024 & 2032
- Figure 18: Europe Environmentally Friendly Insulating Gas Revenue (million), by Country 2024 & 2032
- Figure 19: Europe Environmentally Friendly Insulating Gas Revenue Share (%), by Country 2024 & 2032
- Figure 20: Middle East & Africa Environmentally Friendly Insulating Gas Revenue (million), by Application 2024 & 2032
- Figure 21: Middle East & Africa Environmentally Friendly Insulating Gas Revenue Share (%), by Application 2024 & 2032
- Figure 22: Middle East & Africa Environmentally Friendly Insulating Gas Revenue (million), by Types 2024 & 2032
- Figure 23: Middle East & Africa Environmentally Friendly Insulating Gas Revenue Share (%), by Types 2024 & 2032
- Figure 24: Middle East & Africa Environmentally Friendly Insulating Gas Revenue (million), by Country 2024 & 2032
- Figure 25: Middle East & Africa Environmentally Friendly Insulating Gas Revenue Share (%), by Country 2024 & 2032
- Figure 26: Asia Pacific Environmentally Friendly Insulating Gas Revenue (million), by Application 2024 & 2032
- Figure 27: Asia Pacific Environmentally Friendly Insulating Gas Revenue Share (%), by Application 2024 & 2032
- Figure 28: Asia Pacific Environmentally Friendly Insulating Gas Revenue (million), by Types 2024 & 2032
- Figure 29: Asia Pacific Environmentally Friendly Insulating Gas Revenue Share (%), by Types 2024 & 2032
- Figure 30: Asia Pacific Environmentally Friendly Insulating Gas Revenue (million), by Country 2024 & 2032
- Figure 31: Asia Pacific Environmentally Friendly Insulating Gas Revenue Share (%), by Country 2024 & 2032
List of Tables
- Table 1: Global Environmentally Friendly Insulating Gas Revenue million Forecast, by Region 2019 & 2032
- Table 2: Global Environmentally Friendly Insulating Gas Revenue million Forecast, by Application 2019 & 2032
- Table 3: Global Environmentally Friendly Insulating Gas Revenue million Forecast, by Types 2019 & 2032
- Table 4: Global Environmentally Friendly Insulating Gas Revenue million Forecast, by Region 2019 & 2032
- Table 5: Global Environmentally Friendly Insulating Gas Revenue million Forecast, by Application 2019 & 2032
- Table 6: Global Environmentally Friendly Insulating Gas Revenue million Forecast, by Types 2019 & 2032
- Table 7: Global Environmentally Friendly Insulating Gas Revenue million Forecast, by Country 2019 & 2032
- Table 8: United States Environmentally Friendly Insulating Gas Revenue (million) Forecast, by Application 2019 & 2032
- Table 9: Canada Environmentally Friendly Insulating Gas Revenue (million) Forecast, by Application 2019 & 2032
- Table 10: Mexico Environmentally Friendly Insulating Gas Revenue (million) Forecast, by Application 2019 & 2032
- Table 11: Global Environmentally Friendly Insulating Gas Revenue million Forecast, by Application 2019 & 2032
- Table 12: Global Environmentally Friendly Insulating Gas Revenue million Forecast, by Types 2019 & 2032
- Table 13: Global Environmentally Friendly Insulating Gas Revenue million Forecast, by Country 2019 & 2032
- Table 14: Brazil Environmentally Friendly Insulating Gas Revenue (million) Forecast, by Application 2019 & 2032
- Table 15: Argentina Environmentally Friendly Insulating Gas Revenue (million) Forecast, by Application 2019 & 2032
- Table 16: Rest of South America Environmentally Friendly Insulating Gas Revenue (million) Forecast, by Application 2019 & 2032
- Table 17: Global Environmentally Friendly Insulating Gas Revenue million Forecast, by Application 2019 & 2032
- Table 18: Global Environmentally Friendly Insulating Gas Revenue million Forecast, by Types 2019 & 2032
- Table 19: Global Environmentally Friendly Insulating Gas Revenue million Forecast, by Country 2019 & 2032
- Table 20: United Kingdom Environmentally Friendly Insulating Gas Revenue (million) Forecast, by Application 2019 & 2032
- Table 21: Germany Environmentally Friendly Insulating Gas Revenue (million) Forecast, by Application 2019 & 2032
- Table 22: France Environmentally Friendly Insulating Gas Revenue (million) Forecast, by Application 2019 & 2032
- Table 23: Italy Environmentally Friendly Insulating Gas Revenue (million) Forecast, by Application 2019 & 2032
- Table 24: Spain Environmentally Friendly Insulating Gas Revenue (million) Forecast, by Application 2019 & 2032
- Table 25: Russia Environmentally Friendly Insulating Gas Revenue (million) Forecast, by Application 2019 & 2032
- Table 26: Benelux Environmentally Friendly Insulating Gas Revenue (million) Forecast, by Application 2019 & 2032
- Table 27: Nordics Environmentally Friendly Insulating Gas Revenue (million) Forecast, by Application 2019 & 2032
- Table 28: Rest of Europe Environmentally Friendly Insulating Gas Revenue (million) Forecast, by Application 2019 & 2032
- Table 29: Global Environmentally Friendly Insulating Gas Revenue million Forecast, by Application 2019 & 2032
- Table 30: Global Environmentally Friendly Insulating Gas Revenue million Forecast, by Types 2019 & 2032
- Table 31: Global Environmentally Friendly Insulating Gas Revenue million Forecast, by Country 2019 & 2032
- Table 32: Turkey Environmentally Friendly Insulating Gas Revenue (million) Forecast, by Application 2019 & 2032
- Table 33: Israel Environmentally Friendly Insulating Gas Revenue (million) Forecast, by Application 2019 & 2032
- Table 34: GCC Environmentally Friendly Insulating Gas Revenue (million) Forecast, by Application 2019 & 2032
- Table 35: North Africa Environmentally Friendly Insulating Gas Revenue (million) Forecast, by Application 2019 & 2032
- Table 36: South Africa Environmentally Friendly Insulating Gas Revenue (million) Forecast, by Application 2019 & 2032
- Table 37: Rest of Middle East & Africa Environmentally Friendly Insulating Gas Revenue (million) Forecast, by Application 2019 & 2032
- Table 38: Global Environmentally Friendly Insulating Gas Revenue million Forecast, by Application 2019 & 2032
- Table 39: Global Environmentally Friendly Insulating Gas Revenue million Forecast, by Types 2019 & 2032
- Table 40: Global Environmentally Friendly Insulating Gas Revenue million Forecast, by Country 2019 & 2032
- Table 41: China Environmentally Friendly Insulating Gas Revenue (million) Forecast, by Application 2019 & 2032
- Table 42: India Environmentally Friendly Insulating Gas Revenue (million) Forecast, by Application 2019 & 2032
- Table 43: Japan Environmentally Friendly Insulating Gas Revenue (million) Forecast, by Application 2019 & 2032
- Table 44: South Korea Environmentally Friendly Insulating Gas Revenue (million) Forecast, by Application 2019 & 2032
- Table 45: ASEAN Environmentally Friendly Insulating Gas Revenue (million) Forecast, by Application 2019 & 2032
- Table 46: Oceania Environmentally Friendly Insulating Gas Revenue (million) Forecast, by Application 2019 & 2032
- Table 47: Rest of Asia Pacific Environmentally Friendly Insulating Gas Revenue (million) Forecast, by Application 2019 & 2032
Frequently Asked Questions
1. What is the projected Compound Annual Growth Rate (CAGR) of the Environmentally Friendly Insulating Gas?
The projected CAGR is approximately 6%.
2. Which companies are prominent players in the Environmentally Friendly Insulating Gas?
Key companies in the market include Air Products, Huate Gas, Electronic Fluorocarbons, ARCAD Ophtha, Praxair, Linde, 3M, Beijing Yuji Science & Technology, Sanming Hexafluo Chemicals, GE.
3. What are the main segments of the Environmentally Friendly Insulating Gas?
The market segments include Application, Types.
4. Can you provide details about the market size?
The market size is estimated to be USD 6222.2 million as of 2022.
5. What are some drivers contributing to market growth?
N/A
6. What are the notable trends driving market growth?
N/A
7. Are there any restraints impacting market growth?
N/A
8. Can you provide examples of recent developments in the market?
N/A
9. What pricing options are available for accessing the report?
Pricing options include single-user, multi-user, and enterprise licenses priced at USD 4900.00, USD 7350.00, and USD 9800.00 respectively.
10. Is the market size provided in terms of value or volume?
The market size is provided in terms of value, measured in million.
11. Are there any specific market keywords associated with the report?
Yes, the market keyword associated with the report is "Environmentally Friendly Insulating Gas," which aids in identifying and referencing the specific market segment covered.
12. How do I determine which pricing option suits my needs best?
The pricing options vary based on user requirements and access needs. Individual users may opt for single-user licenses, while businesses requiring broader access may choose multi-user or enterprise licenses for cost-effective access to the report.
13. Are there any additional resources or data provided in the Environmentally Friendly Insulating Gas report?
While the report offers comprehensive insights, it's advisable to review the specific contents or supplementary materials provided to ascertain if additional resources or data are available.
14. How can I stay updated on further developments or reports in the Environmentally Friendly Insulating Gas?
To stay informed about further developments, trends, and reports in the Environmentally Friendly Insulating Gas, consider subscribing to industry newsletters, following relevant companies and organizations, or regularly checking reputable industry news sources and publications.
Methodology
Step 1 - Identification of Relevant Samples Size from Population Database


Step 2 - Approaches for Defining Global Market Size (Value, Volume* & Price*)

Note*: In applicable scenarios
Step 3 - Data Sources
Primary Research
- Web Analytics
- Survey Reports
- Research Institute
- Latest Research Reports
- Opinion Leaders
Secondary Research
- Annual Reports
- White Paper
- Latest Press Release
- Industry Association
- Paid Database
- Investor Presentations

Step 4 - Data Triangulation
Involves using different sources of information in order to increase the validity of a study
These sources are likely to be stakeholders in a program - participants, other researchers, program staff, other community members, and so on.
Then we put all data in single framework & apply various statistical tools to find out the dynamic on the market.
During the analysis stage, feedback from the stakeholder groups would be compared to determine areas of agreement as well as areas of divergence
