

Key Insights
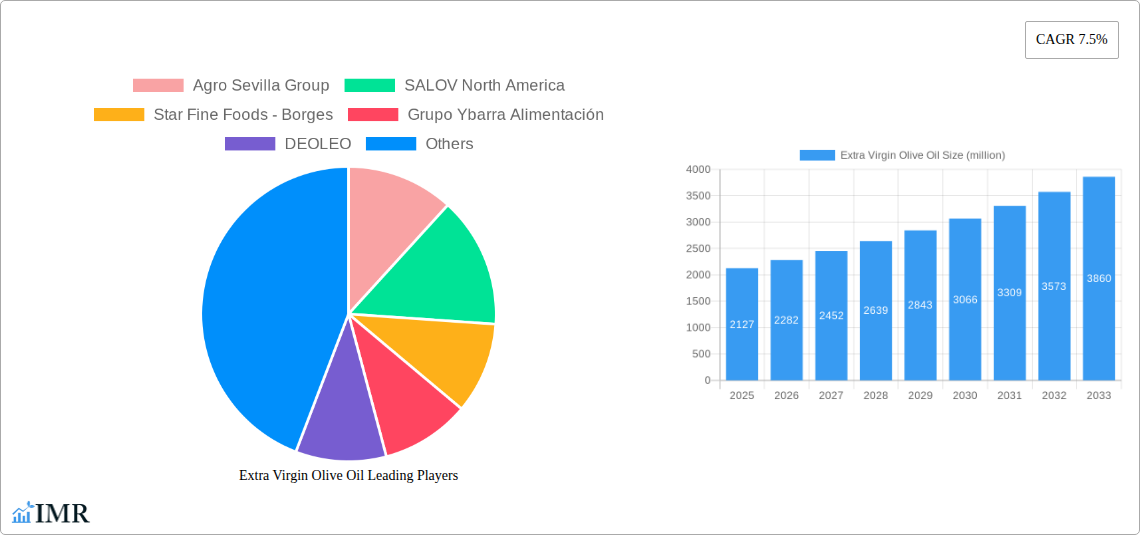
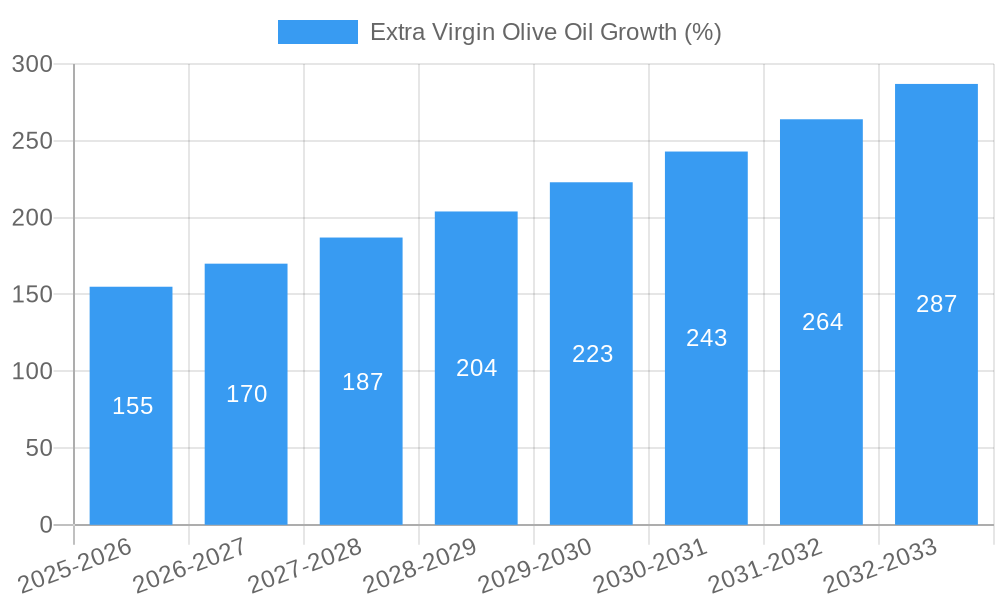
The global extra virgin olive oil (EVOO) market, currently valued at approximately $2.127 billion (2025), is projected to experience robust growth, with a compound annual growth rate (CAGR) of 7.5% from 2025 to 2033. This expansion is driven by several key factors. Increasing consumer awareness of the health benefits associated with EVOO, including its rich antioxidant properties and positive impact on cardiovascular health, fuels demand. The rising popularity of Mediterranean diets globally further contributes to market growth, as EVOO is a cornerstone ingredient. Furthermore, the growing demand for premium and organic EVOO products reflects a shift towards healthier and more sustainable food choices. Premiumization trends, coupled with innovative product packaging and distribution strategies, are enhancing the market's appeal to a wider consumer base. While potential supply chain disruptions and fluctuations in olive harvests could pose challenges, the overall market outlook remains positive, indicating a significant expansion in the coming years.
However, the market faces certain challenges. Price volatility, influenced by weather patterns affecting olive production and global economic conditions, can impact market stability. Competition from other cooking oils, particularly those with lower price points, also presents a hurdle. Addressing these challenges requires producers to focus on building strong supply chains, diversifying production regions, and actively promoting the unique health benefits and quality of EVOO. This will ensure the market's long-term sustainability and ability to cater to the growing demand for premium, high-quality products. Strategic partnerships, focusing on sustainability and traceability, also provide avenues for market growth. The presence of established players like Agro Sevilla Group, SALOV North America, and Deoleo indicates a competitive yet mature market structure that continues to adapt and innovate.
Extra Virgin Olive Oil Market Report: 2019-2033
This comprehensive report provides a detailed analysis of the Extra Virgin Olive Oil (EVOO) market, encompassing historical data (2019-2024), current estimates (2025), and future forecasts (2025-2033). The report delves into market dynamics, growth trends, regional dominance, product landscapes, and key players, offering invaluable insights for industry professionals, investors, and stakeholders. The parent market is the overall olive oil market, while the child market is specifically the extra virgin segment. The report analyzes this lucrative niche within a larger context, providing a holistic perspective on market trends and opportunities. Market values are expressed in millions of units.
Extra Virgin Olive Oil Market Dynamics & Structure
The global EVOO market is characterized by moderate concentration, with several key players holding significant market share. However, the landscape is dynamic, influenced by technological innovation in extraction and processing, evolving regulatory frameworks regarding labeling and quality standards, and the emergence of competitive substitutes like avocado oil and other healthy fats. Consumer demographics play a key role, with health-conscious consumers driving demand for high-quality EVOO. Mergers and acquisitions (M&A) activity has been relatively modest in recent years but is expected to increase as larger players seek to consolidate market share.
- Market Concentration: The top 5 players account for approximately xx% of the global market in 2025.
- Technological Innovation: Advances in extraction techniques are improving yield and quality, while innovations in packaging are enhancing shelf life and reducing waste. Barriers to innovation include high upfront investment costs and the need for specialized expertise.
- Regulatory Framework: Stringent regulations regarding labeling and quality standards vary across regions, impacting market access and competition.
- Competitive Substitutes: Growth of alternative healthy oils presents a challenge, necessitating focused marketing efforts highlighting EVOO's unique nutritional and sensory benefits.
- End-User Demographics: Health-conscious millennials and Gen Z are key drivers of growth, increasing demand for premium EVOO.
- M&A Trends: xx M&A deals were recorded between 2019 and 2024, with a projected increase to xx deals by 2033.
Extra Virgin Olive Oil Growth Trends & Insights
The global EVOO market experienced a CAGR of xx% during the historical period (2019-2024), reaching an estimated value of xx million units in 2025. This growth is driven by increasing consumer awareness of the health benefits of EVOO, coupled with rising disposable incomes in emerging markets. Technological disruptions, such as improved extraction methods and sophisticated packaging, are enhancing product quality and availability. Consumer behavior shifts towards premiumization and a greater appreciation for authenticity and provenance are further fueling market expansion. Market penetration in key regions remains relatively low, suggesting significant growth potential in the forecast period (2025-2033). The projected CAGR for 2025-2033 is estimated at xx%, leading to an anticipated market value of xx million units by 2033.
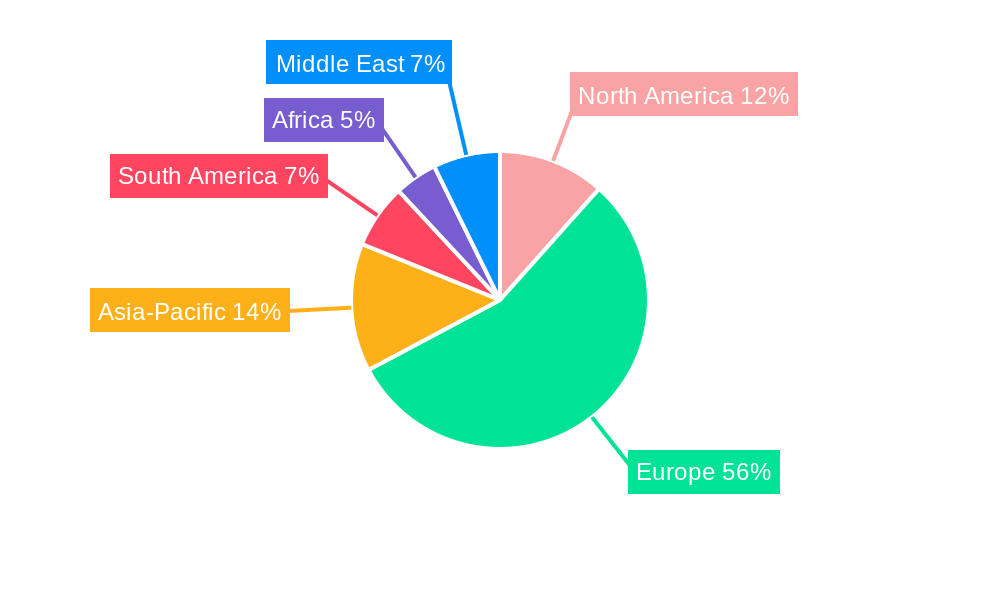
Dominant Regions, Countries, or Segments in Extra Virgin Olive Oil
The Mediterranean region, particularly Spain, Italy, and Greece, remains the dominant producer and consumer of EVOO. However, emerging markets in Asia and North America are exhibiting strong growth potential, driven by increasing health awareness and expanding distribution networks.
- Key Drivers:
- Economic policies: Government support for olive farming and export promotion in producing countries.
- Infrastructure: Improved logistics and distribution networks facilitate market penetration.
- Consumer Preferences: Growing demand for premium, high-quality EVOO.
- Dominance Factors: Spain holds the largest market share due to its extensive olive groves and established production infrastructure. Italy and Greece maintain strong positions based on their reputation for high-quality EVOO. Growth potential in Asia is largely due to increasing awareness of EVOO's health benefits among consumers.
Extra Virgin Olive Oil Product Landscape
The EVOO product landscape is characterized by a wide range of offerings, from standard grades to premium, single-origin varieties. Product innovations focus on enhancing quality, extending shelf life, and adding value through unique flavor profiles and convenient packaging formats. Technological advancements in extraction and processing result in improved oil quality and reduced waste. Unique selling propositions (USPs) often center on the origin and production methods, emphasizing sustainable and ethical practices.
Key Drivers, Barriers & Challenges in Extra Virgin Olive Oil
Key Drivers:
- Increasing consumer awareness of health benefits.
- Growing demand for premium and specialty EVOOs.
- Expansion of distribution channels and e-commerce.
Challenges:
- Climate change impacting olive yields and oil quality.
- Fluctuations in olive prices due to weather conditions and global supply chain disruptions.
- Intense competition from substitute oils. The impact of this competition reduced market growth by an estimated xx% in 2024.
Emerging Opportunities in Extra Virgin Olive Oil
- Untapped Markets: Expanding into new markets in Africa and South America.
- Innovative Applications: Growing use of EVOO in cosmetics and pharmaceuticals.
- Evolving Consumer Preferences: Catering to growing demand for sustainable and ethically sourced EVOO.
Growth Accelerators in the Extra Virgin Olive Oil Industry
Technological advancements in extraction and processing are driving efficiency and quality improvements. Strategic partnerships between producers and distributors are enhancing market reach and distribution. Expansion into new markets and product diversification are further fueling market growth.
Key Players Shaping the Extra Virgin Olive Oil Market
- Agro Sevilla Group
- SALOV North America
- Star Fine Foods - Borges
- Grupo Ybarra Alimentación
- DEOLEO
- SOVENA
- Carapelli Firenze
Notable Milestones in Extra Virgin Olive Oil Sector
- 2020: Increased consumer demand for EVOO during the COVID-19 pandemic.
- 2022: Launch of several new sustainable and organic EVOO brands.
- 2023: Several key players invested heavily in improving supply chains and optimizing production efficiency.
In-Depth Extra Virgin Olive Oil Market Outlook
The future of the EVOO market looks promising, driven by sustained consumer demand and ongoing innovations in production and marketing. Strategic partnerships, investments in sustainable practices, and expansion into new markets will shape future growth. The market is projected to witness significant expansion, driven by increasing health consciousness and the premiumization of EVOO. The focus will be on creating value-added products and leveraging digital platforms for improved market penetration and brand building.
Extra Virgin Olive Oil Segmentation
-
1. Application
- 1.1. Cooking
- 1.2. Cosmetics
- 1.3. Pharmaceutical
- 1.4. Fuel
-
2. Type
- 2.1. Cold Pressed
- 2.2. Flavored
- 2.3. Virgin
- 2.4. Blended
- 2.5. Others
Extra Virgin Olive Oil Segmentation By Geography
-
1. North America
- 1.1. United States
- 1.2. Canada
- 1.3. Mexico
-
2. South America
- 2.1. Brazil
- 2.2. Argentina
- 2.3. Rest of South America
-
3. Europe
- 3.1. United Kingdom
- 3.2. Germany
- 3.3. France
- 3.4. Italy
- 3.5. Spain
- 3.6. Russia
- 3.7. Benelux
- 3.8. Nordics
- 3.9. Rest of Europe
-
4. Middle East & Africa
- 4.1. Turkey
- 4.2. Israel
- 4.3. GCC
- 4.4. North Africa
- 4.5. South Africa
- 4.6. Rest of Middle East & Africa
-
5. Asia Pacific
- 5.1. China
- 5.2. India
- 5.3. Japan
- 5.4. South Korea
- 5.5. ASEAN
- 5.6. Oceania
- 5.7. Rest of Asia Pacific
Extra Virgin Olive Oil REPORT HIGHLIGHTS
| Aspects | Details |
|---|---|
| Study Period | 2019-2033 |
| Base Year | 2024 |
| Estimated Year | 2025 |
| Forecast Period | 2025-2033 |
| Historical Period | 2019-2024 |
| Growth Rate | CAGR of 7.5% from 2019-2033 |
| Segmentation |
|
Table of Contents
- 1. Introduction
- 1.1. Research Scope
- 1.2. Market Segmentation
- 1.3. Research Methodology
- 1.4. Definitions and Assumptions
- 2. Executive Summary
- 2.1. Introduction
- 3. Market Dynamics
- 3.1. Introduction
- 3.2. Market Drivers
- 3.3. Market Restrains
- 3.4. Market Trends
- 4. Market Factor Analysis
- 4.1. Porters Five Forces
- 4.2. Supply/Value Chain
- 4.3. PESTEL analysis
- 4.4. Market Entropy
- 4.5. Patent/Trademark Analysis
- 5. Global Extra Virgin Olive Oil Analysis, Insights and Forecast, 2019-2031
- 5.1. Market Analysis, Insights and Forecast - by Application
- 5.1.1. Cooking
- 5.1.2. Cosmetics
- 5.1.3. Pharmaceutical
- 5.1.4. Fuel
- 5.2. Market Analysis, Insights and Forecast - by Type
- 5.2.1. Cold Pressed
- 5.2.2. Flavored
- 5.2.3. Virgin
- 5.2.4. Blended
- 5.2.5. Others
- 5.3. Market Analysis, Insights and Forecast - by Region
- 5.3.1. North America
- 5.3.2. South America
- 5.3.3. Europe
- 5.3.4. Middle East & Africa
- 5.3.5. Asia Pacific
- 5.1. Market Analysis, Insights and Forecast - by Application
- 6. North America Extra Virgin Olive Oil Analysis, Insights and Forecast, 2019-2031
- 6.1. Market Analysis, Insights and Forecast - by Application
- 6.1.1. Cooking
- 6.1.2. Cosmetics
- 6.1.3. Pharmaceutical
- 6.1.4. Fuel
- 6.2. Market Analysis, Insights and Forecast - by Type
- 6.2.1. Cold Pressed
- 6.2.2. Flavored
- 6.2.3. Virgin
- 6.2.4. Blended
- 6.2.5. Others
- 6.1. Market Analysis, Insights and Forecast - by Application
- 7. South America Extra Virgin Olive Oil Analysis, Insights and Forecast, 2019-2031
- 7.1. Market Analysis, Insights and Forecast - by Application
- 7.1.1. Cooking
- 7.1.2. Cosmetics
- 7.1.3. Pharmaceutical
- 7.1.4. Fuel
- 7.2. Market Analysis, Insights and Forecast - by Type
- 7.2.1. Cold Pressed
- 7.2.2. Flavored
- 7.2.3. Virgin
- 7.2.4. Blended
- 7.2.5. Others
- 7.1. Market Analysis, Insights and Forecast - by Application
- 8. Europe Extra Virgin Olive Oil Analysis, Insights and Forecast, 2019-2031
- 8.1. Market Analysis, Insights and Forecast - by Application
- 8.1.1. Cooking
- 8.1.2. Cosmetics
- 8.1.3. Pharmaceutical
- 8.1.4. Fuel
- 8.2. Market Analysis, Insights and Forecast - by Type
- 8.2.1. Cold Pressed
- 8.2.2. Flavored
- 8.2.3. Virgin
- 8.2.4. Blended
- 8.2.5. Others
- 8.1. Market Analysis, Insights and Forecast - by Application
- 9. Middle East & Africa Extra Virgin Olive Oil Analysis, Insights and Forecast, 2019-2031
- 9.1. Market Analysis, Insights and Forecast - by Application
- 9.1.1. Cooking
- 9.1.2. Cosmetics
- 9.1.3. Pharmaceutical
- 9.1.4. Fuel
- 9.2. Market Analysis, Insights and Forecast - by Type
- 9.2.1. Cold Pressed
- 9.2.2. Flavored
- 9.2.3. Virgin
- 9.2.4. Blended
- 9.2.5. Others
- 9.1. Market Analysis, Insights and Forecast - by Application
- 10. Asia Pacific Extra Virgin Olive Oil Analysis, Insights and Forecast, 2019-2031
- 10.1. Market Analysis, Insights and Forecast - by Application
- 10.1.1. Cooking
- 10.1.2. Cosmetics
- 10.1.3. Pharmaceutical
- 10.1.4. Fuel
- 10.2. Market Analysis, Insights and Forecast - by Type
- 10.2.1. Cold Pressed
- 10.2.2. Flavored
- 10.2.3. Virgin
- 10.2.4. Blended
- 10.2.5. Others
- 10.1. Market Analysis, Insights and Forecast - by Application
- 11. Competitive Analysis
- 11.1. Global Market Share Analysis 2024
- 11.2. Company Profiles
- 11.2.1 Agro Sevilla Group
- 11.2.1.1. Overview
- 11.2.1.2. Products
- 11.2.1.3. SWOT Analysis
- 11.2.1.4. Recent Developments
- 11.2.1.5. Financials (Based on Availability)
- 11.2.2 SALOV North America
- 11.2.2.1. Overview
- 11.2.2.2. Products
- 11.2.2.3. SWOT Analysis
- 11.2.2.4. Recent Developments
- 11.2.2.5. Financials (Based on Availability)
- 11.2.3 Star Fine Foods - Borges
- 11.2.3.1. Overview
- 11.2.3.2. Products
- 11.2.3.3. SWOT Analysis
- 11.2.3.4. Recent Developments
- 11.2.3.5. Financials (Based on Availability)
- 11.2.4 Grupo Ybarra Alimentación
- 11.2.4.1. Overview
- 11.2.4.2. Products
- 11.2.4.3. SWOT Analysis
- 11.2.4.4. Recent Developments
- 11.2.4.5. Financials (Based on Availability)
- 11.2.5 DEOLEO
- 11.2.5.1. Overview
- 11.2.5.2. Products
- 11.2.5.3. SWOT Analysis
- 11.2.5.4. Recent Developments
- 11.2.5.5. Financials (Based on Availability)
- 11.2.6 SOVENA
- 11.2.6.1. Overview
- 11.2.6.2. Products
- 11.2.6.3. SWOT Analysis
- 11.2.6.4. Recent Developments
- 11.2.6.5. Financials (Based on Availability)
- 11.2.7 Carapelli Firenze
- 11.2.7.1. Overview
- 11.2.7.2. Products
- 11.2.7.3. SWOT Analysis
- 11.2.7.4. Recent Developments
- 11.2.7.5. Financials (Based on Availability)
- 11.2.1 Agro Sevilla Group
List of Figures
- Figure 1: Global Extra Virgin Olive Oil Revenue Breakdown (million, %) by Region 2024 & 2032
- Figure 2: North America Extra Virgin Olive Oil Revenue (million), by Application 2024 & 2032
- Figure 3: North America Extra Virgin Olive Oil Revenue Share (%), by Application 2024 & 2032
- Figure 4: North America Extra Virgin Olive Oil Revenue (million), by Type 2024 & 2032
- Figure 5: North America Extra Virgin Olive Oil Revenue Share (%), by Type 2024 & 2032
- Figure 6: North America Extra Virgin Olive Oil Revenue (million), by Country 2024 & 2032
- Figure 7: North America Extra Virgin Olive Oil Revenue Share (%), by Country 2024 & 2032
- Figure 8: South America Extra Virgin Olive Oil Revenue (million), by Application 2024 & 2032
- Figure 9: South America Extra Virgin Olive Oil Revenue Share (%), by Application 2024 & 2032
- Figure 10: South America Extra Virgin Olive Oil Revenue (million), by Type 2024 & 2032
- Figure 11: South America Extra Virgin Olive Oil Revenue Share (%), by Type 2024 & 2032
- Figure 12: South America Extra Virgin Olive Oil Revenue (million), by Country 2024 & 2032
- Figure 13: South America Extra Virgin Olive Oil Revenue Share (%), by Country 2024 & 2032
- Figure 14: Europe Extra Virgin Olive Oil Revenue (million), by Application 2024 & 2032
- Figure 15: Europe Extra Virgin Olive Oil Revenue Share (%), by Application 2024 & 2032
- Figure 16: Europe Extra Virgin Olive Oil Revenue (million), by Type 2024 & 2032
- Figure 17: Europe Extra Virgin Olive Oil Revenue Share (%), by Type 2024 & 2032
- Figure 18: Europe Extra Virgin Olive Oil Revenue (million), by Country 2024 & 2032
- Figure 19: Europe Extra Virgin Olive Oil Revenue Share (%), by Country 2024 & 2032
- Figure 20: Middle East & Africa Extra Virgin Olive Oil Revenue (million), by Application 2024 & 2032
- Figure 21: Middle East & Africa Extra Virgin Olive Oil Revenue Share (%), by Application 2024 & 2032
- Figure 22: Middle East & Africa Extra Virgin Olive Oil Revenue (million), by Type 2024 & 2032
- Figure 23: Middle East & Africa Extra Virgin Olive Oil Revenue Share (%), by Type 2024 & 2032
- Figure 24: Middle East & Africa Extra Virgin Olive Oil Revenue (million), by Country 2024 & 2032
- Figure 25: Middle East & Africa Extra Virgin Olive Oil Revenue Share (%), by Country 2024 & 2032
- Figure 26: Asia Pacific Extra Virgin Olive Oil Revenue (million), by Application 2024 & 2032
- Figure 27: Asia Pacific Extra Virgin Olive Oil Revenue Share (%), by Application 2024 & 2032
- Figure 28: Asia Pacific Extra Virgin Olive Oil Revenue (million), by Type 2024 & 2032
- Figure 29: Asia Pacific Extra Virgin Olive Oil Revenue Share (%), by Type 2024 & 2032
- Figure 30: Asia Pacific Extra Virgin Olive Oil Revenue (million), by Country 2024 & 2032
- Figure 31: Asia Pacific Extra Virgin Olive Oil Revenue Share (%), by Country 2024 & 2032
List of Tables
- Table 1: Global Extra Virgin Olive Oil Revenue million Forecast, by Region 2019 & 2032
- Table 2: Global Extra Virgin Olive Oil Revenue million Forecast, by Application 2019 & 2032
- Table 3: Global Extra Virgin Olive Oil Revenue million Forecast, by Type 2019 & 2032
- Table 4: Global Extra Virgin Olive Oil Revenue million Forecast, by Region 2019 & 2032
- Table 5: Global Extra Virgin Olive Oil Revenue million Forecast, by Application 2019 & 2032
- Table 6: Global Extra Virgin Olive Oil Revenue million Forecast, by Type 2019 & 2032
- Table 7: Global Extra Virgin Olive Oil Revenue million Forecast, by Country 2019 & 2032
- Table 8: United States Extra Virgin Olive Oil Revenue (million) Forecast, by Application 2019 & 2032
- Table 9: Canada Extra Virgin Olive Oil Revenue (million) Forecast, by Application 2019 & 2032
- Table 10: Mexico Extra Virgin Olive Oil Revenue (million) Forecast, by Application 2019 & 2032
- Table 11: Global Extra Virgin Olive Oil Revenue million Forecast, by Application 2019 & 2032
- Table 12: Global Extra Virgin Olive Oil Revenue million Forecast, by Type 2019 & 2032
- Table 13: Global Extra Virgin Olive Oil Revenue million Forecast, by Country 2019 & 2032
- Table 14: Brazil Extra Virgin Olive Oil Revenue (million) Forecast, by Application 2019 & 2032
- Table 15: Argentina Extra Virgin Olive Oil Revenue (million) Forecast, by Application 2019 & 2032
- Table 16: Rest of South America Extra Virgin Olive Oil Revenue (million) Forecast, by Application 2019 & 2032
- Table 17: Global Extra Virgin Olive Oil Revenue million Forecast, by Application 2019 & 2032
- Table 18: Global Extra Virgin Olive Oil Revenue million Forecast, by Type 2019 & 2032
- Table 19: Global Extra Virgin Olive Oil Revenue million Forecast, by Country 2019 & 2032
- Table 20: United Kingdom Extra Virgin Olive Oil Revenue (million) Forecast, by Application 2019 & 2032
- Table 21: Germany Extra Virgin Olive Oil Revenue (million) Forecast, by Application 2019 & 2032
- Table 22: France Extra Virgin Olive Oil Revenue (million) Forecast, by Application 2019 & 2032
- Table 23: Italy Extra Virgin Olive Oil Revenue (million) Forecast, by Application 2019 & 2032
- Table 24: Spain Extra Virgin Olive Oil Revenue (million) Forecast, by Application 2019 & 2032
- Table 25: Russia Extra Virgin Olive Oil Revenue (million) Forecast, by Application 2019 & 2032
- Table 26: Benelux Extra Virgin Olive Oil Revenue (million) Forecast, by Application 2019 & 2032
- Table 27: Nordics Extra Virgin Olive Oil Revenue (million) Forecast, by Application 2019 & 2032
- Table 28: Rest of Europe Extra Virgin Olive Oil Revenue (million) Forecast, by Application 2019 & 2032
- Table 29: Global Extra Virgin Olive Oil Revenue million Forecast, by Application 2019 & 2032
- Table 30: Global Extra Virgin Olive Oil Revenue million Forecast, by Type 2019 & 2032
- Table 31: Global Extra Virgin Olive Oil Revenue million Forecast, by Country 2019 & 2032
- Table 32: Turkey Extra Virgin Olive Oil Revenue (million) Forecast, by Application 2019 & 2032
- Table 33: Israel Extra Virgin Olive Oil Revenue (million) Forecast, by Application 2019 & 2032
- Table 34: GCC Extra Virgin Olive Oil Revenue (million) Forecast, by Application 2019 & 2032
- Table 35: North Africa Extra Virgin Olive Oil Revenue (million) Forecast, by Application 2019 & 2032
- Table 36: South Africa Extra Virgin Olive Oil Revenue (million) Forecast, by Application 2019 & 2032
- Table 37: Rest of Middle East & Africa Extra Virgin Olive Oil Revenue (million) Forecast, by Application 2019 & 2032
- Table 38: Global Extra Virgin Olive Oil Revenue million Forecast, by Application 2019 & 2032
- Table 39: Global Extra Virgin Olive Oil Revenue million Forecast, by Type 2019 & 2032
- Table 40: Global Extra Virgin Olive Oil Revenue million Forecast, by Country 2019 & 2032
- Table 41: China Extra Virgin Olive Oil Revenue (million) Forecast, by Application 2019 & 2032
- Table 42: India Extra Virgin Olive Oil Revenue (million) Forecast, by Application 2019 & 2032
- Table 43: Japan Extra Virgin Olive Oil Revenue (million) Forecast, by Application 2019 & 2032
- Table 44: South Korea Extra Virgin Olive Oil Revenue (million) Forecast, by Application 2019 & 2032
- Table 45: ASEAN Extra Virgin Olive Oil Revenue (million) Forecast, by Application 2019 & 2032
- Table 46: Oceania Extra Virgin Olive Oil Revenue (million) Forecast, by Application 2019 & 2032
- Table 47: Rest of Asia Pacific Extra Virgin Olive Oil Revenue (million) Forecast, by Application 2019 & 2032
Frequently Asked Questions
1. What is the projected Compound Annual Growth Rate (CAGR) of the Extra Virgin Olive Oil?
The projected CAGR is approximately 7.5%.
2. Which companies are prominent players in the Extra Virgin Olive Oil?
Key companies in the market include Agro Sevilla Group, SALOV North America, Star Fine Foods - Borges, Grupo Ybarra Alimentación, DEOLEO, SOVENA, Carapelli Firenze.
3. What are the main segments of the Extra Virgin Olive Oil?
The market segments include Application, Type.
4. Can you provide details about the market size?
The market size is estimated to be USD 2127 million as of 2022.
5. What are some drivers contributing to market growth?
N/A
6. What are the notable trends driving market growth?
N/A
7. Are there any restraints impacting market growth?
N/A
8. Can you provide examples of recent developments in the market?
N/A
9. What pricing options are available for accessing the report?
Pricing options include single-user, multi-user, and enterprise licenses priced at USD 2900.00, USD 4350.00, and USD 5800.00 respectively.
10. Is the market size provided in terms of value or volume?
The market size is provided in terms of value, measured in million.
11. Are there any specific market keywords associated with the report?
Yes, the market keyword associated with the report is "Extra Virgin Olive Oil," which aids in identifying and referencing the specific market segment covered.
12. How do I determine which pricing option suits my needs best?
The pricing options vary based on user requirements and access needs. Individual users may opt for single-user licenses, while businesses requiring broader access may choose multi-user or enterprise licenses for cost-effective access to the report.
13. Are there any additional resources or data provided in the Extra Virgin Olive Oil report?
While the report offers comprehensive insights, it's advisable to review the specific contents or supplementary materials provided to ascertain if additional resources or data are available.
14. How can I stay updated on further developments or reports in the Extra Virgin Olive Oil?
To stay informed about further developments, trends, and reports in the Extra Virgin Olive Oil, consider subscribing to industry newsletters, following relevant companies and organizations, or regularly checking reputable industry news sources and publications.
Methodology
Step 1 - Identification of Relevant Samples Size from Population Database


Step 2 - Approaches for Defining Global Market Size (Value, Volume* & Price*)

Note*: In applicable scenarios
Step 3 - Data Sources
Primary Research
- Web Analytics
- Survey Reports
- Research Institute
- Latest Research Reports
- Opinion Leaders
Secondary Research
- Annual Reports
- White Paper
- Latest Press Release
- Industry Association
- Paid Database
- Investor Presentations

Step 4 - Data Triangulation
Involves using different sources of information in order to increase the validity of a study
These sources are likely to be stakeholders in a program - participants, other researchers, program staff, other community members, and so on.
Then we put all data in single framework & apply various statistical tools to find out the dynamic on the market.
During the analysis stage, feedback from the stakeholder groups would be compared to determine areas of agreement as well as areas of divergence
