

Key Insights
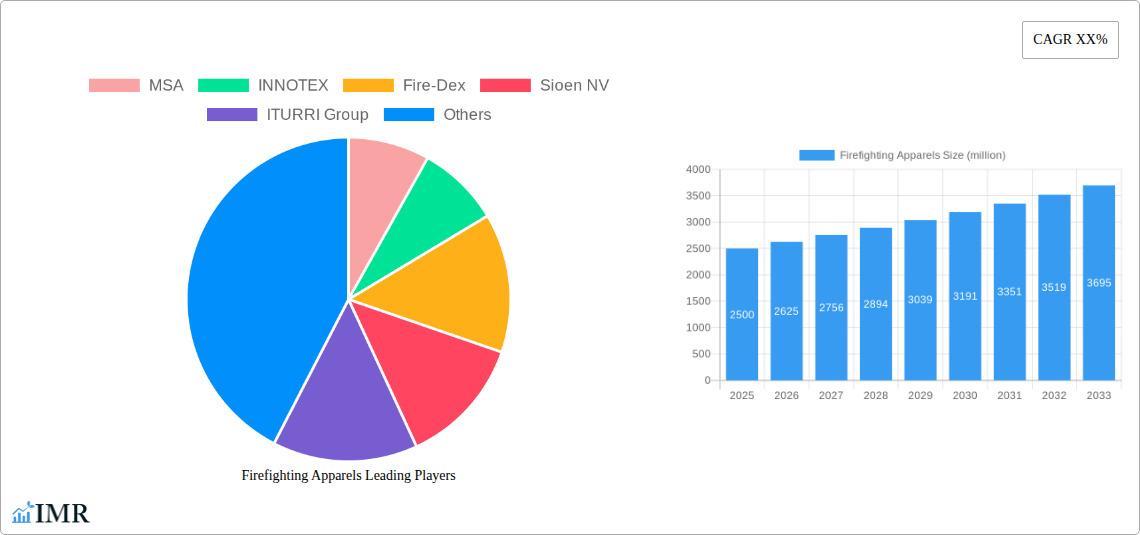
The global firefighting apparel market is experiencing robust growth, driven by increasing urbanization, industrialization, and the rising frequency of wildfires and other fire-related incidents. The market is projected to witness a Compound Annual Growth Rate (CAGR) of approximately 5-7% between 2025 and 2033, expanding from an estimated market size of $2.5 billion in 2025 to approximately $3.8 billion by 2033. This growth is fueled by several key factors, including stringent safety regulations mandating the use of advanced firefighting apparel, technological advancements leading to the development of lighter, more durable, and heat-resistant materials, and a growing awareness of the importance of firefighter safety among government and private organizations. Major market players such as MSA, Honeywell, and Rosenbauer are constantly innovating to enhance product features, including improved thermal protection, enhanced mobility, and advanced visibility solutions.
However, the market also faces certain restraints. The high cost of advanced firefighting apparel, particularly those incorporating cutting-edge technologies, can limit adoption, especially in developing economies with constrained budgets. Furthermore, the market's growth is somewhat dependent on the fluctuating demand for firefighting services, which is influenced by factors such as the number of fire incidents and government funding allocations for fire safety infrastructure. Nevertheless, ongoing research and development efforts focusing on improving comfort, durability, and protective capabilities are anticipated to drive market expansion in the forecast period. The market is segmented by apparel type (e.g., coats, pants, helmets, gloves), material (e.g., Nomex, Kevlar, PBI), and end-user (e.g., municipal fire departments, industrial fire services). The regional distribution is expected to be dominated by North America and Europe initially, with Asia-Pacific exhibiting significant growth potential in the coming years.
Firefighting Apparels Market Report: 2019-2033
This comprehensive report provides an in-depth analysis of the global Firefighting Apparels market, encompassing historical data (2019-2024), current estimates (2025), and future projections (2025-2033). The report segments the market by product type, end-user, and geography, offering granular insights for strategic decision-making. With a focus on key players like MSA, INNOTEX, Fire-Dex, and others, this report is a vital resource for industry professionals, investors, and anyone seeking to understand this critical sector. The market value is projected to reach xx million units by 2033.
Firefighting Apparels Market Dynamics & Structure
This section analyzes the competitive landscape of the Firefighting Apparels market, focusing on market concentration, technological advancements, regulatory changes, and industry trends. The report assesses the impact of mergers and acquisitions (M&A) activities on market dynamics, providing quantitative and qualitative insights into market share distribution and growth drivers. The parent market (Personal Protective Equipment - PPE) and the child market (Fire Safety Equipment) are also considered for a comprehensive understanding.
- Market Concentration: The market is moderately concentrated, with the top 5 players holding an estimated xx% market share in 2025. This concentration is expected to shift slightly by 2033 due to ongoing M&A activities and new entrants.
- Technological Innovation: Advancements in materials science (e.g., lighter, more durable fabrics) and thermal protection technologies are driving market growth. However, high R&D costs pose a barrier to entry for smaller players.
- Regulatory Framework: Stringent safety regulations (e.g., EN ISO standards) influence product design and manufacturing. Changes in these regulations can significantly impact market dynamics.
- Competitive Substitutes: Limited viable substitutes exist, solidifying the market's position. However, cost pressures from alternative materials are emerging.
- End-User Demographics: The primary end-users are professional firefighters, industrial workers, and military personnel. Growth is driven by increasing demand from developing economies and stricter safety norms.
- M&A Trends: The past five years have witnessed xx M&A deals, with an average deal value of xx million units. Consolidation is expected to continue, driving increased market concentration.
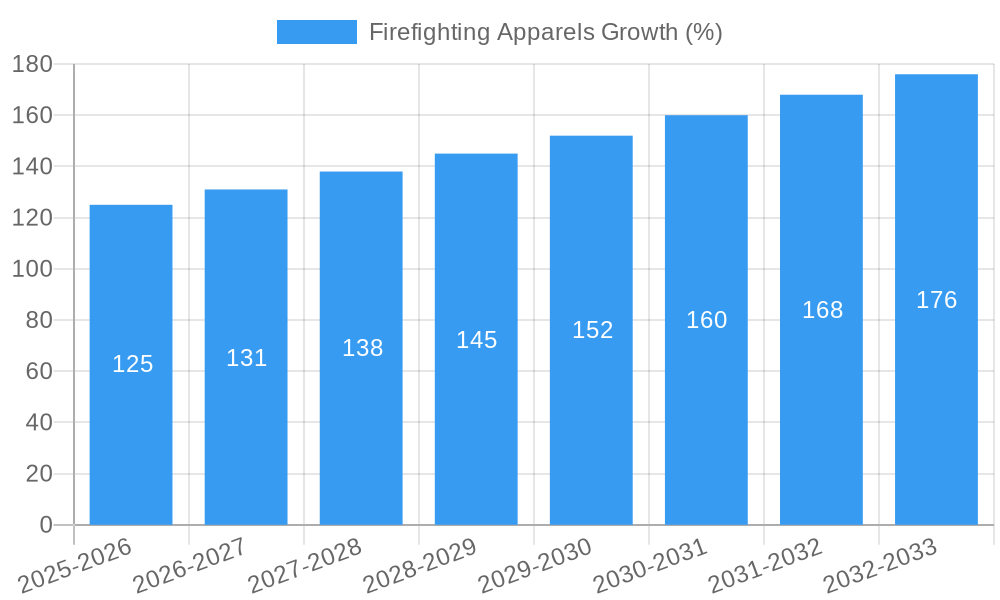
Firefighting Apparels Growth Trends & Insights
This section delves into the historical and projected growth trajectory of the Firefighting Apparels market. It employs a robust analytical framework (XXX - details of the framework to be inserted here) to forecast market size, adoption rates, and technological disruptions influencing market behavior.
The global Firefighting Apparels market exhibited a CAGR of xx% during 2019-2024, reaching xx million units in 2024. Driven by increasing awareness of firefighter safety and rising investments in fire safety infrastructure, the market is anticipated to expand at a CAGR of xx% between 2025 and 2033. The market penetration rate for advanced firefighting apparel is currently at xx%, with significant potential for growth in developing economies. Technological disruptions, such as the integration of smart sensors and improved breathability features, are accelerating adoption rates. Changes in consumer behavior, favoring lighter, more comfortable, and technologically advanced apparel, are also contributing factors.
Dominant Regions, Countries, or Segments in Firefighting Apparels
This section identifies the leading geographical regions and segments driving market growth. A detailed analysis is provided for each region/segment, highlighting key growth drivers and market dominance factors.
- North America: Dominates the market due to stringent safety regulations, high firefighter-to-population ratios, and robust spending on fire safety equipment. Key drivers include increasing infrastructure development and a high level of awareness regarding firefighter safety.
- Europe: Displays strong growth driven by compliance with EU directives on firefighter safety and a growing focus on firefighter well-being.
- Asia-Pacific: Represents a significant growth opportunity, driven by rapid urbanization, industrialization, and rising disposable incomes. However, lower adoption rates compared to North America and Europe remain a factor.
- Segments: The turnout gear segment holds the largest market share, followed by the structural firefighting apparel segment. The protective clothing segment is showing faster growth.
Firefighting Apparels Product Landscape
Firefighting apparel comprises a range of products, including turnout coats and trousers, structural firefighting suits, wildland firefighting apparel, and specialized garments for hazmat situations. Recent innovations focus on enhanced thermal protection, improved mobility, and increased comfort through lighter materials and improved ventilation systems. Key features include advanced thermal barriers, moisture-wicking fabrics, and integrated communication systems. Unique selling propositions often revolve around superior protection, ergonomic design, and enhanced durability.
Key Drivers, Barriers & Challenges in Firefighting Apparels
Key Drivers:
- Increased awareness of firefighter safety and well-being.
- Stringent government regulations and safety standards.
- Technological advancements in materials and design.
- Growing demand from developing economies.
Challenges & Restraints:
- High raw material costs and manufacturing expenses.
- Stringent quality control and certification processes.
- Intense competition from established players and new entrants.
- Supply chain disruptions due to geopolitical factors (impact xx million units).
Emerging Opportunities in Firefighting Apparels
Emerging opportunities lie in the development of specialized apparel for specific hazards (e.g., wildland fires, chemical spills), integration of advanced technologies like smart sensors and GPS tracking, and expansion into untapped markets in developing countries. The rise of sustainable and eco-friendly materials also presents significant opportunities.
Growth Accelerators in the Firefighting Apparels Industry
Long-term growth will be fueled by continuous innovation in materials science, strategic partnerships between apparel manufacturers and technology providers, and expansion into new geographical markets. The adoption of advanced manufacturing techniques and the development of customized solutions for specific end-user needs will also play a crucial role in accelerating market growth.
Key Players Shaping the Firefighting Apparels Market
- MSA
- INNOTEX
- Fire-Dex
- Sioen NV
- ITURRI Group
- Lakeland Fire
- Rosenbauer
- Honeywell
- TEXPORT
- Taiwan KK Corp
- LION
- Seyntex
- VIKING
- Eagle Technical Products
Notable Milestones in Firefighting Apparels Sector
- 2020, Q4: Introduction of a new generation of Nomex-based turnout gear by MSA Safety, focusing on enhanced breathability and mobility.
- 2022, Q2: Acquisition of a smaller competitor by Lakeland Fire, expanding its product portfolio and market reach.
- 2023, Q1: Launch of a new line of sustainable and eco-friendly firefighting apparel by Sioen NV.
In-Depth Firefighting Apparels Market Outlook
The Firefighting Apparels market is poised for robust growth over the next decade. Continued investments in R&D, increasing adoption of advanced technologies, and expanding demand from emerging economies are expected to drive significant market expansion. Strategic partnerships and acquisitions will further shape the competitive landscape, presenting lucrative opportunities for both established and emerging players. The emphasis on improved firefighter safety and enhanced apparel performance will remain central to market dynamics.
Firefighting Apparels Segmentation
-
1. Application
- 1.1. Indoor Firefighting
- 1.2. Outdoor Firefighting
-
2. Types
- 2.1. Coat
- 2.2. Pants
- 2.3. Helmets
- 2.4. Shoes
- 2.5. Others
Firefighting Apparels Segmentation By Geography
-
1. North America
- 1.1. United States
- 1.2. Canada
- 1.3. Mexico
-
2. South America
- 2.1. Brazil
- 2.2. Argentina
- 2.3. Rest of South America
-
3. Europe
- 3.1. United Kingdom
- 3.2. Germany
- 3.3. France
- 3.4. Italy
- 3.5. Spain
- 3.6. Russia
- 3.7. Benelux
- 3.8. Nordics
- 3.9. Rest of Europe
-
4. Middle East & Africa
- 4.1. Turkey
- 4.2. Israel
- 4.3. GCC
- 4.4. North Africa
- 4.5. South Africa
- 4.6. Rest of Middle East & Africa
-
5. Asia Pacific
- 5.1. China
- 5.2. India
- 5.3. Japan
- 5.4. South Korea
- 5.5. ASEAN
- 5.6. Oceania
- 5.7. Rest of Asia Pacific

Firefighting Apparels REPORT HIGHLIGHTS
| Aspects | Details |
|---|---|
| Study Period | 2019-2033 |
| Base Year | 2024 |
| Estimated Year | 2025 |
| Forecast Period | 2025-2033 |
| Historical Period | 2019-2024 |
| Growth Rate | CAGR of XX% from 2019-2033 |
| Segmentation |
|
Table of Contents
- 1. Introduction
- 1.1. Research Scope
- 1.2. Market Segmentation
- 1.3. Research Methodology
- 1.4. Definitions and Assumptions
- 2. Executive Summary
- 2.1. Introduction
- 3. Market Dynamics
- 3.1. Introduction
- 3.2. Market Drivers
- 3.3. Market Restrains
- 3.4. Market Trends
- 4. Market Factor Analysis
- 4.1. Porters Five Forces
- 4.2. Supply/Value Chain
- 4.3. PESTEL analysis
- 4.4. Market Entropy
- 4.5. Patent/Trademark Analysis
- 5. Global Firefighting Apparels Analysis, Insights and Forecast, 2019-2031
- 5.1. Market Analysis, Insights and Forecast - by Application
- 5.1.1. Indoor Firefighting
- 5.1.2. Outdoor Firefighting
- 5.2. Market Analysis, Insights and Forecast - by Types
- 5.2.1. Coat
- 5.2.2. Pants
- 5.2.3. Helmets
- 5.2.4. Shoes
- 5.2.5. Others
- 5.3. Market Analysis, Insights and Forecast - by Region
- 5.3.1. North America
- 5.3.2. South America
- 5.3.3. Europe
- 5.3.4. Middle East & Africa
- 5.3.5. Asia Pacific
- 5.1. Market Analysis, Insights and Forecast - by Application
- 6. North America Firefighting Apparels Analysis, Insights and Forecast, 2019-2031
- 6.1. Market Analysis, Insights and Forecast - by Application
- 6.1.1. Indoor Firefighting
- 6.1.2. Outdoor Firefighting
- 6.2. Market Analysis, Insights and Forecast - by Types
- 6.2.1. Coat
- 6.2.2. Pants
- 6.2.3. Helmets
- 6.2.4. Shoes
- 6.2.5. Others
- 6.1. Market Analysis, Insights and Forecast - by Application
- 7. South America Firefighting Apparels Analysis, Insights and Forecast, 2019-2031
- 7.1. Market Analysis, Insights and Forecast - by Application
- 7.1.1. Indoor Firefighting
- 7.1.2. Outdoor Firefighting
- 7.2. Market Analysis, Insights and Forecast - by Types
- 7.2.1. Coat
- 7.2.2. Pants
- 7.2.3. Helmets
- 7.2.4. Shoes
- 7.2.5. Others
- 7.1. Market Analysis, Insights and Forecast - by Application
- 8. Europe Firefighting Apparels Analysis, Insights and Forecast, 2019-2031
- 8.1. Market Analysis, Insights and Forecast - by Application
- 8.1.1. Indoor Firefighting
- 8.1.2. Outdoor Firefighting
- 8.2. Market Analysis, Insights and Forecast - by Types
- 8.2.1. Coat
- 8.2.2. Pants
- 8.2.3. Helmets
- 8.2.4. Shoes
- 8.2.5. Others
- 8.1. Market Analysis, Insights and Forecast - by Application
- 9. Middle East & Africa Firefighting Apparels Analysis, Insights and Forecast, 2019-2031
- 9.1. Market Analysis, Insights and Forecast - by Application
- 9.1.1. Indoor Firefighting
- 9.1.2. Outdoor Firefighting
- 9.2. Market Analysis, Insights and Forecast - by Types
- 9.2.1. Coat
- 9.2.2. Pants
- 9.2.3. Helmets
- 9.2.4. Shoes
- 9.2.5. Others
- 9.1. Market Analysis, Insights and Forecast - by Application
- 10. Asia Pacific Firefighting Apparels Analysis, Insights and Forecast, 2019-2031
- 10.1. Market Analysis, Insights and Forecast - by Application
- 10.1.1. Indoor Firefighting
- 10.1.2. Outdoor Firefighting
- 10.2. Market Analysis, Insights and Forecast - by Types
- 10.2.1. Coat
- 10.2.2. Pants
- 10.2.3. Helmets
- 10.2.4. Shoes
- 10.2.5. Others
- 10.1. Market Analysis, Insights and Forecast - by Application
- 11. Competitive Analysis
- 11.1. Global Market Share Analysis 2024
- 11.2. Company Profiles
- 11.2.1 MSA
- 11.2.1.1. Overview
- 11.2.1.2. Products
- 11.2.1.3. SWOT Analysis
- 11.2.1.4. Recent Developments
- 11.2.1.5. Financials (Based on Availability)
- 11.2.2 INNOTEX
- 11.2.2.1. Overview
- 11.2.2.2. Products
- 11.2.2.3. SWOT Analysis
- 11.2.2.4. Recent Developments
- 11.2.2.5. Financials (Based on Availability)
- 11.2.3 Fire-Dex
- 11.2.3.1. Overview
- 11.2.3.2. Products
- 11.2.3.3. SWOT Analysis
- 11.2.3.4. Recent Developments
- 11.2.3.5. Financials (Based on Availability)
- 11.2.4 Sioen NV
- 11.2.4.1. Overview
- 11.2.4.2. Products
- 11.2.4.3. SWOT Analysis
- 11.2.4.4. Recent Developments
- 11.2.4.5. Financials (Based on Availability)
- 11.2.5 ITURRI Group
- 11.2.5.1. Overview
- 11.2.5.2. Products
- 11.2.5.3. SWOT Analysis
- 11.2.5.4. Recent Developments
- 11.2.5.5. Financials (Based on Availability)
- 11.2.6 Lakeland Fire
- 11.2.6.1. Overview
- 11.2.6.2. Products
- 11.2.6.3. SWOT Analysis
- 11.2.6.4. Recent Developments
- 11.2.6.5. Financials (Based on Availability)
- 11.2.7 Rosenbauer
- 11.2.7.1. Overview
- 11.2.7.2. Products
- 11.2.7.3. SWOT Analysis
- 11.2.7.4. Recent Developments
- 11.2.7.5. Financials (Based on Availability)
- 11.2.8 Honeywell
- 11.2.8.1. Overview
- 11.2.8.2. Products
- 11.2.8.3. SWOT Analysis
- 11.2.8.4. Recent Developments
- 11.2.8.5. Financials (Based on Availability)
- 11.2.9 TEXPORT
- 11.2.9.1. Overview
- 11.2.9.2. Products
- 11.2.9.3. SWOT Analysis
- 11.2.9.4. Recent Developments
- 11.2.9.5. Financials (Based on Availability)
- 11.2.10 Taiwan KK Corp
- 11.2.10.1. Overview
- 11.2.10.2. Products
- 11.2.10.3. SWOT Analysis
- 11.2.10.4. Recent Developments
- 11.2.10.5. Financials (Based on Availability)
- 11.2.11 LION
- 11.2.11.1. Overview
- 11.2.11.2. Products
- 11.2.11.3. SWOT Analysis
- 11.2.11.4. Recent Developments
- 11.2.11.5. Financials (Based on Availability)
- 11.2.12 Seyntex
- 11.2.12.1. Overview
- 11.2.12.2. Products
- 11.2.12.3. SWOT Analysis
- 11.2.12.4. Recent Developments
- 11.2.12.5. Financials (Based on Availability)
- 11.2.13 VIKING
- 11.2.13.1. Overview
- 11.2.13.2. Products
- 11.2.13.3. SWOT Analysis
- 11.2.13.4. Recent Developments
- 11.2.13.5. Financials (Based on Availability)
- 11.2.14 Eagle Technical Products
- 11.2.14.1. Overview
- 11.2.14.2. Products
- 11.2.14.3. SWOT Analysis
- 11.2.14.4. Recent Developments
- 11.2.14.5. Financials (Based on Availability)
- 11.2.1 MSA
List of Figures
- Figure 1: Global Firefighting Apparels Revenue Breakdown (million, %) by Region 2024 & 2032
- Figure 2: North America Firefighting Apparels Revenue (million), by Application 2024 & 2032
- Figure 3: North America Firefighting Apparels Revenue Share (%), by Application 2024 & 2032
- Figure 4: North America Firefighting Apparels Revenue (million), by Types 2024 & 2032
- Figure 5: North America Firefighting Apparels Revenue Share (%), by Types 2024 & 2032
- Figure 6: North America Firefighting Apparels Revenue (million), by Country 2024 & 2032
- Figure 7: North America Firefighting Apparels Revenue Share (%), by Country 2024 & 2032
- Figure 8: South America Firefighting Apparels Revenue (million), by Application 2024 & 2032
- Figure 9: South America Firefighting Apparels Revenue Share (%), by Application 2024 & 2032
- Figure 10: South America Firefighting Apparels Revenue (million), by Types 2024 & 2032
- Figure 11: South America Firefighting Apparels Revenue Share (%), by Types 2024 & 2032
- Figure 12: South America Firefighting Apparels Revenue (million), by Country 2024 & 2032
- Figure 13: South America Firefighting Apparels Revenue Share (%), by Country 2024 & 2032
- Figure 14: Europe Firefighting Apparels Revenue (million), by Application 2024 & 2032
- Figure 15: Europe Firefighting Apparels Revenue Share (%), by Application 2024 & 2032
- Figure 16: Europe Firefighting Apparels Revenue (million), by Types 2024 & 2032
- Figure 17: Europe Firefighting Apparels Revenue Share (%), by Types 2024 & 2032
- Figure 18: Europe Firefighting Apparels Revenue (million), by Country 2024 & 2032
- Figure 19: Europe Firefighting Apparels Revenue Share (%), by Country 2024 & 2032
- Figure 20: Middle East & Africa Firefighting Apparels Revenue (million), by Application 2024 & 2032
- Figure 21: Middle East & Africa Firefighting Apparels Revenue Share (%), by Application 2024 & 2032
- Figure 22: Middle East & Africa Firefighting Apparels Revenue (million), by Types 2024 & 2032
- Figure 23: Middle East & Africa Firefighting Apparels Revenue Share (%), by Types 2024 & 2032
- Figure 24: Middle East & Africa Firefighting Apparels Revenue (million), by Country 2024 & 2032
- Figure 25: Middle East & Africa Firefighting Apparels Revenue Share (%), by Country 2024 & 2032
- Figure 26: Asia Pacific Firefighting Apparels Revenue (million), by Application 2024 & 2032
- Figure 27: Asia Pacific Firefighting Apparels Revenue Share (%), by Application 2024 & 2032
- Figure 28: Asia Pacific Firefighting Apparels Revenue (million), by Types 2024 & 2032
- Figure 29: Asia Pacific Firefighting Apparels Revenue Share (%), by Types 2024 & 2032
- Figure 30: Asia Pacific Firefighting Apparels Revenue (million), by Country 2024 & 2032
- Figure 31: Asia Pacific Firefighting Apparels Revenue Share (%), by Country 2024 & 2032
List of Tables
- Table 1: Global Firefighting Apparels Revenue million Forecast, by Region 2019 & 2032
- Table 2: Global Firefighting Apparels Revenue million Forecast, by Application 2019 & 2032
- Table 3: Global Firefighting Apparels Revenue million Forecast, by Types 2019 & 2032
- Table 4: Global Firefighting Apparels Revenue million Forecast, by Region 2019 & 2032
- Table 5: Global Firefighting Apparels Revenue million Forecast, by Application 2019 & 2032
- Table 6: Global Firefighting Apparels Revenue million Forecast, by Types 2019 & 2032
- Table 7: Global Firefighting Apparels Revenue million Forecast, by Country 2019 & 2032
- Table 8: United States Firefighting Apparels Revenue (million) Forecast, by Application 2019 & 2032
- Table 9: Canada Firefighting Apparels Revenue (million) Forecast, by Application 2019 & 2032
- Table 10: Mexico Firefighting Apparels Revenue (million) Forecast, by Application 2019 & 2032
- Table 11: Global Firefighting Apparels Revenue million Forecast, by Application 2019 & 2032
- Table 12: Global Firefighting Apparels Revenue million Forecast, by Types 2019 & 2032
- Table 13: Global Firefighting Apparels Revenue million Forecast, by Country 2019 & 2032
- Table 14: Brazil Firefighting Apparels Revenue (million) Forecast, by Application 2019 & 2032
- Table 15: Argentina Firefighting Apparels Revenue (million) Forecast, by Application 2019 & 2032
- Table 16: Rest of South America Firefighting Apparels Revenue (million) Forecast, by Application 2019 & 2032
- Table 17: Global Firefighting Apparels Revenue million Forecast, by Application 2019 & 2032
- Table 18: Global Firefighting Apparels Revenue million Forecast, by Types 2019 & 2032
- Table 19: Global Firefighting Apparels Revenue million Forecast, by Country 2019 & 2032
- Table 20: United Kingdom Firefighting Apparels Revenue (million) Forecast, by Application 2019 & 2032
- Table 21: Germany Firefighting Apparels Revenue (million) Forecast, by Application 2019 & 2032
- Table 22: France Firefighting Apparels Revenue (million) Forecast, by Application 2019 & 2032
- Table 23: Italy Firefighting Apparels Revenue (million) Forecast, by Application 2019 & 2032
- Table 24: Spain Firefighting Apparels Revenue (million) Forecast, by Application 2019 & 2032
- Table 25: Russia Firefighting Apparels Revenue (million) Forecast, by Application 2019 & 2032
- Table 26: Benelux Firefighting Apparels Revenue (million) Forecast, by Application 2019 & 2032
- Table 27: Nordics Firefighting Apparels Revenue (million) Forecast, by Application 2019 & 2032
- Table 28: Rest of Europe Firefighting Apparels Revenue (million) Forecast, by Application 2019 & 2032
- Table 29: Global Firefighting Apparels Revenue million Forecast, by Application 2019 & 2032
- Table 30: Global Firefighting Apparels Revenue million Forecast, by Types 2019 & 2032
- Table 31: Global Firefighting Apparels Revenue million Forecast, by Country 2019 & 2032
- Table 32: Turkey Firefighting Apparels Revenue (million) Forecast, by Application 2019 & 2032
- Table 33: Israel Firefighting Apparels Revenue (million) Forecast, by Application 2019 & 2032
- Table 34: GCC Firefighting Apparels Revenue (million) Forecast, by Application 2019 & 2032
- Table 35: North Africa Firefighting Apparels Revenue (million) Forecast, by Application 2019 & 2032
- Table 36: South Africa Firefighting Apparels Revenue (million) Forecast, by Application 2019 & 2032
- Table 37: Rest of Middle East & Africa Firefighting Apparels Revenue (million) Forecast, by Application 2019 & 2032
- Table 38: Global Firefighting Apparels Revenue million Forecast, by Application 2019 & 2032
- Table 39: Global Firefighting Apparels Revenue million Forecast, by Types 2019 & 2032
- Table 40: Global Firefighting Apparels Revenue million Forecast, by Country 2019 & 2032
- Table 41: China Firefighting Apparels Revenue (million) Forecast, by Application 2019 & 2032
- Table 42: India Firefighting Apparels Revenue (million) Forecast, by Application 2019 & 2032
- Table 43: Japan Firefighting Apparels Revenue (million) Forecast, by Application 2019 & 2032
- Table 44: South Korea Firefighting Apparels Revenue (million) Forecast, by Application 2019 & 2032
- Table 45: ASEAN Firefighting Apparels Revenue (million) Forecast, by Application 2019 & 2032
- Table 46: Oceania Firefighting Apparels Revenue (million) Forecast, by Application 2019 & 2032
- Table 47: Rest of Asia Pacific Firefighting Apparels Revenue (million) Forecast, by Application 2019 & 2032
Frequently Asked Questions
1. What is the projected Compound Annual Growth Rate (CAGR) of the Firefighting Apparels?
The projected CAGR is approximately XX%.
2. Which companies are prominent players in the Firefighting Apparels?
Key companies in the market include MSA, INNOTEX, Fire-Dex, Sioen NV, ITURRI Group, Lakeland Fire, Rosenbauer, Honeywell, TEXPORT, Taiwan KK Corp, LION, Seyntex, VIKING, Eagle Technical Products.
3. What are the main segments of the Firefighting Apparels?
The market segments include Application, Types.
4. Can you provide details about the market size?
The market size is estimated to be USD XXX million as of 2022.
5. What are some drivers contributing to market growth?
N/A
6. What are the notable trends driving market growth?
N/A
7. Are there any restraints impacting market growth?
N/A
8. Can you provide examples of recent developments in the market?
N/A
9. What pricing options are available for accessing the report?
Pricing options include single-user, multi-user, and enterprise licenses priced at USD 4900.00, USD 7350.00, and USD 9800.00 respectively.
10. Is the market size provided in terms of value or volume?
The market size is provided in terms of value, measured in million.
11. Are there any specific market keywords associated with the report?
Yes, the market keyword associated with the report is "Firefighting Apparels," which aids in identifying and referencing the specific market segment covered.
12. How do I determine which pricing option suits my needs best?
The pricing options vary based on user requirements and access needs. Individual users may opt for single-user licenses, while businesses requiring broader access may choose multi-user or enterprise licenses for cost-effective access to the report.
13. Are there any additional resources or data provided in the Firefighting Apparels report?
While the report offers comprehensive insights, it's advisable to review the specific contents or supplementary materials provided to ascertain if additional resources or data are available.
14. How can I stay updated on further developments or reports in the Firefighting Apparels?
To stay informed about further developments, trends, and reports in the Firefighting Apparels, consider subscribing to industry newsletters, following relevant companies and organizations, or regularly checking reputable industry news sources and publications.
Methodology
Step 1 - Identification of Relevant Samples Size from Population Database


Step 2 - Approaches for Defining Global Market Size (Value, Volume* & Price*)

Note*: In applicable scenarios
Step 3 - Data Sources
Primary Research
- Web Analytics
- Survey Reports
- Research Institute
- Latest Research Reports
- Opinion Leaders
Secondary Research
- Annual Reports
- White Paper
- Latest Press Release
- Industry Association
- Paid Database
- Investor Presentations

Step 4 - Data Triangulation
Involves using different sources of information in order to increase the validity of a study
These sources are likely to be stakeholders in a program - participants, other researchers, program staff, other community members, and so on.
Then we put all data in single framework & apply various statistical tools to find out the dynamic on the market.
During the analysis stage, feedback from the stakeholder groups would be compared to determine areas of agreement as well as areas of divergence
