

Key Insights
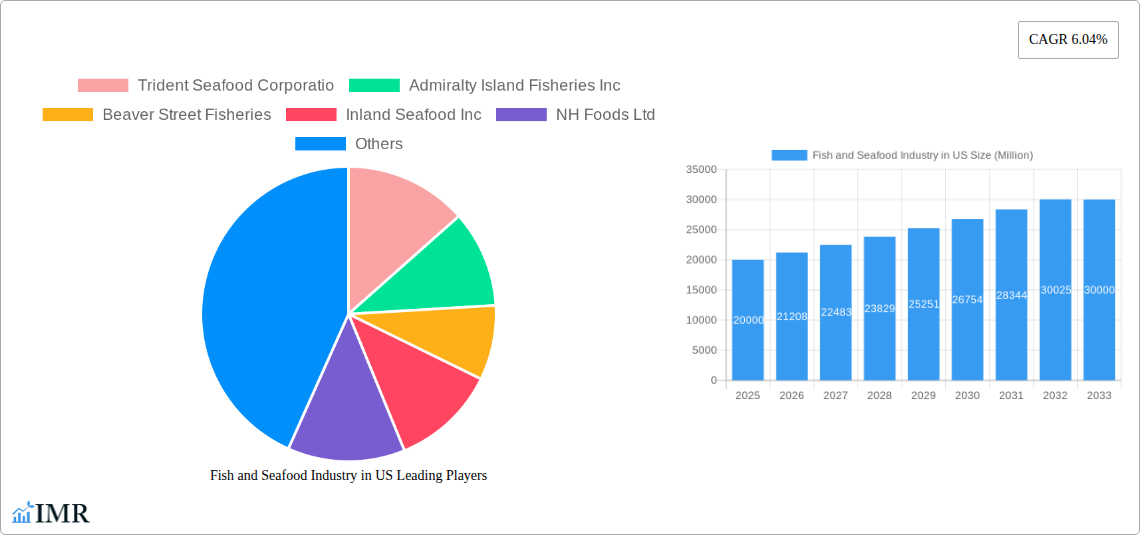
The US fish and seafood market, valued at approximately $20 billion in 2025, exhibits robust growth potential, projected to reach approximately $30 billion by 2033, driven by a 6.04% CAGR. This expansion is fueled by several key factors. Increasing consumer awareness of the health benefits associated with seafood consumption, particularly its high protein and omega-3 fatty acid content, is a significant driver. The growing popularity of seafood in various cuisines and its integration into diverse foodservice offerings, from fine dining to casual eateries, further contribute to market growth. Furthermore, advancements in sustainable fishing practices and aquaculture techniques are enhancing supply chain efficiency and addressing concerns about overfishing, bolstering consumer confidence. While rising input costs and potential supply chain disruptions pose challenges, the overall market outlook remains positive, particularly for value-added processed seafood products and convenient formats like frozen and canned seafood. The demand for sustainably sourced seafood is also driving innovation in sourcing and labeling, creating opportunities for brands that prioritize transparency and ethical practices.
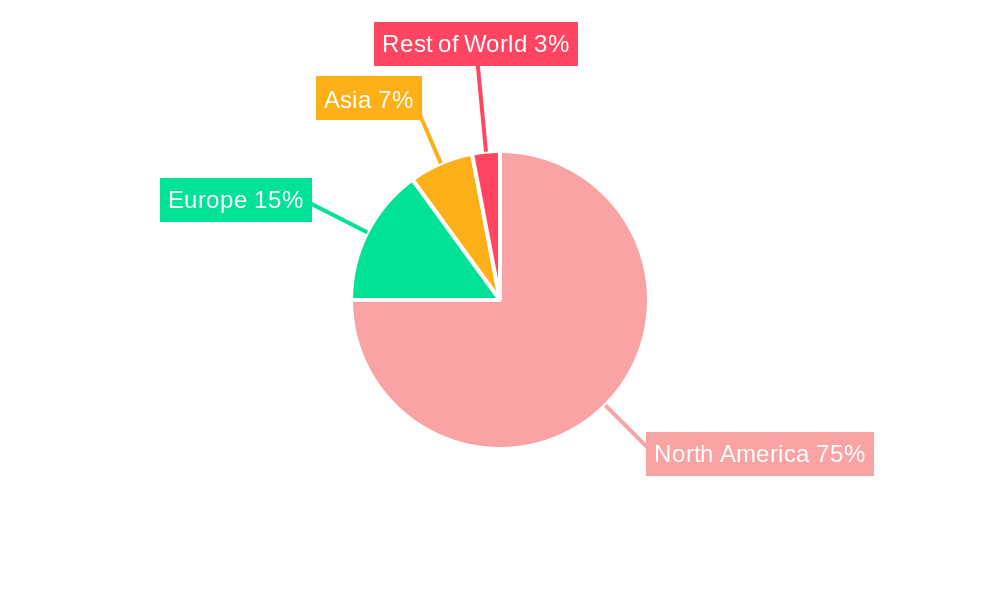
Within the US market, the frozen segment is expected to dominate due to its convenience and longer shelf life. The off-trade distribution channel (grocery stores, supermarkets, online retailers) currently holds a larger market share compared to the on-trade (restaurants, hotels), although the latter segment is anticipated to experience growth driven by the resurgence of the food service industry. Key players like Trident Seafood Corporation, High Liner Foods Inc, and Sysco Corporation are leveraging their established distribution networks and brand recognition to capitalize on these trends. Regional variations exist, with the North American region, specifically the US, commanding the largest market share due to high consumption rates and well-established infrastructure. Competition is intense, necessitating strategic investments in product diversification, brand building, and sustainable sourcing to maintain a competitive edge.
Fish and Seafood Industry in US: A Comprehensive Market Report (2019-2033)
This in-depth report provides a comprehensive analysis of the US fish and seafood industry, encompassing market dynamics, growth trends, key players, and future outlook. The study period covers 2019-2033, with 2025 as the base year. This report is crucial for industry professionals, investors, and stakeholders seeking to understand this dynamic market. The report segments the market by Type (Fish, Shrimp, Other Seafood), Form (Canned, Fresh/Chilled, Frozen, Processed), and Distribution Channel (Off-Trade, On-Trade). Market values are presented in millions of USD.
Fish and Seafood Industry in US Market Dynamics & Structure
The US fish and seafood market is characterized by a moderate level of concentration, with several large players alongside numerous smaller regional operators. Technological innovation, particularly in processing and preservation techniques, plays a significant role. Stringent regulatory frameworks, focused on sustainability and food safety, heavily influence operations. Competitive product substitutes, such as plant-based alternatives, are gaining traction, impacting market share. End-user demographics are shifting, with growing demand from health-conscious consumers. M&A activity has been moderate in recent years, primarily driven by expansion strategies and consolidation within the industry.
- Market Concentration: The top 5 players hold an estimated xx% market share in 2025.
- Technological Innovation: Focus on automation, improved preservation methods, and sustainable fishing practices.
- Regulatory Landscape: Stringent FDA regulations and sustainability certifications (MSC, ASC) are key factors.
- Competitive Substitutes: Plant-based seafood alternatives are growing at a CAGR of xx% (2025-2033).
- M&A Activity: An average of xx M&A deals per year were recorded during the historical period (2019-2024).
- End-User Demographics: Growing demand from health-conscious millennials and Gen Z.
Fish and Seafood Industry in US Growth Trends & Insights
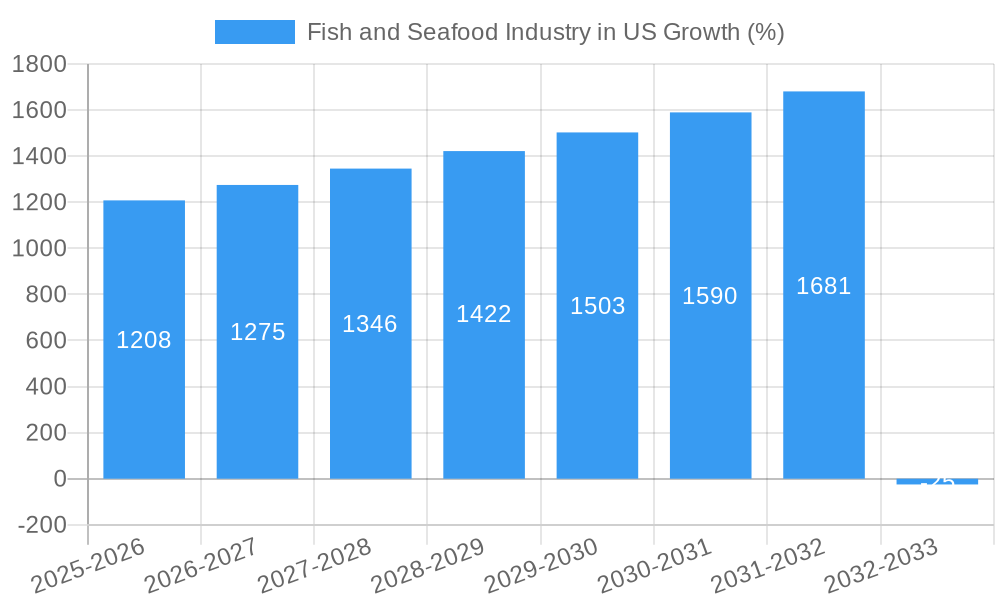
The US fish and seafood market experienced a steady growth during the historical period (2019-2024), driven by factors like increasing consumer demand for healthy protein sources and the rising popularity of seafood in various cuisines. However, supply chain disruptions and price fluctuations have impacted growth in recent years. Technological advancements in processing and packaging have improved product quality and shelf life, leading to higher adoption rates. Consumer behavior is shifting towards sustainably sourced and ethically produced seafood. The market is expected to experience moderate growth in the forecast period (2025-2033), with a projected CAGR of xx%.
Dominant Regions, Countries, or Segments in Fish and Seafood Industry in US
The Pacific Northwest region remains a dominant force in the US fish and seafood industry, largely due to its robust fishing infrastructure and access to diverse species. Alaska, in particular, holds a significant share in the production of wild-caught fish. The Frozen segment holds the largest market share, accounting for approximately xx% of the total market value in 2025. Demand for convenient and long-lasting options drives this dominance. The Off-Trade channel, encompassing grocery stores and supermarkets, constitutes the most significant distribution route.
- Key Drivers: Abundant natural resources, established fishing infrastructure, and proximity to major consumption centers.
- Dominance Factors: High production volume in Alaska, established distribution networks, and consumer preference for fresh and frozen seafood.
- Growth Potential: Expansion of aquaculture, innovative processing techniques, and focus on sustainable practices.
Fish and Seafood Industry in US Product Landscape
The US fish and seafood market offers a diverse product range, including various types of fish (salmon, tuna, cod), shrimp, and other seafood. Product innovations are focused on convenience, sustainability, and value-added offerings like pre-marinated or ready-to-cook products. Technological advancements in freezing and packaging extend product shelf life and maintain quality. Unique selling propositions often center on sourcing (sustainable practices, origin), quality, and convenience.
Key Drivers, Barriers & Challenges in Fish and Seafood Industry in US
Key Drivers: Growing consumer demand for healthy protein, increasing disposable incomes, and the rising popularity of seafood in various cuisines. Government support for sustainable fishing and aquaculture is also a significant driver.
Key Challenges: Supply chain disruptions, fluctuating prices due to global market conditions, and increasing competition from plant-based alternatives. Regulatory compliance and sustainability certifications add operational complexity and cost.
Emerging Opportunities in Fish and Seafood Industry in US
Emerging opportunities include the growth of value-added products, such as ready-to-eat meals and convenience packs. Expanding into new markets with specialized seafood products and focusing on sustainability and traceability offer significant potential. The demand for plant-based alternatives presents both a challenge and an opportunity for innovation in creating hybrid products.
Growth Accelerators in the Fish and Seafood Industry in US Industry
Technological advancements in aquaculture, automation in processing and packaging, and strategic partnerships to improve supply chain efficiency are key growth drivers. The industry's focus on sustainability and traceability is also attracting environmentally conscious consumers, driving market growth.
Key Players Shaping the Fish and Seafood Industry in US Market
- Trident Seafood Corporation
- Admiralty Island Fisheries Inc
- Beaver Street Fisheries
- Inland Seafood Inc
- NH Foods Ltd
- High Liner Foods Inc
- Sysco Corporation
- The Kraft Heinz Company
- Thai Union Group PCL
- Mowi ASA
Notable Milestones in Fish and Seafood Industry in US Sector
- May 2023: Trident Seafood Corporation launched a new Prized Fish product range in collaboration with Copper River Prince William Sound Marketing Association.
- April 2023: Inland Seafood opened a new facility in Jefferson Parish, Louisiana, creating 55 jobs.
- January 2023: Inland Seafood acquired Texas-based Lonestar Seafood, expanding its operations in the western US.
In-Depth Fish and Seafood Industry in US Market Outlook
The US fish and seafood market is poised for continued growth, driven by factors such as increasing consumer demand, technological advancements, and a growing focus on sustainability. Strategic partnerships, investments in innovative processing techniques, and expansion into new markets present significant opportunities for industry players. The market is expected to witness a sustained increase in market value over the forecast period, making it an attractive sector for investment and expansion.
Fish and Seafood Industry in US Segmentation
-
1. Type
- 1.1. Fish
- 1.2. Shrimp
- 1.3. Other Seafood
-
2. Form
- 2.1. Canned
- 2.2. Fresh / Chilled
- 2.3. Frozen
- 2.4. Processed
-
3. Distribution Channel
-
3.1. Off-Trade
- 3.1.1. Convenience Stores
- 3.1.2. Online Channel
- 3.1.3. Supermarkets and Hypermarkets
- 3.1.4. Others
- 3.2. On-Trade
-
3.1. Off-Trade
Fish and Seafood Industry in US Segmentation By Geography
-
1. North America
- 1.1. United States
- 1.2. Canada
- 1.3. Mexico
-
2. South America
- 2.1. Brazil
- 2.2. Argentina
- 2.3. Rest of South America
-
3. Europe
- 3.1. United Kingdom
- 3.2. Germany
- 3.3. France
- 3.4. Italy
- 3.5. Spain
- 3.6. Russia
- 3.7. Benelux
- 3.8. Nordics
- 3.9. Rest of Europe
-
4. Middle East & Africa
- 4.1. Turkey
- 4.2. Israel
- 4.3. GCC
- 4.4. North Africa
- 4.5. South Africa
- 4.6. Rest of Middle East & Africa
-
5. Asia Pacific
- 5.1. China
- 5.2. India
- 5.3. Japan
- 5.4. South Korea
- 5.5. ASEAN
- 5.6. Oceania
- 5.7. Rest of Asia Pacific
Fish and Seafood Industry in US REPORT HIGHLIGHTS
| Aspects | Details |
|---|---|
| Study Period | 2019-2033 |
| Base Year | 2024 |
| Estimated Year | 2025 |
| Forecast Period | 2025-2033 |
| Historical Period | 2019-2024 |
| Growth Rate | CAGR of 6.04% from 2019-2033 |
| Segmentation |
|
Table of Contents
- 1. Introduction
- 1.1. Research Scope
- 1.2. Market Segmentation
- 1.3. Research Methodology
- 1.4. Definitions and Assumptions
- 2. Executive Summary
- 2.1. Introduction
- 3. Market Dynamics
- 3.1. Introduction
- 3.2. Market Drivers
- 3.2.1. Increasing Focus on Maintaining Health and Well-Being; Launching Supplements For Specific Purposes and Targeted Population
- 3.3. Market Restrains
- 3.3.1. Supplement Consumption and Their Side-effects; Inclination Towards Substitute Products
- 3.4. Market Trends
- 3.4.1. OTHER KEY INDUSTRY TRENDS COVERED IN THE REPORT
- 4. Market Factor Analysis
- 4.1. Porters Five Forces
- 4.2. Supply/Value Chain
- 4.3. PESTEL analysis
- 4.4. Market Entropy
- 4.5. Patent/Trademark Analysis
- 5. Global Fish and Seafood Industry in US Analysis, Insights and Forecast, 2019-2031
- 5.1. Market Analysis, Insights and Forecast - by Type
- 5.1.1. Fish
- 5.1.2. Shrimp
- 5.1.3. Other Seafood
- 5.2. Market Analysis, Insights and Forecast - by Form
- 5.2.1. Canned
- 5.2.2. Fresh / Chilled
- 5.2.3. Frozen
- 5.2.4. Processed
- 5.3. Market Analysis, Insights and Forecast - by Distribution Channel
- 5.3.1. Off-Trade
- 5.3.1.1. Convenience Stores
- 5.3.1.2. Online Channel
- 5.3.1.3. Supermarkets and Hypermarkets
- 5.3.1.4. Others
- 5.3.2. On-Trade
- 5.3.1. Off-Trade
- 5.4. Market Analysis, Insights and Forecast - by Region
- 5.4.1. North America
- 5.4.2. South America
- 5.4.3. Europe
- 5.4.4. Middle East & Africa
- 5.4.5. Asia Pacific
- 5.1. Market Analysis, Insights and Forecast - by Type
- 6. North America Fish and Seafood Industry in US Analysis, Insights and Forecast, 2019-2031
- 6.1. Market Analysis, Insights and Forecast - by Type
- 6.1.1. Fish
- 6.1.2. Shrimp
- 6.1.3. Other Seafood
- 6.2. Market Analysis, Insights and Forecast - by Form
- 6.2.1. Canned
- 6.2.2. Fresh / Chilled
- 6.2.3. Frozen
- 6.2.4. Processed
- 6.3. Market Analysis, Insights and Forecast - by Distribution Channel
- 6.3.1. Off-Trade
- 6.3.1.1. Convenience Stores
- 6.3.1.2. Online Channel
- 6.3.1.3. Supermarkets and Hypermarkets
- 6.3.1.4. Others
- 6.3.2. On-Trade
- 6.3.1. Off-Trade
- 6.1. Market Analysis, Insights and Forecast - by Type
- 7. South America Fish and Seafood Industry in US Analysis, Insights and Forecast, 2019-2031
- 7.1. Market Analysis, Insights and Forecast - by Type
- 7.1.1. Fish
- 7.1.2. Shrimp
- 7.1.3. Other Seafood
- 7.2. Market Analysis, Insights and Forecast - by Form
- 7.2.1. Canned
- 7.2.2. Fresh / Chilled
- 7.2.3. Frozen
- 7.2.4. Processed
- 7.3. Market Analysis, Insights and Forecast - by Distribution Channel
- 7.3.1. Off-Trade
- 7.3.1.1. Convenience Stores
- 7.3.1.2. Online Channel
- 7.3.1.3. Supermarkets and Hypermarkets
- 7.3.1.4. Others
- 7.3.2. On-Trade
- 7.3.1. Off-Trade
- 7.1. Market Analysis, Insights and Forecast - by Type
- 8. Europe Fish and Seafood Industry in US Analysis, Insights and Forecast, 2019-2031
- 8.1. Market Analysis, Insights and Forecast - by Type
- 8.1.1. Fish
- 8.1.2. Shrimp
- 8.1.3. Other Seafood
- 8.2. Market Analysis, Insights and Forecast - by Form
- 8.2.1. Canned
- 8.2.2. Fresh / Chilled
- 8.2.3. Frozen
- 8.2.4. Processed
- 8.3. Market Analysis, Insights and Forecast - by Distribution Channel
- 8.3.1. Off-Trade
- 8.3.1.1. Convenience Stores
- 8.3.1.2. Online Channel
- 8.3.1.3. Supermarkets and Hypermarkets
- 8.3.1.4. Others
- 8.3.2. On-Trade
- 8.3.1. Off-Trade
- 8.1. Market Analysis, Insights and Forecast - by Type
- 9. Middle East & Africa Fish and Seafood Industry in US Analysis, Insights and Forecast, 2019-2031
- 9.1. Market Analysis, Insights and Forecast - by Type
- 9.1.1. Fish
- 9.1.2. Shrimp
- 9.1.3. Other Seafood
- 9.2. Market Analysis, Insights and Forecast - by Form
- 9.2.1. Canned
- 9.2.2. Fresh / Chilled
- 9.2.3. Frozen
- 9.2.4. Processed
- 9.3. Market Analysis, Insights and Forecast - by Distribution Channel
- 9.3.1. Off-Trade
- 9.3.1.1. Convenience Stores
- 9.3.1.2. Online Channel
- 9.3.1.3. Supermarkets and Hypermarkets
- 9.3.1.4. Others
- 9.3.2. On-Trade
- 9.3.1. Off-Trade
- 9.1. Market Analysis, Insights and Forecast - by Type
- 10. Asia Pacific Fish and Seafood Industry in US Analysis, Insights and Forecast, 2019-2031
- 10.1. Market Analysis, Insights and Forecast - by Type
- 10.1.1. Fish
- 10.1.2. Shrimp
- 10.1.3. Other Seafood
- 10.2. Market Analysis, Insights and Forecast - by Form
- 10.2.1. Canned
- 10.2.2. Fresh / Chilled
- 10.2.3. Frozen
- 10.2.4. Processed
- 10.3. Market Analysis, Insights and Forecast - by Distribution Channel
- 10.3.1. Off-Trade
- 10.3.1.1. Convenience Stores
- 10.3.1.2. Online Channel
- 10.3.1.3. Supermarkets and Hypermarkets
- 10.3.1.4. Others
- 10.3.2. On-Trade
- 10.3.1. Off-Trade
- 10.1. Market Analysis, Insights and Forecast - by Type
- 11. United States Fish and Seafood Industry in US Analysis, Insights and Forecast, 2019-2031
- 12. Canada Fish and Seafood Industry in US Analysis, Insights and Forecast, 2019-2031
- 13. Mexico Fish and Seafood Industry in US Analysis, Insights and Forecast, 2019-2031
- 14. Rest of North America Fish and Seafood Industry in US Analysis, Insights and Forecast, 2019-2031
- 15. Competitive Analysis
- 15.1. Global Market Share Analysis 2024
- 15.2. Company Profiles
- 15.2.1 Trident Seafood Corporatio
- 15.2.1.1. Overview
- 15.2.1.2. Products
- 15.2.1.3. SWOT Analysis
- 15.2.1.4. Recent Developments
- 15.2.1.5. Financials (Based on Availability)
- 15.2.2 Admiralty Island Fisheries Inc
- 15.2.2.1. Overview
- 15.2.2.2. Products
- 15.2.2.3. SWOT Analysis
- 15.2.2.4. Recent Developments
- 15.2.2.5. Financials (Based on Availability)
- 15.2.3 Beaver Street Fisheries
- 15.2.3.1. Overview
- 15.2.3.2. Products
- 15.2.3.3. SWOT Analysis
- 15.2.3.4. Recent Developments
- 15.2.3.5. Financials (Based on Availability)
- 15.2.4 Inland Seafood Inc
- 15.2.4.1. Overview
- 15.2.4.2. Products
- 15.2.4.3. SWOT Analysis
- 15.2.4.4. Recent Developments
- 15.2.4.5. Financials (Based on Availability)
- 15.2.5 NH Foods Ltd
- 15.2.5.1. Overview
- 15.2.5.2. Products
- 15.2.5.3. SWOT Analysis
- 15.2.5.4. Recent Developments
- 15.2.5.5. Financials (Based on Availability)
- 15.2.6 High Liner Foods Inc
- 15.2.6.1. Overview
- 15.2.6.2. Products
- 15.2.6.3. SWOT Analysis
- 15.2.6.4. Recent Developments
- 15.2.6.5. Financials (Based on Availability)
- 15.2.7 Sysco Corporation
- 15.2.7.1. Overview
- 15.2.7.2. Products
- 15.2.7.3. SWOT Analysis
- 15.2.7.4. Recent Developments
- 15.2.7.5. Financials (Based on Availability)
- 15.2.8 The Kraft Heinz Company
- 15.2.8.1. Overview
- 15.2.8.2. Products
- 15.2.8.3. SWOT Analysis
- 15.2.8.4. Recent Developments
- 15.2.8.5. Financials (Based on Availability)
- 15.2.9 Thai Union Group PCL
- 15.2.9.1. Overview
- 15.2.9.2. Products
- 15.2.9.3. SWOT Analysis
- 15.2.9.4. Recent Developments
- 15.2.9.5. Financials (Based on Availability)
- 15.2.10 Mowi ASA
- 15.2.10.1. Overview
- 15.2.10.2. Products
- 15.2.10.3. SWOT Analysis
- 15.2.10.4. Recent Developments
- 15.2.10.5. Financials (Based on Availability)
- 15.2.1 Trident Seafood Corporatio
List of Figures
- Figure 1: Global Fish and Seafood Industry in US Revenue Breakdown (Million, %) by Region 2024 & 2032
- Figure 2: North America Fish and Seafood Industry in US Revenue (Million), by Country 2024 & 2032
- Figure 3: North America Fish and Seafood Industry in US Revenue Share (%), by Country 2024 & 2032
- Figure 4: North America Fish and Seafood Industry in US Revenue (Million), by Type 2024 & 2032
- Figure 5: North America Fish and Seafood Industry in US Revenue Share (%), by Type 2024 & 2032
- Figure 6: North America Fish and Seafood Industry in US Revenue (Million), by Form 2024 & 2032
- Figure 7: North America Fish and Seafood Industry in US Revenue Share (%), by Form 2024 & 2032
- Figure 8: North America Fish and Seafood Industry in US Revenue (Million), by Distribution Channel 2024 & 2032
- Figure 9: North America Fish and Seafood Industry in US Revenue Share (%), by Distribution Channel 2024 & 2032
- Figure 10: North America Fish and Seafood Industry in US Revenue (Million), by Country 2024 & 2032
- Figure 11: North America Fish and Seafood Industry in US Revenue Share (%), by Country 2024 & 2032
- Figure 12: South America Fish and Seafood Industry in US Revenue (Million), by Type 2024 & 2032
- Figure 13: South America Fish and Seafood Industry in US Revenue Share (%), by Type 2024 & 2032
- Figure 14: South America Fish and Seafood Industry in US Revenue (Million), by Form 2024 & 2032
- Figure 15: South America Fish and Seafood Industry in US Revenue Share (%), by Form 2024 & 2032
- Figure 16: South America Fish and Seafood Industry in US Revenue (Million), by Distribution Channel 2024 & 2032
- Figure 17: South America Fish and Seafood Industry in US Revenue Share (%), by Distribution Channel 2024 & 2032
- Figure 18: South America Fish and Seafood Industry in US Revenue (Million), by Country 2024 & 2032
- Figure 19: South America Fish and Seafood Industry in US Revenue Share (%), by Country 2024 & 2032
- Figure 20: Europe Fish and Seafood Industry in US Revenue (Million), by Type 2024 & 2032
- Figure 21: Europe Fish and Seafood Industry in US Revenue Share (%), by Type 2024 & 2032
- Figure 22: Europe Fish and Seafood Industry in US Revenue (Million), by Form 2024 & 2032
- Figure 23: Europe Fish and Seafood Industry in US Revenue Share (%), by Form 2024 & 2032
- Figure 24: Europe Fish and Seafood Industry in US Revenue (Million), by Distribution Channel 2024 & 2032
- Figure 25: Europe Fish and Seafood Industry in US Revenue Share (%), by Distribution Channel 2024 & 2032
- Figure 26: Europe Fish and Seafood Industry in US Revenue (Million), by Country 2024 & 2032
- Figure 27: Europe Fish and Seafood Industry in US Revenue Share (%), by Country 2024 & 2032
- Figure 28: Middle East & Africa Fish and Seafood Industry in US Revenue (Million), by Type 2024 & 2032
- Figure 29: Middle East & Africa Fish and Seafood Industry in US Revenue Share (%), by Type 2024 & 2032
- Figure 30: Middle East & Africa Fish and Seafood Industry in US Revenue (Million), by Form 2024 & 2032
- Figure 31: Middle East & Africa Fish and Seafood Industry in US Revenue Share (%), by Form 2024 & 2032
- Figure 32: Middle East & Africa Fish and Seafood Industry in US Revenue (Million), by Distribution Channel 2024 & 2032
- Figure 33: Middle East & Africa Fish and Seafood Industry in US Revenue Share (%), by Distribution Channel 2024 & 2032
- Figure 34: Middle East & Africa Fish and Seafood Industry in US Revenue (Million), by Country 2024 & 2032
- Figure 35: Middle East & Africa Fish and Seafood Industry in US Revenue Share (%), by Country 2024 & 2032
- Figure 36: Asia Pacific Fish and Seafood Industry in US Revenue (Million), by Type 2024 & 2032
- Figure 37: Asia Pacific Fish and Seafood Industry in US Revenue Share (%), by Type 2024 & 2032
- Figure 38: Asia Pacific Fish and Seafood Industry in US Revenue (Million), by Form 2024 & 2032
- Figure 39: Asia Pacific Fish and Seafood Industry in US Revenue Share (%), by Form 2024 & 2032
- Figure 40: Asia Pacific Fish and Seafood Industry in US Revenue (Million), by Distribution Channel 2024 & 2032
- Figure 41: Asia Pacific Fish and Seafood Industry in US Revenue Share (%), by Distribution Channel 2024 & 2032
- Figure 42: Asia Pacific Fish and Seafood Industry in US Revenue (Million), by Country 2024 & 2032
- Figure 43: Asia Pacific Fish and Seafood Industry in US Revenue Share (%), by Country 2024 & 2032
List of Tables
- Table 1: Global Fish and Seafood Industry in US Revenue Million Forecast, by Region 2019 & 2032
- Table 2: Global Fish and Seafood Industry in US Revenue Million Forecast, by Type 2019 & 2032
- Table 3: Global Fish and Seafood Industry in US Revenue Million Forecast, by Form 2019 & 2032
- Table 4: Global Fish and Seafood Industry in US Revenue Million Forecast, by Distribution Channel 2019 & 2032
- Table 5: Global Fish and Seafood Industry in US Revenue Million Forecast, by Region 2019 & 2032
- Table 6: Global Fish and Seafood Industry in US Revenue Million Forecast, by Country 2019 & 2032
- Table 7: United States Fish and Seafood Industry in US Revenue (Million) Forecast, by Application 2019 & 2032
- Table 8: Canada Fish and Seafood Industry in US Revenue (Million) Forecast, by Application 2019 & 2032
- Table 9: Mexico Fish and Seafood Industry in US Revenue (Million) Forecast, by Application 2019 & 2032
- Table 10: Rest of North America Fish and Seafood Industry in US Revenue (Million) Forecast, by Application 2019 & 2032
- Table 11: Global Fish and Seafood Industry in US Revenue Million Forecast, by Type 2019 & 2032
- Table 12: Global Fish and Seafood Industry in US Revenue Million Forecast, by Form 2019 & 2032
- Table 13: Global Fish and Seafood Industry in US Revenue Million Forecast, by Distribution Channel 2019 & 2032
- Table 14: Global Fish and Seafood Industry in US Revenue Million Forecast, by Country 2019 & 2032
- Table 15: United States Fish and Seafood Industry in US Revenue (Million) Forecast, by Application 2019 & 2032
- Table 16: Canada Fish and Seafood Industry in US Revenue (Million) Forecast, by Application 2019 & 2032
- Table 17: Mexico Fish and Seafood Industry in US Revenue (Million) Forecast, by Application 2019 & 2032
- Table 18: Global Fish and Seafood Industry in US Revenue Million Forecast, by Type 2019 & 2032
- Table 19: Global Fish and Seafood Industry in US Revenue Million Forecast, by Form 2019 & 2032
- Table 20: Global Fish and Seafood Industry in US Revenue Million Forecast, by Distribution Channel 2019 & 2032
- Table 21: Global Fish and Seafood Industry in US Revenue Million Forecast, by Country 2019 & 2032
- Table 22: Brazil Fish and Seafood Industry in US Revenue (Million) Forecast, by Application 2019 & 2032
- Table 23: Argentina Fish and Seafood Industry in US Revenue (Million) Forecast, by Application 2019 & 2032
- Table 24: Rest of South America Fish and Seafood Industry in US Revenue (Million) Forecast, by Application 2019 & 2032
- Table 25: Global Fish and Seafood Industry in US Revenue Million Forecast, by Type 2019 & 2032
- Table 26: Global Fish and Seafood Industry in US Revenue Million Forecast, by Form 2019 & 2032
- Table 27: Global Fish and Seafood Industry in US Revenue Million Forecast, by Distribution Channel 2019 & 2032
- Table 28: Global Fish and Seafood Industry in US Revenue Million Forecast, by Country 2019 & 2032
- Table 29: United Kingdom Fish and Seafood Industry in US Revenue (Million) Forecast, by Application 2019 & 2032
- Table 30: Germany Fish and Seafood Industry in US Revenue (Million) Forecast, by Application 2019 & 2032
- Table 31: France Fish and Seafood Industry in US Revenue (Million) Forecast, by Application 2019 & 2032
- Table 32: Italy Fish and Seafood Industry in US Revenue (Million) Forecast, by Application 2019 & 2032
- Table 33: Spain Fish and Seafood Industry in US Revenue (Million) Forecast, by Application 2019 & 2032
- Table 34: Russia Fish and Seafood Industry in US Revenue (Million) Forecast, by Application 2019 & 2032
- Table 35: Benelux Fish and Seafood Industry in US Revenue (Million) Forecast, by Application 2019 & 2032
- Table 36: Nordics Fish and Seafood Industry in US Revenue (Million) Forecast, by Application 2019 & 2032
- Table 37: Rest of Europe Fish and Seafood Industry in US Revenue (Million) Forecast, by Application 2019 & 2032
- Table 38: Global Fish and Seafood Industry in US Revenue Million Forecast, by Type 2019 & 2032
- Table 39: Global Fish and Seafood Industry in US Revenue Million Forecast, by Form 2019 & 2032
- Table 40: Global Fish and Seafood Industry in US Revenue Million Forecast, by Distribution Channel 2019 & 2032
- Table 41: Global Fish and Seafood Industry in US Revenue Million Forecast, by Country 2019 & 2032
- Table 42: Turkey Fish and Seafood Industry in US Revenue (Million) Forecast, by Application 2019 & 2032
- Table 43: Israel Fish and Seafood Industry in US Revenue (Million) Forecast, by Application 2019 & 2032
- Table 44: GCC Fish and Seafood Industry in US Revenue (Million) Forecast, by Application 2019 & 2032
- Table 45: North Africa Fish and Seafood Industry in US Revenue (Million) Forecast, by Application 2019 & 2032
- Table 46: South Africa Fish and Seafood Industry in US Revenue (Million) Forecast, by Application 2019 & 2032
- Table 47: Rest of Middle East & Africa Fish and Seafood Industry in US Revenue (Million) Forecast, by Application 2019 & 2032
- Table 48: Global Fish and Seafood Industry in US Revenue Million Forecast, by Type 2019 & 2032
- Table 49: Global Fish and Seafood Industry in US Revenue Million Forecast, by Form 2019 & 2032
- Table 50: Global Fish and Seafood Industry in US Revenue Million Forecast, by Distribution Channel 2019 & 2032
- Table 51: Global Fish and Seafood Industry in US Revenue Million Forecast, by Country 2019 & 2032
- Table 52: China Fish and Seafood Industry in US Revenue (Million) Forecast, by Application 2019 & 2032
- Table 53: India Fish and Seafood Industry in US Revenue (Million) Forecast, by Application 2019 & 2032
- Table 54: Japan Fish and Seafood Industry in US Revenue (Million) Forecast, by Application 2019 & 2032
- Table 55: South Korea Fish and Seafood Industry in US Revenue (Million) Forecast, by Application 2019 & 2032
- Table 56: ASEAN Fish and Seafood Industry in US Revenue (Million) Forecast, by Application 2019 & 2032
- Table 57: Oceania Fish and Seafood Industry in US Revenue (Million) Forecast, by Application 2019 & 2032
- Table 58: Rest of Asia Pacific Fish and Seafood Industry in US Revenue (Million) Forecast, by Application 2019 & 2032
Frequently Asked Questions
1. What is the projected Compound Annual Growth Rate (CAGR) of the Fish and Seafood Industry in US?
The projected CAGR is approximately 6.04%.
2. Which companies are prominent players in the Fish and Seafood Industry in US?
Key companies in the market include Trident Seafood Corporatio, Admiralty Island Fisheries Inc, Beaver Street Fisheries, Inland Seafood Inc, NH Foods Ltd, High Liner Foods Inc, Sysco Corporation, The Kraft Heinz Company, Thai Union Group PCL, Mowi ASA.
3. What are the main segments of the Fish and Seafood Industry in US?
The market segments include Type, Form, Distribution Channel.
4. Can you provide details about the market size?
The market size is estimated to be USD XX Million as of 2022.
5. What are some drivers contributing to market growth?
Increasing Focus on Maintaining Health and Well-Being; Launching Supplements For Specific Purposes and Targeted Population.
6. What are the notable trends driving market growth?
OTHER KEY INDUSTRY TRENDS COVERED IN THE REPORT.
7. Are there any restraints impacting market growth?
Supplement Consumption and Their Side-effects; Inclination Towards Substitute Products.
8. Can you provide examples of recent developments in the market?
May 2023: Trident Seafood Corporation has collaborated with Copper River Prince William Sound Marketing Association to introduce new Prized Fish product range in the United Staes Market.April 2023: Inland Seafood opened a new facility of its own in Jefferson Parish. They invested approximately USD 4 million in order to purchase and renovate a 14,000-square-foot facility in Elmwood, bringing 55 jobs to Jefferson Parish.January 2023: In order to expand their operations in the western part of the United States Inland Seafood acquired Texas-based Lonestar Seafood. The Texas-based supplier is famous for the quality of lobsters they supply.
9. What pricing options are available for accessing the report?
Pricing options include single-user, multi-user, and enterprise licenses priced at USD 3800, USD 4500, and USD 5800 respectively.
10. Is the market size provided in terms of value or volume?
The market size is provided in terms of value, measured in Million.
11. Are there any specific market keywords associated with the report?
Yes, the market keyword associated with the report is "Fish and Seafood Industry in US," which aids in identifying and referencing the specific market segment covered.
12. How do I determine which pricing option suits my needs best?
The pricing options vary based on user requirements and access needs. Individual users may opt for single-user licenses, while businesses requiring broader access may choose multi-user or enterprise licenses for cost-effective access to the report.
13. Are there any additional resources or data provided in the Fish and Seafood Industry in US report?
While the report offers comprehensive insights, it's advisable to review the specific contents or supplementary materials provided to ascertain if additional resources or data are available.
14. How can I stay updated on further developments or reports in the Fish and Seafood Industry in US?
To stay informed about further developments, trends, and reports in the Fish and Seafood Industry in US, consider subscribing to industry newsletters, following relevant companies and organizations, or regularly checking reputable industry news sources and publications.
Methodology
Step 1 - Identification of Relevant Samples Size from Population Database


Step 2 - Approaches for Defining Global Market Size (Value, Volume* & Price*)

Note*: In applicable scenarios
Step 3 - Data Sources
Primary Research
- Web Analytics
- Survey Reports
- Research Institute
- Latest Research Reports
- Opinion Leaders
Secondary Research
- Annual Reports
- White Paper
- Latest Press Release
- Industry Association
- Paid Database
- Investor Presentations

Step 4 - Data Triangulation
Involves using different sources of information in order to increase the validity of a study
These sources are likely to be stakeholders in a program - participants, other researchers, program staff, other community members, and so on.
Then we put all data in single framework & apply various statistical tools to find out the dynamic on the market.
During the analysis stage, feedback from the stakeholder groups would be compared to determine areas of agreement as well as areas of divergence
