

Key Insights
The flexible display technology market is experiencing rapid growth, projected to reach $15.22 billion in 2025 and exhibiting a robust Compound Annual Growth Rate (CAGR) of 34.80%. This expansion is driven primarily by the increasing demand for foldable smartphones and wearables, coupled with advancements in OLED and other display technologies. The rising adoption of flexible displays in televisions, digital signage, and automotive applications further fuels market expansion. Key players like Samsung, LG, and BOE Technology are heavily invested in R&D, leading to continuous innovation in materials and manufacturing processes. While challenges remain in terms of cost reduction and achieving consistent product quality at scale, particularly for larger flexible displays, the overall market outlook remains optimistic. The segment breakdown reveals a strong focus on OLED displays, owing to their superior image quality and flexibility compared to traditional LCDs. The Asia-Pacific region is expected to dominate the market due to the concentration of manufacturing hubs and a high demand for consumer electronics. The ongoing miniaturization of electronics and the growing demand for aesthetically pleasing and durable devices will ensure continued market growth throughout the forecast period.
The market segmentation showcases diverse applications with smartphones and tablets currently holding the largest share. However, growth is particularly strong in smart wearables and emerging applications like automotive displays and smart home appliances, signifying a diversification of the market. Different substrate materials like glass and plastic cater to varied application needs and technological advancements. The competitive landscape is characterized by intense rivalry among major players who are constantly striving for technological breakthroughs, cost efficiencies, and strategic partnerships to expand their market presence. The continuous evolution of display technology, fueled by ongoing research and development efforts, positions the flexible display market for sustained growth, with significant opportunities in the coming years.

Flexible Display Technology Industry Market Report: 2019-2033
This comprehensive report provides an in-depth analysis of the flexible display technology industry, encompassing market dynamics, growth trends, regional analysis, product landscape, key players, and future outlook. The study period covers 2019-2033, with 2025 as the base and estimated year, and a forecast period of 2025-2033. The report utilizes data from the historical period of 2019-2024 and presents values in million units. This report is crucial for industry professionals, investors, and researchers seeking to understand the current state and future trajectory of this rapidly evolving market.
Flexible Display Technology Industry Market Dynamics & Structure
The flexible display technology market is characterized by a moderately concentrated landscape, with key players like Samsung, LG Display, and BOE Technology Group holding significant market share. Technological innovation, particularly in OLED and flexible plastic substrates, is a major driver. Stringent regulatory frameworks regarding material safety and energy efficiency also play a significant role. Competitive substitutes, such as conventional rigid displays, face increasing pressure due to flexible displays' superior aesthetics and functionality. End-user demographics are expanding beyond smartphones to encompass wearables, automobiles, and smart home appliances. Mergers and acquisitions (M&A) activity in the sector is moderate, with strategic alliances and joint ventures becoming increasingly prevalent to acquire technology and market access.
- Market Concentration: The top 5 players hold approximately xx% of the global market share (2024).
- Technological Innovation: Focus on foldable, rollable, and stretchable displays, driving premiumization and diverse applications.
- Regulatory Framework: Growing emphasis on environmental standards and material safety compliance.
- Competitive Substitutes: Rigid displays facing declining market share due to flexible display advantages.
- M&A Activity: xx major M&A deals were recorded between 2019-2024, primarily focused on technology acquisition and market expansion.
- Innovation Barriers: High R&D costs, complex manufacturing processes, and achieving consistent quality and yield remain challenges.
Flexible Display Technology Industry Growth Trends & Insights
The flexible display technology market has experienced significant growth driven by increasing demand for portable and flexible electronic devices. The market size (in million units) exhibited a CAGR of xx% during the historical period (2019-2024), reaching xx million units in 2024. The adoption rate of flexible displays is accelerating, primarily in the smartphone and wearable segments. Technological disruptions, like the introduction of advanced OLED and flexible LCD technologies, are fueling growth. Consumer behavior shifts towards premium features and design are further enhancing market demand. The forecast period (2025-2033) is projected to witness continued expansion, with a projected CAGR of xx%, driven by increasing adoption across diverse applications. Market penetration in emerging markets remains a key growth opportunity.

Dominant Regions, Countries, or Segments in Flexible Display Technology Industry
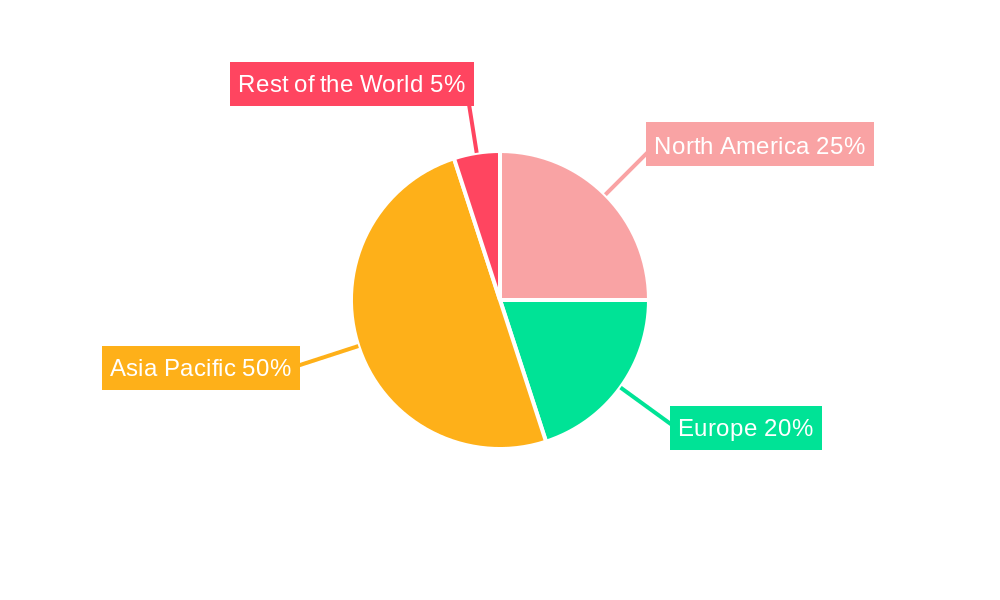
East Asia (particularly South Korea, China, and Taiwan) dominates the flexible display technology market, driven by robust manufacturing capabilities, a strong technological base, and high consumer demand for advanced electronics. Within application segments, smartphones and tablets currently represent the largest market share. However, the smart wearables and flexible display TV segments are poised for rapid growth. By substrate material, the glass substrate material segment dominates due to superior performance, while plastic substrates are rapidly gaining ground driven by flexibility and cost-effectiveness. The OLED display type holds a dominant position due to superior picture quality, flexibility, and cost reduction.
- Key Drivers:
- High Consumer Electronics Demand: Strong demand in East Asia and expanding in other regions.
- Government Support: Favorable policies promoting technology innovation and manufacturing in key regions.
- Technological Advancements: Continuous improvements in OLED and flexible LCD technologies.
- Dominance Factors:
- Manufacturing Concentration: Significant portion of manufacturing is concentrated in East Asia.
- Technological Leadership: Key players like Samsung, LG Display, and BOE are leading in innovation.
- Cost-Effectiveness: Continued cost reduction in manufacturing flexible displays.
- Growth Potential: Significant growth potential in emerging markets and new application areas.
Flexible Display Technology Industry Product Landscape
Flexible display technology encompasses a range of products, from foldable smartphones and wearable displays to flexible televisions and automotive displays. Key advancements include higher resolution, improved brightness, enhanced durability, and thinner form factors. Unique selling propositions include superior aesthetics, portability, and increased functionality. Technological advancements are focused on cost reduction, improved efficiency, and the development of new display types, such as stretchable and transparent displays.
Key Drivers, Barriers & Challenges in Flexible Display Technology Industry
Key Drivers:
- Technological advancements in OLED and flexible LCD technologies.
- Increasing demand for portable and flexible electronic devices.
- Growing adoption of flexible displays in emerging applications (e.g., automotive, wearables).
- Favorable government policies promoting technological innovation and manufacturing.
Key Challenges:
- High production costs associated with advanced flexible display manufacturing.
- Complex and precise manufacturing processes resulting in lower yield rates.
- Supply chain disruptions and material shortages affecting production.
- Intense competition among major players impacting pricing.
Emerging Opportunities in Flexible Display Technology Industry
- Expanding applications in the automotive and smart home sectors.
- Growing demand for high-resolution and large-area flexible displays.
- Development of foldable, rollable, and stretchable displays with unique form factors.
- Exploration of transparent and flexible displays for AR/VR applications.
Growth Accelerators in the Flexible Display Technology Industry Industry
Technological breakthroughs in materials science, manufacturing processes, and display technologies will drive long-term growth. Strategic partnerships between display manufacturers and device makers will be essential for market expansion. Expansion into emerging markets with significant consumer electronics demand and supportive government policies will fuel further growth.
Key Players Shaping the Flexible Display Technology Industry Market
- LG Display Co Ltd
- TCL Electronics Holdings Limited
- Plastic Logic
- e-ink Holdings
- Samsung Electronics Co Ltd
- FlexEnable Technology Limited
- Innolux Corporation
- Guangzhou Oed Technologies Co Ltd
- Chunghwa Picture Tubes Ltd
- Microtips Technology
- Huawei Technologies Co Ltd
- Sharp Corporation
- ROYOLE Corporation
- AU Optronics Corp
- BOE Technology Group Co Ltd
Notable Milestones in Flexible Display Technology Industry Sector
- May 2022: LG Display showcased next-generation OLED solutions at SID 2022, highlighting advancements in bendable and foldable OLED panels.
- March 2022: Stanford researchers announced a high-brightness stretchable display technology, potentially revolutionizing human-electronics interaction.
In-Depth Flexible Display Technology Industry Market Outlook
The flexible display technology market is poised for sustained growth, driven by continuous innovation, expanding applications, and increasing consumer demand for advanced electronics. Strategic partnerships and investments in R&D will be crucial for maintaining a competitive edge. The focus on cost reduction and improved efficiency will unlock further market expansion across various sectors, including wearables, automotive, and smart home applications. The long-term outlook is positive, with significant opportunities for growth and innovation in this dynamic market.
Flexible Display Technology Industry Segmentation
-
1. Display Type
- 1.1. OLED
- 1.2. LCD
- 1.3. EPD (Electronic Paper Display)
- 1.4. Other Display Types (LED)
-
2. Substrate Material
- 2.1. Glass
- 2.2. Plastic
- 2.3. Other Substrate Materials
-
3. Application
- 3.1. Smartphones and Tablets
- 3.2. Smart Wearables
- 3.3. Televisions and Digital Signage Systems
- 3.4. Personal Computers and Laptops
- 3.5. Other Ap
Flexible Display Technology Industry Segmentation By Geography
- 1. North America
- 2. Europe
- 3. Asia Pacific
- 4. Rest of the World
Flexible Display Technology Industry REPORT HIGHLIGHTS
| Aspects | Details |
|---|---|
| Study Period | 2019-2033 |
| Base Year | 2024 |
| Estimated Year | 2025 |
| Forecast Period | 2025-2033 |
| Historical Period | 2019-2024 |
| Growth Rate | CAGR of 34.80% from 2019-2033 |
| Segmentation |
|
Table of Contents
- 1. Introduction
- 1.1. Research Scope
- 1.2. Market Segmentation
- 1.3. Research Methodology
- 1.4. Definitions and Assumptions
- 2. Executive Summary
- 2.1. Introduction
- 3. Market Dynamics
- 3.1. Introduction
- 3.2. Market Drivers
- 3.2.1. Innovation in Consumer Electronics; Increase in Demand for Greater Picture Quality
- 3.3. Market Restrains
- 3.3.1. Higher R&D Cost and Highly Dynamic Market
- 3.4. Market Trends
- 3.4.1. Adoption of Flexible Display to Grow Significantly in Smartphones and Tablets
- 4. Market Factor Analysis
- 4.1. Porters Five Forces
- 4.2. Supply/Value Chain
- 4.3. PESTEL analysis
- 4.4. Market Entropy
- 4.5. Patent/Trademark Analysis
- 5. Global Flexible Display Technology Industry Analysis, Insights and Forecast, 2019-2031
- 5.1. Market Analysis, Insights and Forecast - by Display Type
- 5.1.1. OLED
- 5.1.2. LCD
- 5.1.3. EPD (Electronic Paper Display)
- 5.1.4. Other Display Types (LED)
- 5.2. Market Analysis, Insights and Forecast - by Substrate Material
- 5.2.1. Glass
- 5.2.2. Plastic
- 5.2.3. Other Substrate Materials
- 5.3. Market Analysis, Insights and Forecast - by Application
- 5.3.1. Smartphones and Tablets
- 5.3.2. Smart Wearables
- 5.3.3. Televisions and Digital Signage Systems
- 5.3.4. Personal Computers and Laptops
- 5.3.5. Other Ap
- 5.4. Market Analysis, Insights and Forecast - by Region
- 5.4.1. North America
- 5.4.2. Europe
- 5.4.3. Asia Pacific
- 5.4.4. Rest of the World
- 5.1. Market Analysis, Insights and Forecast - by Display Type
- 6. North America Flexible Display Technology Industry Analysis, Insights and Forecast, 2019-2031
- 6.1. Market Analysis, Insights and Forecast - by Display Type
- 6.1.1. OLED
- 6.1.2. LCD
- 6.1.3. EPD (Electronic Paper Display)
- 6.1.4. Other Display Types (LED)
- 6.2. Market Analysis, Insights and Forecast - by Substrate Material
- 6.2.1. Glass
- 6.2.2. Plastic
- 6.2.3. Other Substrate Materials
- 6.3. Market Analysis, Insights and Forecast - by Application
- 6.3.1. Smartphones and Tablets
- 6.3.2. Smart Wearables
- 6.3.3. Televisions and Digital Signage Systems
- 6.3.4. Personal Computers and Laptops
- 6.3.5. Other Ap
- 6.1. Market Analysis, Insights and Forecast - by Display Type
- 7. Europe Flexible Display Technology Industry Analysis, Insights and Forecast, 2019-2031
- 7.1. Market Analysis, Insights and Forecast - by Display Type
- 7.1.1. OLED
- 7.1.2. LCD
- 7.1.3. EPD (Electronic Paper Display)
- 7.1.4. Other Display Types (LED)
- 7.2. Market Analysis, Insights and Forecast - by Substrate Material
- 7.2.1. Glass
- 7.2.2. Plastic
- 7.2.3. Other Substrate Materials
- 7.3. Market Analysis, Insights and Forecast - by Application
- 7.3.1. Smartphones and Tablets
- 7.3.2. Smart Wearables
- 7.3.3. Televisions and Digital Signage Systems
- 7.3.4. Personal Computers and Laptops
- 7.3.5. Other Ap
- 7.1. Market Analysis, Insights and Forecast - by Display Type
- 8. Asia Pacific Flexible Display Technology Industry Analysis, Insights and Forecast, 2019-2031
- 8.1. Market Analysis, Insights and Forecast - by Display Type
- 8.1.1. OLED
- 8.1.2. LCD
- 8.1.3. EPD (Electronic Paper Display)
- 8.1.4. Other Display Types (LED)
- 8.2. Market Analysis, Insights and Forecast - by Substrate Material
- 8.2.1. Glass
- 8.2.2. Plastic
- 8.2.3. Other Substrate Materials
- 8.3. Market Analysis, Insights and Forecast - by Application
- 8.3.1. Smartphones and Tablets
- 8.3.2. Smart Wearables
- 8.3.3. Televisions and Digital Signage Systems
- 8.3.4. Personal Computers and Laptops
- 8.3.5. Other Ap
- 8.1. Market Analysis, Insights and Forecast - by Display Type
- 9. Rest of the World Flexible Display Technology Industry Analysis, Insights and Forecast, 2019-2031
- 9.1. Market Analysis, Insights and Forecast - by Display Type
- 9.1.1. OLED
- 9.1.2. LCD
- 9.1.3. EPD (Electronic Paper Display)
- 9.1.4. Other Display Types (LED)
- 9.2. Market Analysis, Insights and Forecast - by Substrate Material
- 9.2.1. Glass
- 9.2.2. Plastic
- 9.2.3. Other Substrate Materials
- 9.3. Market Analysis, Insights and Forecast - by Application
- 9.3.1. Smartphones and Tablets
- 9.3.2. Smart Wearables
- 9.3.3. Televisions and Digital Signage Systems
- 9.3.4. Personal Computers and Laptops
- 9.3.5. Other Ap
- 9.1. Market Analysis, Insights and Forecast - by Display Type
- 10. North America Flexible Display Technology Industry Analysis, Insights and Forecast, 2019-2031
- 10.1. Market Analysis, Insights and Forecast - By Country/Sub-region
- 10.1.1.
- 11. Europe Flexible Display Technology Industry Analysis, Insights and Forecast, 2019-2031
- 11.1. Market Analysis, Insights and Forecast - By Country/Sub-region
- 11.1.1.
- 12. Asia Pacific Flexible Display Technology Industry Analysis, Insights and Forecast, 2019-2031
- 12.1. Market Analysis, Insights and Forecast - By Country/Sub-region
- 12.1.1.
- 13. Rest of the World Flexible Display Technology Industry Analysis, Insights and Forecast, 2019-2031
- 13.1. Market Analysis, Insights and Forecast - By Country/Sub-region
- 13.1.1.
- 14. Competitive Analysis
- 14.1. Global Market Share Analysis 2024
- 14.2. Company Profiles
- 14.2.1 LG Display Co Ltd
- 14.2.1.1. Overview
- 14.2.1.2. Products
- 14.2.1.3. SWOT Analysis
- 14.2.1.4. Recent Developments
- 14.2.1.5. Financials (Based on Availability)
- 14.2.2 TCL Electronics Holdings Limited
- 14.2.2.1. Overview
- 14.2.2.2. Products
- 14.2.2.3. SWOT Analysis
- 14.2.2.4. Recent Developments
- 14.2.2.5. Financials (Based on Availability)
- 14.2.3 Plastic Logic
- 14.2.3.1. Overview
- 14.2.3.2. Products
- 14.2.3.3. SWOT Analysis
- 14.2.3.4. Recent Developments
- 14.2.3.5. Financials (Based on Availability)
- 14.2.4 e-ink Holdings
- 14.2.4.1. Overview
- 14.2.4.2. Products
- 14.2.4.3. SWOT Analysis
- 14.2.4.4. Recent Developments
- 14.2.4.5. Financials (Based on Availability)
- 14.2.5 Samsung Electronics Co Ltd
- 14.2.5.1. Overview
- 14.2.5.2. Products
- 14.2.5.3. SWOT Analysis
- 14.2.5.4. Recent Developments
- 14.2.5.5. Financials (Based on Availability)
- 14.2.6 FlexEnable Technology Limited
- 14.2.6.1. Overview
- 14.2.6.2. Products
- 14.2.6.3. SWOT Analysis
- 14.2.6.4. Recent Developments
- 14.2.6.5. Financials (Based on Availability)
- 14.2.7 Innolux Corporation
- 14.2.7.1. Overview
- 14.2.7.2. Products
- 14.2.7.3. SWOT Analysis
- 14.2.7.4. Recent Developments
- 14.2.7.5. Financials (Based on Availability)
- 14.2.8 Guangzhou Oed Technologies Co Ltd
- 14.2.8.1. Overview
- 14.2.8.2. Products
- 14.2.8.3. SWOT Analysis
- 14.2.8.4. Recent Developments
- 14.2.8.5. Financials (Based on Availability)
- 14.2.9 Chunghwa Picture Tubes Ltd
- 14.2.9.1. Overview
- 14.2.9.2. Products
- 14.2.9.3. SWOT Analysis
- 14.2.9.4. Recent Developments
- 14.2.9.5. Financials (Based on Availability)
- 14.2.10 Microtips Technology*List Not Exhaustive
- 14.2.10.1. Overview
- 14.2.10.2. Products
- 14.2.10.3. SWOT Analysis
- 14.2.10.4. Recent Developments
- 14.2.10.5. Financials (Based on Availability)
- 14.2.11 Huawei Technologies Co Ltd
- 14.2.11.1. Overview
- 14.2.11.2. Products
- 14.2.11.3. SWOT Analysis
- 14.2.11.4. Recent Developments
- 14.2.11.5. Financials (Based on Availability)
- 14.2.12 Sharp Corporation
- 14.2.12.1. Overview
- 14.2.12.2. Products
- 14.2.12.3. SWOT Analysis
- 14.2.12.4. Recent Developments
- 14.2.12.5. Financials (Based on Availability)
- 14.2.13 ROYOLE Corporation
- 14.2.13.1. Overview
- 14.2.13.2. Products
- 14.2.13.3. SWOT Analysis
- 14.2.13.4. Recent Developments
- 14.2.13.5. Financials (Based on Availability)
- 14.2.14 AU Optronics Corp
- 14.2.14.1. Overview
- 14.2.14.2. Products
- 14.2.14.3. SWOT Analysis
- 14.2.14.4. Recent Developments
- 14.2.14.5. Financials (Based on Availability)
- 14.2.15 BOE Technology Group Co Ltd
- 14.2.15.1. Overview
- 14.2.15.2. Products
- 14.2.15.3. SWOT Analysis
- 14.2.15.4. Recent Developments
- 14.2.15.5. Financials (Based on Availability)
- 14.2.1 LG Display Co Ltd
List of Figures
- Figure 1: Global Flexible Display Technology Industry Revenue Breakdown (Million, %) by Region 2024 & 2032
- Figure 2: North America Flexible Display Technology Industry Revenue (Million), by Country 2024 & 2032
- Figure 3: North America Flexible Display Technology Industry Revenue Share (%), by Country 2024 & 2032
- Figure 4: Europe Flexible Display Technology Industry Revenue (Million), by Country 2024 & 2032
- Figure 5: Europe Flexible Display Technology Industry Revenue Share (%), by Country 2024 & 2032
- Figure 6: Asia Pacific Flexible Display Technology Industry Revenue (Million), by Country 2024 & 2032
- Figure 7: Asia Pacific Flexible Display Technology Industry Revenue Share (%), by Country 2024 & 2032
- Figure 8: Rest of the World Flexible Display Technology Industry Revenue (Million), by Country 2024 & 2032
- Figure 9: Rest of the World Flexible Display Technology Industry Revenue Share (%), by Country 2024 & 2032
- Figure 10: North America Flexible Display Technology Industry Revenue (Million), by Display Type 2024 & 2032
- Figure 11: North America Flexible Display Technology Industry Revenue Share (%), by Display Type 2024 & 2032
- Figure 12: North America Flexible Display Technology Industry Revenue (Million), by Substrate Material 2024 & 2032
- Figure 13: North America Flexible Display Technology Industry Revenue Share (%), by Substrate Material 2024 & 2032
- Figure 14: North America Flexible Display Technology Industry Revenue (Million), by Application 2024 & 2032
- Figure 15: North America Flexible Display Technology Industry Revenue Share (%), by Application 2024 & 2032
- Figure 16: North America Flexible Display Technology Industry Revenue (Million), by Country 2024 & 2032
- Figure 17: North America Flexible Display Technology Industry Revenue Share (%), by Country 2024 & 2032
- Figure 18: Europe Flexible Display Technology Industry Revenue (Million), by Display Type 2024 & 2032
- Figure 19: Europe Flexible Display Technology Industry Revenue Share (%), by Display Type 2024 & 2032
- Figure 20: Europe Flexible Display Technology Industry Revenue (Million), by Substrate Material 2024 & 2032
- Figure 21: Europe Flexible Display Technology Industry Revenue Share (%), by Substrate Material 2024 & 2032
- Figure 22: Europe Flexible Display Technology Industry Revenue (Million), by Application 2024 & 2032
- Figure 23: Europe Flexible Display Technology Industry Revenue Share (%), by Application 2024 & 2032
- Figure 24: Europe Flexible Display Technology Industry Revenue (Million), by Country 2024 & 2032
- Figure 25: Europe Flexible Display Technology Industry Revenue Share (%), by Country 2024 & 2032
- Figure 26: Asia Pacific Flexible Display Technology Industry Revenue (Million), by Display Type 2024 & 2032
- Figure 27: Asia Pacific Flexible Display Technology Industry Revenue Share (%), by Display Type 2024 & 2032
- Figure 28: Asia Pacific Flexible Display Technology Industry Revenue (Million), by Substrate Material 2024 & 2032
- Figure 29: Asia Pacific Flexible Display Technology Industry Revenue Share (%), by Substrate Material 2024 & 2032
- Figure 30: Asia Pacific Flexible Display Technology Industry Revenue (Million), by Application 2024 & 2032
- Figure 31: Asia Pacific Flexible Display Technology Industry Revenue Share (%), by Application 2024 & 2032
- Figure 32: Asia Pacific Flexible Display Technology Industry Revenue (Million), by Country 2024 & 2032
- Figure 33: Asia Pacific Flexible Display Technology Industry Revenue Share (%), by Country 2024 & 2032
- Figure 34: Rest of the World Flexible Display Technology Industry Revenue (Million), by Display Type 2024 & 2032
- Figure 35: Rest of the World Flexible Display Technology Industry Revenue Share (%), by Display Type 2024 & 2032
- Figure 36: Rest of the World Flexible Display Technology Industry Revenue (Million), by Substrate Material 2024 & 2032
- Figure 37: Rest of the World Flexible Display Technology Industry Revenue Share (%), by Substrate Material 2024 & 2032
- Figure 38: Rest of the World Flexible Display Technology Industry Revenue (Million), by Application 2024 & 2032
- Figure 39: Rest of the World Flexible Display Technology Industry Revenue Share (%), by Application 2024 & 2032
- Figure 40: Rest of the World Flexible Display Technology Industry Revenue (Million), by Country 2024 & 2032
- Figure 41: Rest of the World Flexible Display Technology Industry Revenue Share (%), by Country 2024 & 2032
List of Tables
- Table 1: Global Flexible Display Technology Industry Revenue Million Forecast, by Region 2019 & 2032
- Table 2: Global Flexible Display Technology Industry Revenue Million Forecast, by Display Type 2019 & 2032
- Table 3: Global Flexible Display Technology Industry Revenue Million Forecast, by Substrate Material 2019 & 2032
- Table 4: Global Flexible Display Technology Industry Revenue Million Forecast, by Application 2019 & 2032
- Table 5: Global Flexible Display Technology Industry Revenue Million Forecast, by Region 2019 & 2032
- Table 6: Global Flexible Display Technology Industry Revenue Million Forecast, by Country 2019 & 2032
- Table 7: Flexible Display Technology Industry Revenue (Million) Forecast, by Application 2019 & 2032
- Table 8: Global Flexible Display Technology Industry Revenue Million Forecast, by Country 2019 & 2032
- Table 9: Flexible Display Technology Industry Revenue (Million) Forecast, by Application 2019 & 2032
- Table 10: Global Flexible Display Technology Industry Revenue Million Forecast, by Country 2019 & 2032
- Table 11: Flexible Display Technology Industry Revenue (Million) Forecast, by Application 2019 & 2032
- Table 12: Global Flexible Display Technology Industry Revenue Million Forecast, by Country 2019 & 2032
- Table 13: Flexible Display Technology Industry Revenue (Million) Forecast, by Application 2019 & 2032
- Table 14: Global Flexible Display Technology Industry Revenue Million Forecast, by Display Type 2019 & 2032
- Table 15: Global Flexible Display Technology Industry Revenue Million Forecast, by Substrate Material 2019 & 2032
- Table 16: Global Flexible Display Technology Industry Revenue Million Forecast, by Application 2019 & 2032
- Table 17: Global Flexible Display Technology Industry Revenue Million Forecast, by Country 2019 & 2032
- Table 18: Global Flexible Display Technology Industry Revenue Million Forecast, by Display Type 2019 & 2032
- Table 19: Global Flexible Display Technology Industry Revenue Million Forecast, by Substrate Material 2019 & 2032
- Table 20: Global Flexible Display Technology Industry Revenue Million Forecast, by Application 2019 & 2032
- Table 21: Global Flexible Display Technology Industry Revenue Million Forecast, by Country 2019 & 2032
- Table 22: Global Flexible Display Technology Industry Revenue Million Forecast, by Display Type 2019 & 2032
- Table 23: Global Flexible Display Technology Industry Revenue Million Forecast, by Substrate Material 2019 & 2032
- Table 24: Global Flexible Display Technology Industry Revenue Million Forecast, by Application 2019 & 2032
- Table 25: Global Flexible Display Technology Industry Revenue Million Forecast, by Country 2019 & 2032
- Table 26: Global Flexible Display Technology Industry Revenue Million Forecast, by Display Type 2019 & 2032
- Table 27: Global Flexible Display Technology Industry Revenue Million Forecast, by Substrate Material 2019 & 2032
- Table 28: Global Flexible Display Technology Industry Revenue Million Forecast, by Application 2019 & 2032
- Table 29: Global Flexible Display Technology Industry Revenue Million Forecast, by Country 2019 & 2032
Frequently Asked Questions
1. What is the projected Compound Annual Growth Rate (CAGR) of the Flexible Display Technology Industry?
The projected CAGR is approximately 34.80%.
2. Which companies are prominent players in the Flexible Display Technology Industry?
Key companies in the market include LG Display Co Ltd, TCL Electronics Holdings Limited, Plastic Logic, e-ink Holdings, Samsung Electronics Co Ltd, FlexEnable Technology Limited, Innolux Corporation, Guangzhou Oed Technologies Co Ltd, Chunghwa Picture Tubes Ltd, Microtips Technology*List Not Exhaustive, Huawei Technologies Co Ltd, Sharp Corporation, ROYOLE Corporation, AU Optronics Corp, BOE Technology Group Co Ltd.
3. What are the main segments of the Flexible Display Technology Industry?
The market segments include Display Type, Substrate Material, Application.
4. Can you provide details about the market size?
The market size is estimated to be USD 15.22 Million as of 2022.
5. What are some drivers contributing to market growth?
Innovation in Consumer Electronics; Increase in Demand for Greater Picture Quality.
6. What are the notable trends driving market growth?
Adoption of Flexible Display to Grow Significantly in Smartphones and Tablets.
7. Are there any restraints impacting market growth?
Higher R&D Cost and Highly Dynamic Market.
8. Can you provide examples of recent developments in the market?
May 2022 - LG Display brought its next-generation OLED solutions to the 2022 Society for Information Display (SID) held in San Jose, California, US. By introducing state-of-the-art OLED products ranging from its next-generation OLED.EX to bendable and foldable OLED panels, the company highlighted the evolution and versatility of OLED technology, aiming to solidify its OLED positioning in the market.
9. What pricing options are available for accessing the report?
Pricing options include single-user, multi-user, and enterprise licenses priced at USD 4750, USD 5250, and USD 8750 respectively.
10. Is the market size provided in terms of value or volume?
The market size is provided in terms of value, measured in Million.
11. Are there any specific market keywords associated with the report?
Yes, the market keyword associated with the report is "Flexible Display Technology Industry," which aids in identifying and referencing the specific market segment covered.
12. How do I determine which pricing option suits my needs best?
The pricing options vary based on user requirements and access needs. Individual users may opt for single-user licenses, while businesses requiring broader access may choose multi-user or enterprise licenses for cost-effective access to the report.
13. Are there any additional resources or data provided in the Flexible Display Technology Industry report?
While the report offers comprehensive insights, it's advisable to review the specific contents or supplementary materials provided to ascertain if additional resources or data are available.
14. How can I stay updated on further developments or reports in the Flexible Display Technology Industry?
To stay informed about further developments, trends, and reports in the Flexible Display Technology Industry, consider subscribing to industry newsletters, following relevant companies and organizations, or regularly checking reputable industry news sources and publications.
Methodology
Step 1 - Identification of Relevant Samples Size from Population Database


Step 2 - Approaches for Defining Global Market Size (Value, Volume* & Price*)

Note*: In applicable scenarios
Step 3 - Data Sources
Primary Research
- Web Analytics
- Survey Reports
- Research Institute
- Latest Research Reports
- Opinion Leaders
Secondary Research
- Annual Reports
- White Paper
- Latest Press Release
- Industry Association
- Paid Database
- Investor Presentations

Step 4 - Data Triangulation
Involves using different sources of information in order to increase the validity of a study
These sources are likely to be stakeholders in a program - participants, other researchers, program staff, other community members, and so on.
Then we put all data in single framework & apply various statistical tools to find out the dynamic on the market.
During the analysis stage, feedback from the stakeholder groups would be compared to determine areas of agreement as well as areas of divergence
