

Key Insights
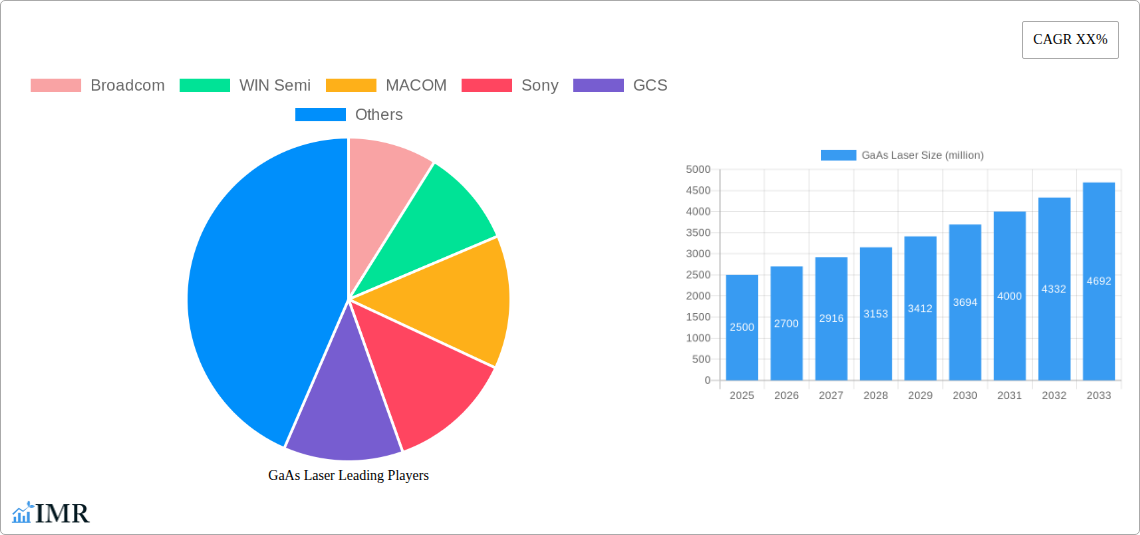
The GaAs laser market is experiencing robust growth, driven by increasing demand across diverse applications. The market's size in 2025 is estimated at $2.5 billion, reflecting a Compound Annual Growth Rate (CAGR) of approximately 8% from 2019 to 2025. This expansion is fueled primarily by the burgeoning optical communication sector, particularly in high-speed data transmission and 5G infrastructure development, which requires high-performance lasers. Furthermore, growing adoption of GaAs lasers in industrial sensing, medical diagnostics, and laser printing contributes to market expansion. Technological advancements, such as improved laser efficiency and miniaturization, further enhance market prospects. Key players like Broadcom, WIN Semi, MACOM, and Sony are driving innovation and competition, leading to better performance, lower costs, and greater market penetration.
However, certain restraints limit market growth. The relatively high cost of GaAs lasers compared to alternative technologies poses a challenge, particularly in price-sensitive applications. Moreover, the market is prone to fluctuations in the global semiconductor industry, which can impact production and supply chains. Despite these challenges, the long-term outlook for the GaAs laser market remains optimistic. Continuous research and development efforts aimed at improving laser performance and reducing costs are expected to drive further growth. The increasing adoption of automation and data-driven technologies across various industries will also contribute to the market's expansion in the coming years, particularly in the forecast period of 2025 to 2033. Segmentation within the market includes various types of GaAs lasers, based on their wavelength and power output, catering to specific application needs.
GaAs Laser Market Report: A Comprehensive Analysis (2019-2033)
This comprehensive report provides an in-depth analysis of the GaAs Laser market, encompassing market dynamics, growth trends, regional segmentation, product landscape, key players, and future outlook. The study period covers 2019-2033, with 2025 as the base and estimated year. The forecast period spans 2025-2033, and the historical period covers 2019-2024. This report is crucial for industry professionals, investors, and researchers seeking a detailed understanding of this rapidly evolving market within the broader optoelectronics and semiconductor industries. Market values are presented in million units.
GaAs Laser Market Dynamics & Structure
The GaAs laser market exhibits a moderately concentrated structure, with key players like Broadcom, WIN Semi, and MACOM holding significant market share. Technological innovation, driven by the demand for higher power, faster modulation speeds, and improved efficiency, is a primary growth driver. Stringent regulatory frameworks concerning laser safety and environmental impact also shape market dynamics. Competitive pressure stems from alternative technologies like VCSELs and other semiconductor lasers. End-user demographics encompass diverse sectors, including telecommunications, data centers, industrial sensing, and medical applications. The market has witnessed several mergers and acquisitions (M&A) in recent years, with xx M&A deals recorded between 2019 and 2024, indicating consolidation and strategic expansion within the sector.
- Market Concentration: Moderately concentrated, with top 5 players holding approximately xx% of market share in 2024.
- Technological Innovation: Focus on higher power, faster modulation speeds, and improved energy efficiency.
- Regulatory Landscape: Stringent safety and environmental regulations influencing market practices.
- Competitive Substitutes: VCSELs and other semiconductor lasers pose competitive challenges.
- End-User Demographics: Telecommunications, data centers, industrial sensing, and medical applications are key end-user segments.
- M&A Activity: xx M&A deals recorded between 2019 and 2024, indicating market consolidation.
GaAs Laser Growth Trends & Insights
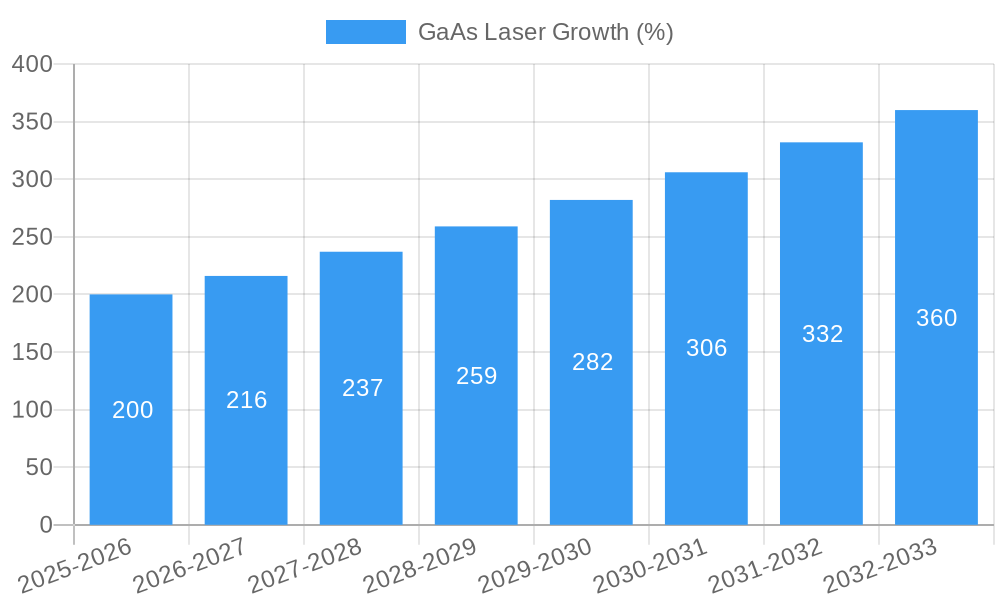
The GaAs laser market experienced robust growth during the historical period (2019-2024), with a CAGR of xx%. This growth is primarily attributable to increasing demand from data centers, the proliferation of 5G networks, and the expansion of high-speed optical communication systems. The market size reached xx million units in 2024 and is projected to reach xx million units by 2033, exhibiting a CAGR of xx% during the forecast period (2025-2033). Technological disruptions, such as the adoption of advanced packaging techniques and the development of higher-power lasers, are driving further market expansion. Shifting consumer behavior towards higher bandwidth and faster data transmission speeds fuels this growth. Market penetration in key segments like telecommunications continues to increase, reaching xx% in 2024.
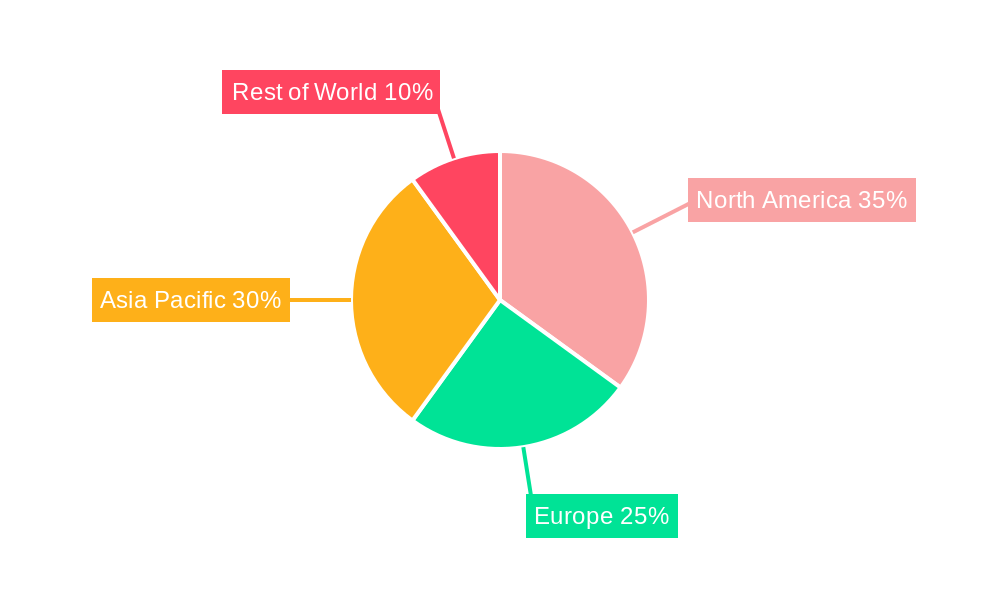
Dominant Regions, Countries, or Segments in GaAs Laser
North America currently dominates the GaAs laser market, accounting for approximately xx% of the global market share in 2024. This dominance is driven by a strong presence of key players, significant investments in research and development, and robust demand from the telecommunications and data center sectors. Asia-Pacific is projected to witness the highest growth rate during the forecast period, fueled by rapid infrastructure development and increasing adoption of advanced technologies in emerging economies.
- North America: Strong presence of key players, robust R&D investments, and high demand from telecommunications and data centers.
- Asia-Pacific: High growth potential driven by infrastructure development and technology adoption in emerging economies.
- Europe: Steady growth driven by government initiatives and investments in fiber optic communication networks.
GaAs Laser Product Landscape
GaAs lasers are available in various configurations, including edge-emitting and vertical-cavity surface-emitting lasers (VCSELs). Recent innovations have focused on improving power output, modulation bandwidth, and wavelength stability. These advancements cater to the growing demand for high-speed data transmission, optical sensing, and laser-based industrial applications. Unique selling propositions include superior performance characteristics such as high efficiency, narrow linewidth, and wavelength tunability, making them ideal for specialized applications.
Key Drivers, Barriers & Challenges in GaAs Laser
Key Drivers: The increasing demand for high-speed data transmission, particularly driven by 5G and data center expansion, acts as a primary market driver. Technological advancements, such as the development of more efficient and powerful GaAs lasers, further propel market growth. Favorable government policies and investments in infrastructure projects also contribute to the positive market outlook.
Key Challenges: Supply chain disruptions due to geopolitical factors and material scarcity could pose significant challenges. Stringent regulatory standards concerning laser safety and environmental compliance also add complexity. Intense competition from alternative technologies, such as VCSELs and other semiconductor lasers, impacts market growth. The estimated impact of these challenges on the market growth rate is approximately xx% reduction during the forecast period.
Emerging Opportunities in GaAs Laser
Untapped markets in developing countries present significant opportunities for expansion. The development of new applications, particularly in areas like biomedical imaging and LiDAR systems, offers lucrative prospects. Evolving consumer preferences towards higher bandwidth and faster data transmission continue to fuel innovation and create new opportunities within the GaAs laser market.
Growth Accelerators in the GaAs Laser Industry
Technological breakthroughs in materials science and laser design are driving long-term growth. Strategic partnerships between leading players are fostering innovation and market expansion. Government initiatives promoting the adoption of advanced optical technologies in various sectors further accelerate market growth. Expansion into new applications, particularly in the medical and industrial sensing sectors, creates significant growth potential.
Key Players Shaping the GaAs Laser Market
- Broadcom
- WIN Semi
- MACOM
- Sony
- GCS
- II-VI Incorporated
- OSRAM
- Everbright Photonics
- Kyotosemi
- Changelight
Notable Milestones in GaAs Laser Sector
- 2020-Q4: Broadcom launched a new high-power GaAs laser for data center applications.
- 2022-Q1: MACOM and WIN Semi announced a strategic partnership to develop next-generation GaAs laser technology.
- 2023-Q2: II-VI Incorporated acquired a smaller GaAs laser manufacturer, expanding its market share.
- 2024-Q3: Significant advancements in high-power, high-speed GaAs laser technology are presented at major industry conferences.
In-Depth GaAs Laser Market Outlook
The GaAs laser market is poised for continued growth, fueled by technological advancements, increased demand from key sectors, and expansion into new applications. Strategic investments in R&D and collaborative partnerships are crucial for sustained market expansion. The market's long-term growth prospects remain robust, with opportunities for both established players and new entrants to capitalize on the evolving technological landscape and increasing consumer demands.
GaAs Laser Segmentation
-
1. Application
- 1.1. Network Communication
- 1.2. Light Sensing
- 1.3. Face Recognition
- 1.4. Laser Lighting
- 1.5. Vehicle Electronics
- 1.6. Consumer Electronics
- 1.7. Lidar
- 1.8. Other
-
2. Types
- 2.1. Avalanche Diode
- 2.2. VCSEL
- 2.3. EEL
GaAs Laser Segmentation By Geography
-
1. North America
- 1.1. United States
- 1.2. Canada
- 1.3. Mexico
-
2. South America
- 2.1. Brazil
- 2.2. Argentina
- 2.3. Rest of South America
-
3. Europe
- 3.1. United Kingdom
- 3.2. Germany
- 3.3. France
- 3.4. Italy
- 3.5. Spain
- 3.6. Russia
- 3.7. Benelux
- 3.8. Nordics
- 3.9. Rest of Europe
-
4. Middle East & Africa
- 4.1. Turkey
- 4.2. Israel
- 4.3. GCC
- 4.4. North Africa
- 4.5. South Africa
- 4.6. Rest of Middle East & Africa
-
5. Asia Pacific
- 5.1. China
- 5.2. India
- 5.3. Japan
- 5.4. South Korea
- 5.5. ASEAN
- 5.6. Oceania
- 5.7. Rest of Asia Pacific
GaAs Laser REPORT HIGHLIGHTS
| Aspects | Details |
|---|---|
| Study Period | 2019-2033 |
| Base Year | 2024 |
| Estimated Year | 2025 |
| Forecast Period | 2025-2033 |
| Historical Period | 2019-2024 |
| Growth Rate | CAGR of XX% from 2019-2033 |
| Segmentation |
|
Table of Contents
- 1. Introduction
- 1.1. Research Scope
- 1.2. Market Segmentation
- 1.3. Research Methodology
- 1.4. Definitions and Assumptions
- 2. Executive Summary
- 2.1. Introduction
- 3. Market Dynamics
- 3.1. Introduction
- 3.2. Market Drivers
- 3.3. Market Restrains
- 3.4. Market Trends
- 4. Market Factor Analysis
- 4.1. Porters Five Forces
- 4.2. Supply/Value Chain
- 4.3. PESTEL analysis
- 4.4. Market Entropy
- 4.5. Patent/Trademark Analysis
- 5. Global GaAs Laser Analysis, Insights and Forecast, 2019-2031
- 5.1. Market Analysis, Insights and Forecast - by Application
- 5.1.1. Network Communication
- 5.1.2. Light Sensing
- 5.1.3. Face Recognition
- 5.1.4. Laser Lighting
- 5.1.5. Vehicle Electronics
- 5.1.6. Consumer Electronics
- 5.1.7. Lidar
- 5.1.8. Other
- 5.2. Market Analysis, Insights and Forecast - by Types
- 5.2.1. Avalanche Diode
- 5.2.2. VCSEL
- 5.2.3. EEL
- 5.3. Market Analysis, Insights and Forecast - by Region
- 5.3.1. North America
- 5.3.2. South America
- 5.3.3. Europe
- 5.3.4. Middle East & Africa
- 5.3.5. Asia Pacific
- 5.1. Market Analysis, Insights and Forecast - by Application
- 6. North America GaAs Laser Analysis, Insights and Forecast, 2019-2031
- 6.1. Market Analysis, Insights and Forecast - by Application
- 6.1.1. Network Communication
- 6.1.2. Light Sensing
- 6.1.3. Face Recognition
- 6.1.4. Laser Lighting
- 6.1.5. Vehicle Electronics
- 6.1.6. Consumer Electronics
- 6.1.7. Lidar
- 6.1.8. Other
- 6.2. Market Analysis, Insights and Forecast - by Types
- 6.2.1. Avalanche Diode
- 6.2.2. VCSEL
- 6.2.3. EEL
- 6.1. Market Analysis, Insights and Forecast - by Application
- 7. South America GaAs Laser Analysis, Insights and Forecast, 2019-2031
- 7.1. Market Analysis, Insights and Forecast - by Application
- 7.1.1. Network Communication
- 7.1.2. Light Sensing
- 7.1.3. Face Recognition
- 7.1.4. Laser Lighting
- 7.1.5. Vehicle Electronics
- 7.1.6. Consumer Electronics
- 7.1.7. Lidar
- 7.1.8. Other
- 7.2. Market Analysis, Insights and Forecast - by Types
- 7.2.1. Avalanche Diode
- 7.2.2. VCSEL
- 7.2.3. EEL
- 7.1. Market Analysis, Insights and Forecast - by Application
- 8. Europe GaAs Laser Analysis, Insights and Forecast, 2019-2031
- 8.1. Market Analysis, Insights and Forecast - by Application
- 8.1.1. Network Communication
- 8.1.2. Light Sensing
- 8.1.3. Face Recognition
- 8.1.4. Laser Lighting
- 8.1.5. Vehicle Electronics
- 8.1.6. Consumer Electronics
- 8.1.7. Lidar
- 8.1.8. Other
- 8.2. Market Analysis, Insights and Forecast - by Types
- 8.2.1. Avalanche Diode
- 8.2.2. VCSEL
- 8.2.3. EEL
- 8.1. Market Analysis, Insights and Forecast - by Application
- 9. Middle East & Africa GaAs Laser Analysis, Insights and Forecast, 2019-2031
- 9.1. Market Analysis, Insights and Forecast - by Application
- 9.1.1. Network Communication
- 9.1.2. Light Sensing
- 9.1.3. Face Recognition
- 9.1.4. Laser Lighting
- 9.1.5. Vehicle Electronics
- 9.1.6. Consumer Electronics
- 9.1.7. Lidar
- 9.1.8. Other
- 9.2. Market Analysis, Insights and Forecast - by Types
- 9.2.1. Avalanche Diode
- 9.2.2. VCSEL
- 9.2.3. EEL
- 9.1. Market Analysis, Insights and Forecast - by Application
- 10. Asia Pacific GaAs Laser Analysis, Insights and Forecast, 2019-2031
- 10.1. Market Analysis, Insights and Forecast - by Application
- 10.1.1. Network Communication
- 10.1.2. Light Sensing
- 10.1.3. Face Recognition
- 10.1.4. Laser Lighting
- 10.1.5. Vehicle Electronics
- 10.1.6. Consumer Electronics
- 10.1.7. Lidar
- 10.1.8. Other
- 10.2. Market Analysis, Insights and Forecast - by Types
- 10.2.1. Avalanche Diode
- 10.2.2. VCSEL
- 10.2.3. EEL
- 10.1. Market Analysis, Insights and Forecast - by Application
- 11. Competitive Analysis
- 11.1. Global Market Share Analysis 2024
- 11.2. Company Profiles
- 11.2.1 Broadcom
- 11.2.1.1. Overview
- 11.2.1.2. Products
- 11.2.1.3. SWOT Analysis
- 11.2.1.4. Recent Developments
- 11.2.1.5. Financials (Based on Availability)
- 11.2.2 WIN Semi
- 11.2.2.1. Overview
- 11.2.2.2. Products
- 11.2.2.3. SWOT Analysis
- 11.2.2.4. Recent Developments
- 11.2.2.5. Financials (Based on Availability)
- 11.2.3 MACOM
- 11.2.3.1. Overview
- 11.2.3.2. Products
- 11.2.3.3. SWOT Analysis
- 11.2.3.4. Recent Developments
- 11.2.3.5. Financials (Based on Availability)
- 11.2.4 Sony
- 11.2.4.1. Overview
- 11.2.4.2. Products
- 11.2.4.3. SWOT Analysis
- 11.2.4.4. Recent Developments
- 11.2.4.5. Financials (Based on Availability)
- 11.2.5 GCS
- 11.2.5.1. Overview
- 11.2.5.2. Products
- 11.2.5.3. SWOT Analysis
- 11.2.5.4. Recent Developments
- 11.2.5.5. Financials (Based on Availability)
- 11.2.6 II-VI Incorporated
- 11.2.6.1. Overview
- 11.2.6.2. Products
- 11.2.6.3. SWOT Analysis
- 11.2.6.4. Recent Developments
- 11.2.6.5. Financials (Based on Availability)
- 11.2.7 OSRAM
- 11.2.7.1. Overview
- 11.2.7.2. Products
- 11.2.7.3. SWOT Analysis
- 11.2.7.4. Recent Developments
- 11.2.7.5. Financials (Based on Availability)
- 11.2.8 Everbright Photonics
- 11.2.8.1. Overview
- 11.2.8.2. Products
- 11.2.8.3. SWOT Analysis
- 11.2.8.4. Recent Developments
- 11.2.8.5. Financials (Based on Availability)
- 11.2.9 Kyotosemi
- 11.2.9.1. Overview
- 11.2.9.2. Products
- 11.2.9.3. SWOT Analysis
- 11.2.9.4. Recent Developments
- 11.2.9.5. Financials (Based on Availability)
- 11.2.10 Changelight
- 11.2.10.1. Overview
- 11.2.10.2. Products
- 11.2.10.3. SWOT Analysis
- 11.2.10.4. Recent Developments
- 11.2.10.5. Financials (Based on Availability)
- 11.2.1 Broadcom
List of Figures
- Figure 1: Global GaAs Laser Revenue Breakdown (million, %) by Region 2024 & 2032
- Figure 2: Global GaAs Laser Volume Breakdown (K, %) by Region 2024 & 2032
- Figure 3: North America GaAs Laser Revenue (million), by Application 2024 & 2032
- Figure 4: North America GaAs Laser Volume (K), by Application 2024 & 2032
- Figure 5: North America GaAs Laser Revenue Share (%), by Application 2024 & 2032
- Figure 6: North America GaAs Laser Volume Share (%), by Application 2024 & 2032
- Figure 7: North America GaAs Laser Revenue (million), by Types 2024 & 2032
- Figure 8: North America GaAs Laser Volume (K), by Types 2024 & 2032
- Figure 9: North America GaAs Laser Revenue Share (%), by Types 2024 & 2032
- Figure 10: North America GaAs Laser Volume Share (%), by Types 2024 & 2032
- Figure 11: North America GaAs Laser Revenue (million), by Country 2024 & 2032
- Figure 12: North America GaAs Laser Volume (K), by Country 2024 & 2032
- Figure 13: North America GaAs Laser Revenue Share (%), by Country 2024 & 2032
- Figure 14: North America GaAs Laser Volume Share (%), by Country 2024 & 2032
- Figure 15: South America GaAs Laser Revenue (million), by Application 2024 & 2032
- Figure 16: South America GaAs Laser Volume (K), by Application 2024 & 2032
- Figure 17: South America GaAs Laser Revenue Share (%), by Application 2024 & 2032
- Figure 18: South America GaAs Laser Volume Share (%), by Application 2024 & 2032
- Figure 19: South America GaAs Laser Revenue (million), by Types 2024 & 2032
- Figure 20: South America GaAs Laser Volume (K), by Types 2024 & 2032
- Figure 21: South America GaAs Laser Revenue Share (%), by Types 2024 & 2032
- Figure 22: South America GaAs Laser Volume Share (%), by Types 2024 & 2032
- Figure 23: South America GaAs Laser Revenue (million), by Country 2024 & 2032
- Figure 24: South America GaAs Laser Volume (K), by Country 2024 & 2032
- Figure 25: South America GaAs Laser Revenue Share (%), by Country 2024 & 2032
- Figure 26: South America GaAs Laser Volume Share (%), by Country 2024 & 2032
- Figure 27: Europe GaAs Laser Revenue (million), by Application 2024 & 2032
- Figure 28: Europe GaAs Laser Volume (K), by Application 2024 & 2032
- Figure 29: Europe GaAs Laser Revenue Share (%), by Application 2024 & 2032
- Figure 30: Europe GaAs Laser Volume Share (%), by Application 2024 & 2032
- Figure 31: Europe GaAs Laser Revenue (million), by Types 2024 & 2032
- Figure 32: Europe GaAs Laser Volume (K), by Types 2024 & 2032
- Figure 33: Europe GaAs Laser Revenue Share (%), by Types 2024 & 2032
- Figure 34: Europe GaAs Laser Volume Share (%), by Types 2024 & 2032
- Figure 35: Europe GaAs Laser Revenue (million), by Country 2024 & 2032
- Figure 36: Europe GaAs Laser Volume (K), by Country 2024 & 2032
- Figure 37: Europe GaAs Laser Revenue Share (%), by Country 2024 & 2032
- Figure 38: Europe GaAs Laser Volume Share (%), by Country 2024 & 2032
- Figure 39: Middle East & Africa GaAs Laser Revenue (million), by Application 2024 & 2032
- Figure 40: Middle East & Africa GaAs Laser Volume (K), by Application 2024 & 2032
- Figure 41: Middle East & Africa GaAs Laser Revenue Share (%), by Application 2024 & 2032
- Figure 42: Middle East & Africa GaAs Laser Volume Share (%), by Application 2024 & 2032
- Figure 43: Middle East & Africa GaAs Laser Revenue (million), by Types 2024 & 2032
- Figure 44: Middle East & Africa GaAs Laser Volume (K), by Types 2024 & 2032
- Figure 45: Middle East & Africa GaAs Laser Revenue Share (%), by Types 2024 & 2032
- Figure 46: Middle East & Africa GaAs Laser Volume Share (%), by Types 2024 & 2032
- Figure 47: Middle East & Africa GaAs Laser Revenue (million), by Country 2024 & 2032
- Figure 48: Middle East & Africa GaAs Laser Volume (K), by Country 2024 & 2032
- Figure 49: Middle East & Africa GaAs Laser Revenue Share (%), by Country 2024 & 2032
- Figure 50: Middle East & Africa GaAs Laser Volume Share (%), by Country 2024 & 2032
- Figure 51: Asia Pacific GaAs Laser Revenue (million), by Application 2024 & 2032
- Figure 52: Asia Pacific GaAs Laser Volume (K), by Application 2024 & 2032
- Figure 53: Asia Pacific GaAs Laser Revenue Share (%), by Application 2024 & 2032
- Figure 54: Asia Pacific GaAs Laser Volume Share (%), by Application 2024 & 2032
- Figure 55: Asia Pacific GaAs Laser Revenue (million), by Types 2024 & 2032
- Figure 56: Asia Pacific GaAs Laser Volume (K), by Types 2024 & 2032
- Figure 57: Asia Pacific GaAs Laser Revenue Share (%), by Types 2024 & 2032
- Figure 58: Asia Pacific GaAs Laser Volume Share (%), by Types 2024 & 2032
- Figure 59: Asia Pacific GaAs Laser Revenue (million), by Country 2024 & 2032
- Figure 60: Asia Pacific GaAs Laser Volume (K), by Country 2024 & 2032
- Figure 61: Asia Pacific GaAs Laser Revenue Share (%), by Country 2024 & 2032
- Figure 62: Asia Pacific GaAs Laser Volume Share (%), by Country 2024 & 2032
List of Tables
- Table 1: Global GaAs Laser Revenue million Forecast, by Region 2019 & 2032
- Table 2: Global GaAs Laser Volume K Forecast, by Region 2019 & 2032
- Table 3: Global GaAs Laser Revenue million Forecast, by Application 2019 & 2032
- Table 4: Global GaAs Laser Volume K Forecast, by Application 2019 & 2032
- Table 5: Global GaAs Laser Revenue million Forecast, by Types 2019 & 2032
- Table 6: Global GaAs Laser Volume K Forecast, by Types 2019 & 2032
- Table 7: Global GaAs Laser Revenue million Forecast, by Region 2019 & 2032
- Table 8: Global GaAs Laser Volume K Forecast, by Region 2019 & 2032
- Table 9: Global GaAs Laser Revenue million Forecast, by Application 2019 & 2032
- Table 10: Global GaAs Laser Volume K Forecast, by Application 2019 & 2032
- Table 11: Global GaAs Laser Revenue million Forecast, by Types 2019 & 2032
- Table 12: Global GaAs Laser Volume K Forecast, by Types 2019 & 2032
- Table 13: Global GaAs Laser Revenue million Forecast, by Country 2019 & 2032
- Table 14: Global GaAs Laser Volume K Forecast, by Country 2019 & 2032
- Table 15: United States GaAs Laser Revenue (million) Forecast, by Application 2019 & 2032
- Table 16: United States GaAs Laser Volume (K) Forecast, by Application 2019 & 2032
- Table 17: Canada GaAs Laser Revenue (million) Forecast, by Application 2019 & 2032
- Table 18: Canada GaAs Laser Volume (K) Forecast, by Application 2019 & 2032
- Table 19: Mexico GaAs Laser Revenue (million) Forecast, by Application 2019 & 2032
- Table 20: Mexico GaAs Laser Volume (K) Forecast, by Application 2019 & 2032
- Table 21: Global GaAs Laser Revenue million Forecast, by Application 2019 & 2032
- Table 22: Global GaAs Laser Volume K Forecast, by Application 2019 & 2032
- Table 23: Global GaAs Laser Revenue million Forecast, by Types 2019 & 2032
- Table 24: Global GaAs Laser Volume K Forecast, by Types 2019 & 2032
- Table 25: Global GaAs Laser Revenue million Forecast, by Country 2019 & 2032
- Table 26: Global GaAs Laser Volume K Forecast, by Country 2019 & 2032
- Table 27: Brazil GaAs Laser Revenue (million) Forecast, by Application 2019 & 2032
- Table 28: Brazil GaAs Laser Volume (K) Forecast, by Application 2019 & 2032
- Table 29: Argentina GaAs Laser Revenue (million) Forecast, by Application 2019 & 2032
- Table 30: Argentina GaAs Laser Volume (K) Forecast, by Application 2019 & 2032
- Table 31: Rest of South America GaAs Laser Revenue (million) Forecast, by Application 2019 & 2032
- Table 32: Rest of South America GaAs Laser Volume (K) Forecast, by Application 2019 & 2032
- Table 33: Global GaAs Laser Revenue million Forecast, by Application 2019 & 2032
- Table 34: Global GaAs Laser Volume K Forecast, by Application 2019 & 2032
- Table 35: Global GaAs Laser Revenue million Forecast, by Types 2019 & 2032
- Table 36: Global GaAs Laser Volume K Forecast, by Types 2019 & 2032
- Table 37: Global GaAs Laser Revenue million Forecast, by Country 2019 & 2032
- Table 38: Global GaAs Laser Volume K Forecast, by Country 2019 & 2032
- Table 39: United Kingdom GaAs Laser Revenue (million) Forecast, by Application 2019 & 2032
- Table 40: United Kingdom GaAs Laser Volume (K) Forecast, by Application 2019 & 2032
- Table 41: Germany GaAs Laser Revenue (million) Forecast, by Application 2019 & 2032
- Table 42: Germany GaAs Laser Volume (K) Forecast, by Application 2019 & 2032
- Table 43: France GaAs Laser Revenue (million) Forecast, by Application 2019 & 2032
- Table 44: France GaAs Laser Volume (K) Forecast, by Application 2019 & 2032
- Table 45: Italy GaAs Laser Revenue (million) Forecast, by Application 2019 & 2032
- Table 46: Italy GaAs Laser Volume (K) Forecast, by Application 2019 & 2032
- Table 47: Spain GaAs Laser Revenue (million) Forecast, by Application 2019 & 2032
- Table 48: Spain GaAs Laser Volume (K) Forecast, by Application 2019 & 2032
- Table 49: Russia GaAs Laser Revenue (million) Forecast, by Application 2019 & 2032
- Table 50: Russia GaAs Laser Volume (K) Forecast, by Application 2019 & 2032
- Table 51: Benelux GaAs Laser Revenue (million) Forecast, by Application 2019 & 2032
- Table 52: Benelux GaAs Laser Volume (K) Forecast, by Application 2019 & 2032
- Table 53: Nordics GaAs Laser Revenue (million) Forecast, by Application 2019 & 2032
- Table 54: Nordics GaAs Laser Volume (K) Forecast, by Application 2019 & 2032
- Table 55: Rest of Europe GaAs Laser Revenue (million) Forecast, by Application 2019 & 2032
- Table 56: Rest of Europe GaAs Laser Volume (K) Forecast, by Application 2019 & 2032
- Table 57: Global GaAs Laser Revenue million Forecast, by Application 2019 & 2032
- Table 58: Global GaAs Laser Volume K Forecast, by Application 2019 & 2032
- Table 59: Global GaAs Laser Revenue million Forecast, by Types 2019 & 2032
- Table 60: Global GaAs Laser Volume K Forecast, by Types 2019 & 2032
- Table 61: Global GaAs Laser Revenue million Forecast, by Country 2019 & 2032
- Table 62: Global GaAs Laser Volume K Forecast, by Country 2019 & 2032
- Table 63: Turkey GaAs Laser Revenue (million) Forecast, by Application 2019 & 2032
- Table 64: Turkey GaAs Laser Volume (K) Forecast, by Application 2019 & 2032
- Table 65: Israel GaAs Laser Revenue (million) Forecast, by Application 2019 & 2032
- Table 66: Israel GaAs Laser Volume (K) Forecast, by Application 2019 & 2032
- Table 67: GCC GaAs Laser Revenue (million) Forecast, by Application 2019 & 2032
- Table 68: GCC GaAs Laser Volume (K) Forecast, by Application 2019 & 2032
- Table 69: North Africa GaAs Laser Revenue (million) Forecast, by Application 2019 & 2032
- Table 70: North Africa GaAs Laser Volume (K) Forecast, by Application 2019 & 2032
- Table 71: South Africa GaAs Laser Revenue (million) Forecast, by Application 2019 & 2032
- Table 72: South Africa GaAs Laser Volume (K) Forecast, by Application 2019 & 2032
- Table 73: Rest of Middle East & Africa GaAs Laser Revenue (million) Forecast, by Application 2019 & 2032
- Table 74: Rest of Middle East & Africa GaAs Laser Volume (K) Forecast, by Application 2019 & 2032
- Table 75: Global GaAs Laser Revenue million Forecast, by Application 2019 & 2032
- Table 76: Global GaAs Laser Volume K Forecast, by Application 2019 & 2032
- Table 77: Global GaAs Laser Revenue million Forecast, by Types 2019 & 2032
- Table 78: Global GaAs Laser Volume K Forecast, by Types 2019 & 2032
- Table 79: Global GaAs Laser Revenue million Forecast, by Country 2019 & 2032
- Table 80: Global GaAs Laser Volume K Forecast, by Country 2019 & 2032
- Table 81: China GaAs Laser Revenue (million) Forecast, by Application 2019 & 2032
- Table 82: China GaAs Laser Volume (K) Forecast, by Application 2019 & 2032
- Table 83: India GaAs Laser Revenue (million) Forecast, by Application 2019 & 2032
- Table 84: India GaAs Laser Volume (K) Forecast, by Application 2019 & 2032
- Table 85: Japan GaAs Laser Revenue (million) Forecast, by Application 2019 & 2032
- Table 86: Japan GaAs Laser Volume (K) Forecast, by Application 2019 & 2032
- Table 87: South Korea GaAs Laser Revenue (million) Forecast, by Application 2019 & 2032
- Table 88: South Korea GaAs Laser Volume (K) Forecast, by Application 2019 & 2032
- Table 89: ASEAN GaAs Laser Revenue (million) Forecast, by Application 2019 & 2032
- Table 90: ASEAN GaAs Laser Volume (K) Forecast, by Application 2019 & 2032
- Table 91: Oceania GaAs Laser Revenue (million) Forecast, by Application 2019 & 2032
- Table 92: Oceania GaAs Laser Volume (K) Forecast, by Application 2019 & 2032
- Table 93: Rest of Asia Pacific GaAs Laser Revenue (million) Forecast, by Application 2019 & 2032
- Table 94: Rest of Asia Pacific GaAs Laser Volume (K) Forecast, by Application 2019 & 2032
Frequently Asked Questions
1. What is the projected Compound Annual Growth Rate (CAGR) of the GaAs Laser?
The projected CAGR is approximately XX%.
2. Which companies are prominent players in the GaAs Laser?
Key companies in the market include Broadcom, WIN Semi, MACOM, Sony, GCS, II-VI Incorporated, OSRAM, Everbright Photonics, Kyotosemi, Changelight.
3. What are the main segments of the GaAs Laser?
The market segments include Application, Types.
4. Can you provide details about the market size?
The market size is estimated to be USD XXX million as of 2022.
5. What are some drivers contributing to market growth?
N/A
6. What are the notable trends driving market growth?
N/A
7. Are there any restraints impacting market growth?
N/A
8. Can you provide examples of recent developments in the market?
N/A
9. What pricing options are available for accessing the report?
Pricing options include single-user, multi-user, and enterprise licenses priced at USD 3350.00, USD 5025.00, and USD 6700.00 respectively.
10. Is the market size provided in terms of value or volume?
The market size is provided in terms of value, measured in million and volume, measured in K.
11. Are there any specific market keywords associated with the report?
Yes, the market keyword associated with the report is "GaAs Laser," which aids in identifying and referencing the specific market segment covered.
12. How do I determine which pricing option suits my needs best?
The pricing options vary based on user requirements and access needs. Individual users may opt for single-user licenses, while businesses requiring broader access may choose multi-user or enterprise licenses for cost-effective access to the report.
13. Are there any additional resources or data provided in the GaAs Laser report?
While the report offers comprehensive insights, it's advisable to review the specific contents or supplementary materials provided to ascertain if additional resources or data are available.
14. How can I stay updated on further developments or reports in the GaAs Laser?
To stay informed about further developments, trends, and reports in the GaAs Laser, consider subscribing to industry newsletters, following relevant companies and organizations, or regularly checking reputable industry news sources and publications.
Methodology
Step 1 - Identification of Relevant Samples Size from Population Database


Step 2 - Approaches for Defining Global Market Size (Value, Volume* & Price*)

Note*: In applicable scenarios
Step 3 - Data Sources
Primary Research
- Web Analytics
- Survey Reports
- Research Institute
- Latest Research Reports
- Opinion Leaders
Secondary Research
- Annual Reports
- White Paper
- Latest Press Release
- Industry Association
- Paid Database
- Investor Presentations

Step 4 - Data Triangulation
Involves using different sources of information in order to increase the validity of a study
These sources are likely to be stakeholders in a program - participants, other researchers, program staff, other community members, and so on.
Then we put all data in single framework & apply various statistical tools to find out the dynamic on the market.
During the analysis stage, feedback from the stakeholder groups would be compared to determine areas of agreement as well as areas of divergence
