

Key Insights
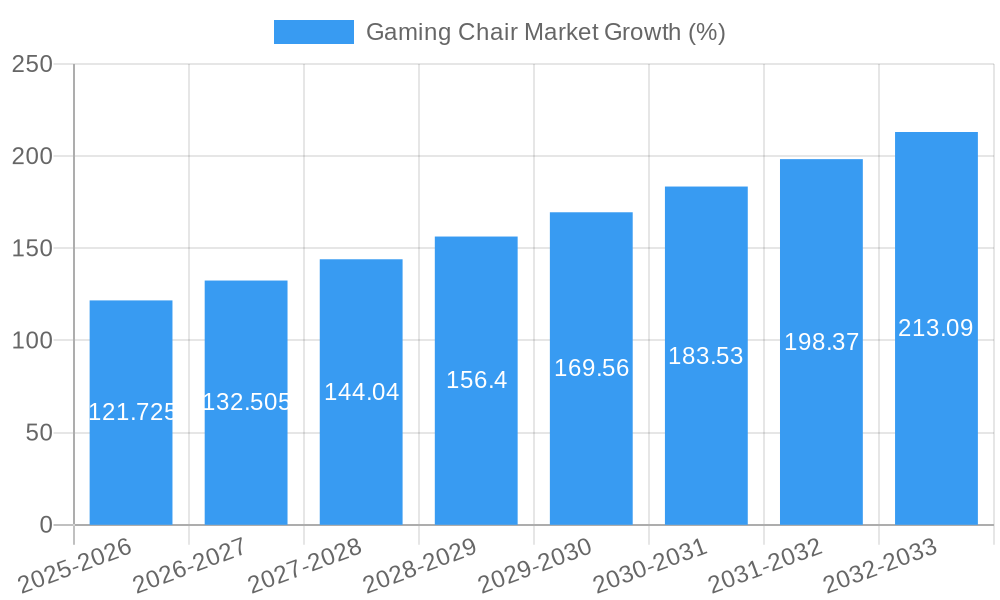
The global gaming chair market, valued at $1.45 billion in 2025, is projected to experience robust growth, exhibiting a compound annual growth rate (CAGR) of 8.15% from 2025 to 2033. This expansion is fueled by several key drivers. The rising popularity of esports and competitive gaming is a significant factor, driving demand for ergonomic and high-performance chairs designed to enhance player comfort and performance during extended gaming sessions. Furthermore, increasing disposable incomes, particularly among young adults, are enabling greater spending on gaming peripherals and accessories, including premium gaming chairs. Technological advancements, such as improved materials and designs offering enhanced lumbar support, adjustability, and aesthetic appeal, also contribute to market growth. The market is segmented by end-user (residential and commercial), distribution channel (home centers, specialty stores, online, and other channels), and chair type (PC gaming chairs, hybrid gaming chairs, platform gaming chairs, and other types). The online distribution channel is expected to witness significant growth due to the convenience and reach offered by e-commerce platforms. The residential segment holds the largest market share, reflecting the increasing number of gamers playing from home. Key players in the market, including GT Omega Racing, Corsair, X Rocker, DXRacer USA, Arozzi, AkRacing, Noblechairs, Vertagear, Ace Casual Furniture, and Secretlab, are focusing on product innovation and strategic partnerships to expand their market presence. Competitive pricing strategies and targeted marketing campaigns aimed at specific gamer demographics are also shaping market dynamics.
Geographic segmentation reveals that North America and Europe currently dominate the market, driven by strong gaming cultures and high consumer spending. However, the Asia-Pacific region is anticipated to experience the fastest growth, fueled by rising disposable incomes and the growing popularity of gaming in developing economies. Market restraints include price sensitivity in certain regions and the potential for market saturation in highly developed markets. However, ongoing innovation in chair design and features, coupled with the persistent growth of the gaming industry as a whole, suggest a sustained period of market expansion in the coming years. Future growth will likely be shaped by factors like the introduction of advanced features (e.g., integrated speakers, haptic feedback), increased customization options, and the expansion of the market into emerging regions.

Gaming Chair Market: A Comprehensive Report (2019-2033)
This in-depth report provides a comprehensive analysis of the Gaming Chair market, encompassing market dynamics, growth trends, regional performance, product landscape, and key players. The study period covers 2019-2033, with 2025 as the base and estimated year. The report offers valuable insights for industry professionals, investors, and stakeholders seeking to understand and capitalize on opportunities within this rapidly evolving market. Market values are presented in million units.
Gaming Chair Market Dynamics & Structure
This section analyzes the market's competitive landscape, technological advancements, regulatory influences, and market trends. The gaming chair market, valued at xx million units in 2024, is characterized by moderate concentration with several key players vying for market share. Technological innovation, particularly in ergonomics and materials, is a crucial driver. Regulatory compliance standards relating to safety and materials significantly influence market dynamics. The existence of substitute products, such as standard office chairs, presents a competitive challenge. The end-user demographics are heavily skewed towards young adults, particularly those actively engaged in esports or casual gaming.
- Market Concentration: Moderately concentrated, with top 10 players holding xx% market share in 2024.
- Technological Innovation: Focus on ergonomics, advanced materials (memory foam, breathable fabrics), and customizable features.
- Regulatory Frameworks: Safety and material standards vary across regions, impacting manufacturing and distribution.
- Competitive Product Substitutes: Standard office chairs and other seating solutions compete for consumer preference.
- End-User Demographics: Predominantly young adults (18-35 years), gamers, and esports enthusiasts.
- M&A Trends: xx M&A deals recorded between 2019 and 2024, primarily focused on expanding product portfolios and market reach.
Gaming Chair Market Growth Trends & Insights
The global gaming chair market exhibited robust growth during the historical period (2019-2024), driven by the increasing popularity of esports, the rise of casual gaming, and improvements in chair technology. The market is expected to continue this trajectory, with a projected CAGR of xx% from 2025 to 2033, reaching xx million units by 2033. This growth is fueled by several factors: higher disposable incomes among target demographics, increased awareness of ergonomic benefits, and the launch of innovative products featuring enhanced comfort and customization. The market penetration rate for gaming chairs in the gaming community is currently at xx%, with significant potential for further expansion. Technological disruptions, such as the incorporation of smart features and advanced materials, are further boosting market growth. Shifts in consumer behavior, including a growing preference for premium and personalized products, are also shaping market dynamics.
Dominant Regions, Countries, or Segments in Gaming Chair Market
The North American region currently dominates the global gaming chair market, accounting for approximately xx% of global sales in 2024, followed by Europe and Asia-Pacific. This dominance stems from high gaming penetration rates, strong consumer spending power, and well-established distribution channels. Within the segments, the Residential end-user segment dominates, holding a xx% market share. The Online distribution channel is the fastest-growing, driven by e-commerce expansion and ease of access. The PC gaming chair type holds the largest segment, capturing xx% of the market share.
- Key Drivers (North America): Strong gaming culture, high disposable income, robust e-commerce infrastructure.
- Key Drivers (Europe): Growing esports scene, rising interest in PC gaming, expanding online retail presence.
- Key Drivers (Asia-Pacific): Rapidly expanding gaming community, increasing affordability of gaming chairs, supportive government policies.
- Dominant End-User Segment: Residential (xx% market share in 2024).
- Dominant Distribution Channel: Online (xx% market share in 2024).
- Dominant Chair Type: PC Gaming Chair (xx% market share in 2024).
Gaming Chair Market Product Landscape
Gaming chairs are evolving beyond basic functionality. Innovations focus on enhanced ergonomics, adjustable features (height, lumbar support, armrests), advanced materials for superior comfort and durability (memory foam, breathable fabrics), and aesthetic designs reflecting gaming aesthetics. Unique selling propositions include features like integrated speakers, vibration feedback, and customizable lighting. Technological advancements encompass smart chair technologies offering personalized comfort settings and health monitoring.
Key Drivers, Barriers & Challenges in Gaming Chair Market
Key Drivers:
- Rising popularity of esports and gaming.
- Increasing disposable incomes among target demographics.
- Growing awareness of ergonomic benefits and health concerns related to prolonged sitting.
- Technological advancements leading to improved comfort and functionality.
Key Challenges:
- Intense competition from established and emerging players.
- Price sensitivity among budget-conscious consumers.
- Supply chain disruptions and rising raw material costs impacting profitability.
- Regulatory hurdles regarding safety and environmental standards.
Emerging Opportunities in Gaming Chair Market
Untapped markets in developing economies present significant growth opportunities. The integration of smart features (health monitoring, personalized settings) and sustainable materials offer unique selling propositions. Customized gaming chairs tailored to specific gaming genres or individual preferences represent a growing trend. Expansion into niche markets, such as professional gaming teams and gaming cafes, presents further opportunities.
Growth Accelerators in the Gaming Chair Market Industry
Technological breakthroughs in ergonomics, materials science, and smart technology will continue to fuel market expansion. Strategic partnerships between gaming chair manufacturers and esports organizations will drive brand awareness and market penetration. Expansion into new geographical markets and strategic investments in marketing and distribution channels will accelerate long-term growth.
Key Players Shaping the Gaming Chair Market Market
- GT Omega Racing
- Corsair
- X Rocker
- DxRacer USA
- Arozzi
- AkRacing
- Noblechairs
- Vertagear
- Ace Casual Furniture
- Secretlab
Notable Milestones in Gaming Chair Market Sector
- June 2022: CORSAIR launched the TC200 Fabric and Leatherette Gaming Chairs, expanding its gaming furniture line.
- August 2022: Cybeart announced the world's first Lord of the Rings Chair, leveraging a partnership with Warner Bros.
In-Depth Gaming Chair Market Market Outlook
The future of the gaming chair market is bright, with continued growth driven by technological innovation, expanding gaming communities, and evolving consumer preferences. Strategic partnerships, expansion into new markets, and a focus on sustainability will be crucial for long-term success. The market is poised for significant expansion, with opportunities for both established and emerging players to capitalize on the increasing demand for high-quality, ergonomic, and aesthetically pleasing gaming chairs.
Gaming Chair Market Segmentation
-
1. Type
- 1.1. PC Gaming Chair
- 1.2. Hybrid Gaming Chair
- 1.3. Platform Gaming Chair
-
2. End User
- 2.1. Residential
- 2.2. Commercial
-
3. Distribution Channel
- 3.1. Home Centers
- 3.2. Specialty Stores
- 3.3. Online
Gaming Chair Market Segmentation By Geography
-
1. North America
- 1.1. United States
- 1.2. Canada
- 1.3. Rest of North America
-
2. Europe
- 2.1. United Kingdom
- 2.2. Germany
- 2.3. Rest of Europe
-
3. Asia Pacific
- 3.1. India
- 3.2. Japan
- 3.3. Rest of Asia Pacific
-
4. South America
- 4.1. Brazil
- 4.2. Peru
- 4.3. Rest of South America
-
5. Middle East and Africa
- 5.1. Saudi Arabia
- 5.2. United Arab Emirates
- 5.3. Rest of Middle East and Africa

Gaming Chair Market REPORT HIGHLIGHTS
| Aspects | Details |
|---|---|
| Study Period | 2019-2033 |
| Base Year | 2024 |
| Estimated Year | 2025 |
| Forecast Period | 2025-2033 |
| Historical Period | 2019-2024 |
| Growth Rate | CAGR of 8.15% from 2019-2033 |
| Segmentation |
|
Table of Contents
- 1. Introduction
- 1.1. Research Scope
- 1.2. Market Segmentation
- 1.3. Research Methodology
- 1.4. Definitions and Assumptions
- 2. Executive Summary
- 2.1. Introduction
- 3. Market Dynamics
- 3.1. Introduction
- 3.2. Market Drivers
- 3.2.1. Technological Advancement booming the industry; Focus on Ergonomics and Comfort
- 3.3. Market Restrains
- 3.3.1. High cost; Limited Target Audience
- 3.4. Market Trends
- 3.4.1. Expanding Video Gaming Industry is Driving the Market
- 4. Market Factor Analysis
- 4.1. Porters Five Forces
- 4.2. Supply/Value Chain
- 4.3. PESTEL analysis
- 4.4. Market Entropy
- 4.5. Patent/Trademark Analysis
- 5. Global Gaming Chair Market Analysis, Insights and Forecast, 2019-2031
- 5.1. Market Analysis, Insights and Forecast - by Type
- 5.1.1. PC Gaming Chair
- 5.1.2. Hybrid Gaming Chair
- 5.1.3. Platform Gaming Chair
- 5.2. Market Analysis, Insights and Forecast - by End User
- 5.2.1. Residential
- 5.2.2. Commercial
- 5.3. Market Analysis, Insights and Forecast - by Distribution Channel
- 5.3.1. Home Centers
- 5.3.2. Specialty Stores
- 5.3.3. Online
- 5.4. Market Analysis, Insights and Forecast - by Region
- 5.4.1. North America
- 5.4.2. Europe
- 5.4.3. Asia Pacific
- 5.4.4. South America
- 5.4.5. Middle East and Africa
- 5.1. Market Analysis, Insights and Forecast - by Type
- 6. North America Gaming Chair Market Analysis, Insights and Forecast, 2019-2031
- 6.1. Market Analysis, Insights and Forecast - by Type
- 6.1.1. PC Gaming Chair
- 6.1.2. Hybrid Gaming Chair
- 6.1.3. Platform Gaming Chair
- 6.2. Market Analysis, Insights and Forecast - by End User
- 6.2.1. Residential
- 6.2.2. Commercial
- 6.3. Market Analysis, Insights and Forecast - by Distribution Channel
- 6.3.1. Home Centers
- 6.3.2. Specialty Stores
- 6.3.3. Online
- 6.1. Market Analysis, Insights and Forecast - by Type
- 7. Europe Gaming Chair Market Analysis, Insights and Forecast, 2019-2031
- 7.1. Market Analysis, Insights and Forecast - by Type
- 7.1.1. PC Gaming Chair
- 7.1.2. Hybrid Gaming Chair
- 7.1.3. Platform Gaming Chair
- 7.2. Market Analysis, Insights and Forecast - by End User
- 7.2.1. Residential
- 7.2.2. Commercial
- 7.3. Market Analysis, Insights and Forecast - by Distribution Channel
- 7.3.1. Home Centers
- 7.3.2. Specialty Stores
- 7.3.3. Online
- 7.1. Market Analysis, Insights and Forecast - by Type
- 8. Asia Pacific Gaming Chair Market Analysis, Insights and Forecast, 2019-2031
- 8.1. Market Analysis, Insights and Forecast - by Type
- 8.1.1. PC Gaming Chair
- 8.1.2. Hybrid Gaming Chair
- 8.1.3. Platform Gaming Chair
- 8.2. Market Analysis, Insights and Forecast - by End User
- 8.2.1. Residential
- 8.2.2. Commercial
- 8.3. Market Analysis, Insights and Forecast - by Distribution Channel
- 8.3.1. Home Centers
- 8.3.2. Specialty Stores
- 8.3.3. Online
- 8.1. Market Analysis, Insights and Forecast - by Type
- 9. South America Gaming Chair Market Analysis, Insights and Forecast, 2019-2031
- 9.1. Market Analysis, Insights and Forecast - by Type
- 9.1.1. PC Gaming Chair
- 9.1.2. Hybrid Gaming Chair
- 9.1.3. Platform Gaming Chair
- 9.2. Market Analysis, Insights and Forecast - by End User
- 9.2.1. Residential
- 9.2.2. Commercial
- 9.3. Market Analysis, Insights and Forecast - by Distribution Channel
- 9.3.1. Home Centers
- 9.3.2. Specialty Stores
- 9.3.3. Online
- 9.1. Market Analysis, Insights and Forecast - by Type
- 10. Middle East and Africa Gaming Chair Market Analysis, Insights and Forecast, 2019-2031
- 10.1. Market Analysis, Insights and Forecast - by Type
- 10.1.1. PC Gaming Chair
- 10.1.2. Hybrid Gaming Chair
- 10.1.3. Platform Gaming Chair
- 10.2. Market Analysis, Insights and Forecast - by End User
- 10.2.1. Residential
- 10.2.2. Commercial
- 10.3. Market Analysis, Insights and Forecast - by Distribution Channel
- 10.3.1. Home Centers
- 10.3.2. Specialty Stores
- 10.3.3. Online
- 10.1. Market Analysis, Insights and Forecast - by Type
- 11. North America Gaming Chair Market Analysis, Insights and Forecast, 2019-2031
- 11.1. Market Analysis, Insights and Forecast - By Country/Sub-region
- 11.1.1 United States
- 11.1.2 Canada
- 11.1.3 Mexico
- 12. Europe Gaming Chair Market Analysis, Insights and Forecast, 2019-2031
- 12.1. Market Analysis, Insights and Forecast - By Country/Sub-region
- 12.1.1 Germany
- 12.1.2 United Kingdom
- 12.1.3 France
- 12.1.4 Spain
- 12.1.5 Italy
- 12.1.6 Spain
- 12.1.7 Belgium
- 12.1.8 Netherland
- 12.1.9 Nordics
- 12.1.10 Rest of Europe
- 13. Asia Pacific Gaming Chair Market Analysis, Insights and Forecast, 2019-2031
- 13.1. Market Analysis, Insights and Forecast - By Country/Sub-region
- 13.1.1 China
- 13.1.2 Japan
- 13.1.3 India
- 13.1.4 South Korea
- 13.1.5 Southeast Asia
- 13.1.6 Australia
- 13.1.7 Indonesia
- 13.1.8 Phillipes
- 13.1.9 Singapore
- 13.1.10 Thailandc
- 13.1.11 Rest of Asia Pacific
- 14. South America Gaming Chair Market Analysis, Insights and Forecast, 2019-2031
- 14.1. Market Analysis, Insights and Forecast - By Country/Sub-region
- 14.1.1 Brazil
- 14.1.2 Argentina
- 14.1.3 Peru
- 14.1.4 Chile
- 14.1.5 Colombia
- 14.1.6 Ecuador
- 14.1.7 Venezuela
- 14.1.8 Rest of South America
- 15. North America Gaming Chair Market Analysis, Insights and Forecast, 2019-2031
- 15.1. Market Analysis, Insights and Forecast - By Country/Sub-region
- 15.1.1 United States
- 15.1.2 Canada
- 15.1.3 Mexico
- 16. MEA Gaming Chair Market Analysis, Insights and Forecast, 2019-2031
- 16.1. Market Analysis, Insights and Forecast - By Country/Sub-region
- 16.1.1 United Arab Emirates
- 16.1.2 Saudi Arabia
- 16.1.3 South Africa
- 16.1.4 Rest of Middle East and Africa
- 17. Competitive Analysis
- 17.1. Global Market Share Analysis 2024
- 17.2. Company Profiles
- 17.2.1 GT Omega Racing
- 17.2.1.1. Overview
- 17.2.1.2. Products
- 17.2.1.3. SWOT Analysis
- 17.2.1.4. Recent Developments
- 17.2.1.5. Financials (Based on Availability)
- 17.2.2 Corsair
- 17.2.2.1. Overview
- 17.2.2.2. Products
- 17.2.2.3. SWOT Analysis
- 17.2.2.4. Recent Developments
- 17.2.2.5. Financials (Based on Availability)
- 17.2.3 X Rocker
- 17.2.3.1. Overview
- 17.2.3.2. Products
- 17.2.3.3. SWOT Analysis
- 17.2.3.4. Recent Developments
- 17.2.3.5. Financials (Based on Availability)
- 17.2.4 DxRacer USA
- 17.2.4.1. Overview
- 17.2.4.2. Products
- 17.2.4.3. SWOT Analysis
- 17.2.4.4. Recent Developments
- 17.2.4.5. Financials (Based on Availability)
- 17.2.5 Arozzi
- 17.2.5.1. Overview
- 17.2.5.2. Products
- 17.2.5.3. SWOT Analysis
- 17.2.5.4. Recent Developments
- 17.2.5.5. Financials (Based on Availability)
- 17.2.6 AkRacing
- 17.2.6.1. Overview
- 17.2.6.2. Products
- 17.2.6.3. SWOT Analysis
- 17.2.6.4. Recent Developments
- 17.2.6.5. Financials (Based on Availability)
- 17.2.7 Noblechairs
- 17.2.7.1. Overview
- 17.2.7.2. Products
- 17.2.7.3. SWOT Analysis
- 17.2.7.4. Recent Developments
- 17.2.7.5. Financials (Based on Availability)
- 17.2.8 Vertagear
- 17.2.8.1. Overview
- 17.2.8.2. Products
- 17.2.8.3. SWOT Analysis
- 17.2.8.4. Recent Developments
- 17.2.8.5. Financials (Based on Availability)
- 17.2.9 Ace Casual Furniture
- 17.2.9.1. Overview
- 17.2.9.2. Products
- 17.2.9.3. SWOT Analysis
- 17.2.9.4. Recent Developments
- 17.2.9.5. Financials (Based on Availability)
- 17.2.10 Secretlab
- 17.2.10.1. Overview
- 17.2.10.2. Products
- 17.2.10.3. SWOT Analysis
- 17.2.10.4. Recent Developments
- 17.2.10.5. Financials (Based on Availability)
- 17.2.1 GT Omega Racing
List of Figures
- Figure 1: Global Gaming Chair Market Revenue Breakdown (Million, %) by Region 2024 & 2032
- Figure 2: Global Gaming Chair Market Volume Breakdown (K Units, %) by Region 2024 & 2032
- Figure 3: North America Gaming Chair Market Revenue (Million), by Country 2024 & 2032
- Figure 4: North America Gaming Chair Market Volume (K Units), by Country 2024 & 2032
- Figure 5: North America Gaming Chair Market Revenue Share (%), by Country 2024 & 2032
- Figure 6: North America Gaming Chair Market Volume Share (%), by Country 2024 & 2032
- Figure 7: Europe Gaming Chair Market Revenue (Million), by Country 2024 & 2032
- Figure 8: Europe Gaming Chair Market Volume (K Units), by Country 2024 & 2032
- Figure 9: Europe Gaming Chair Market Revenue Share (%), by Country 2024 & 2032
- Figure 10: Europe Gaming Chair Market Volume Share (%), by Country 2024 & 2032
- Figure 11: Asia Pacific Gaming Chair Market Revenue (Million), by Country 2024 & 2032
- Figure 12: Asia Pacific Gaming Chair Market Volume (K Units), by Country 2024 & 2032
- Figure 13: Asia Pacific Gaming Chair Market Revenue Share (%), by Country 2024 & 2032
- Figure 14: Asia Pacific Gaming Chair Market Volume Share (%), by Country 2024 & 2032
- Figure 15: South America Gaming Chair Market Revenue (Million), by Country 2024 & 2032
- Figure 16: South America Gaming Chair Market Volume (K Units), by Country 2024 & 2032
- Figure 17: South America Gaming Chair Market Revenue Share (%), by Country 2024 & 2032
- Figure 18: South America Gaming Chair Market Volume Share (%), by Country 2024 & 2032
- Figure 19: North America Gaming Chair Market Revenue (Million), by Country 2024 & 2032
- Figure 20: North America Gaming Chair Market Volume (K Units), by Country 2024 & 2032
- Figure 21: North America Gaming Chair Market Revenue Share (%), by Country 2024 & 2032
- Figure 22: North America Gaming Chair Market Volume Share (%), by Country 2024 & 2032
- Figure 23: MEA Gaming Chair Market Revenue (Million), by Country 2024 & 2032
- Figure 24: MEA Gaming Chair Market Volume (K Units), by Country 2024 & 2032
- Figure 25: MEA Gaming Chair Market Revenue Share (%), by Country 2024 & 2032
- Figure 26: MEA Gaming Chair Market Volume Share (%), by Country 2024 & 2032
- Figure 27: North America Gaming Chair Market Revenue (Million), by Type 2024 & 2032
- Figure 28: North America Gaming Chair Market Volume (K Units), by Type 2024 & 2032
- Figure 29: North America Gaming Chair Market Revenue Share (%), by Type 2024 & 2032
- Figure 30: North America Gaming Chair Market Volume Share (%), by Type 2024 & 2032
- Figure 31: North America Gaming Chair Market Revenue (Million), by End User 2024 & 2032
- Figure 32: North America Gaming Chair Market Volume (K Units), by End User 2024 & 2032
- Figure 33: North America Gaming Chair Market Revenue Share (%), by End User 2024 & 2032
- Figure 34: North America Gaming Chair Market Volume Share (%), by End User 2024 & 2032
- Figure 35: North America Gaming Chair Market Revenue (Million), by Distribution Channel 2024 & 2032
- Figure 36: North America Gaming Chair Market Volume (K Units), by Distribution Channel 2024 & 2032
- Figure 37: North America Gaming Chair Market Revenue Share (%), by Distribution Channel 2024 & 2032
- Figure 38: North America Gaming Chair Market Volume Share (%), by Distribution Channel 2024 & 2032
- Figure 39: North America Gaming Chair Market Revenue (Million), by Country 2024 & 2032
- Figure 40: North America Gaming Chair Market Volume (K Units), by Country 2024 & 2032
- Figure 41: North America Gaming Chair Market Revenue Share (%), by Country 2024 & 2032
- Figure 42: North America Gaming Chair Market Volume Share (%), by Country 2024 & 2032
- Figure 43: Europe Gaming Chair Market Revenue (Million), by Type 2024 & 2032
- Figure 44: Europe Gaming Chair Market Volume (K Units), by Type 2024 & 2032
- Figure 45: Europe Gaming Chair Market Revenue Share (%), by Type 2024 & 2032
- Figure 46: Europe Gaming Chair Market Volume Share (%), by Type 2024 & 2032
- Figure 47: Europe Gaming Chair Market Revenue (Million), by End User 2024 & 2032
- Figure 48: Europe Gaming Chair Market Volume (K Units), by End User 2024 & 2032
- Figure 49: Europe Gaming Chair Market Revenue Share (%), by End User 2024 & 2032
- Figure 50: Europe Gaming Chair Market Volume Share (%), by End User 2024 & 2032
- Figure 51: Europe Gaming Chair Market Revenue (Million), by Distribution Channel 2024 & 2032
- Figure 52: Europe Gaming Chair Market Volume (K Units), by Distribution Channel 2024 & 2032
- Figure 53: Europe Gaming Chair Market Revenue Share (%), by Distribution Channel 2024 & 2032
- Figure 54: Europe Gaming Chair Market Volume Share (%), by Distribution Channel 2024 & 2032
- Figure 55: Europe Gaming Chair Market Revenue (Million), by Country 2024 & 2032
- Figure 56: Europe Gaming Chair Market Volume (K Units), by Country 2024 & 2032
- Figure 57: Europe Gaming Chair Market Revenue Share (%), by Country 2024 & 2032
- Figure 58: Europe Gaming Chair Market Volume Share (%), by Country 2024 & 2032
- Figure 59: Asia Pacific Gaming Chair Market Revenue (Million), by Type 2024 & 2032
- Figure 60: Asia Pacific Gaming Chair Market Volume (K Units), by Type 2024 & 2032
- Figure 61: Asia Pacific Gaming Chair Market Revenue Share (%), by Type 2024 & 2032
- Figure 62: Asia Pacific Gaming Chair Market Volume Share (%), by Type 2024 & 2032
- Figure 63: Asia Pacific Gaming Chair Market Revenue (Million), by End User 2024 & 2032
- Figure 64: Asia Pacific Gaming Chair Market Volume (K Units), by End User 2024 & 2032
- Figure 65: Asia Pacific Gaming Chair Market Revenue Share (%), by End User 2024 & 2032
- Figure 66: Asia Pacific Gaming Chair Market Volume Share (%), by End User 2024 & 2032
- Figure 67: Asia Pacific Gaming Chair Market Revenue (Million), by Distribution Channel 2024 & 2032
- Figure 68: Asia Pacific Gaming Chair Market Volume (K Units), by Distribution Channel 2024 & 2032
- Figure 69: Asia Pacific Gaming Chair Market Revenue Share (%), by Distribution Channel 2024 & 2032
- Figure 70: Asia Pacific Gaming Chair Market Volume Share (%), by Distribution Channel 2024 & 2032
- Figure 71: Asia Pacific Gaming Chair Market Revenue (Million), by Country 2024 & 2032
- Figure 72: Asia Pacific Gaming Chair Market Volume (K Units), by Country 2024 & 2032
- Figure 73: Asia Pacific Gaming Chair Market Revenue Share (%), by Country 2024 & 2032
- Figure 74: Asia Pacific Gaming Chair Market Volume Share (%), by Country 2024 & 2032
- Figure 75: South America Gaming Chair Market Revenue (Million), by Type 2024 & 2032
- Figure 76: South America Gaming Chair Market Volume (K Units), by Type 2024 & 2032
- Figure 77: South America Gaming Chair Market Revenue Share (%), by Type 2024 & 2032
- Figure 78: South America Gaming Chair Market Volume Share (%), by Type 2024 & 2032
- Figure 79: South America Gaming Chair Market Revenue (Million), by End User 2024 & 2032
- Figure 80: South America Gaming Chair Market Volume (K Units), by End User 2024 & 2032
- Figure 81: South America Gaming Chair Market Revenue Share (%), by End User 2024 & 2032
- Figure 82: South America Gaming Chair Market Volume Share (%), by End User 2024 & 2032
- Figure 83: South America Gaming Chair Market Revenue (Million), by Distribution Channel 2024 & 2032
- Figure 84: South America Gaming Chair Market Volume (K Units), by Distribution Channel 2024 & 2032
- Figure 85: South America Gaming Chair Market Revenue Share (%), by Distribution Channel 2024 & 2032
- Figure 86: South America Gaming Chair Market Volume Share (%), by Distribution Channel 2024 & 2032
- Figure 87: South America Gaming Chair Market Revenue (Million), by Country 2024 & 2032
- Figure 88: South America Gaming Chair Market Volume (K Units), by Country 2024 & 2032
- Figure 89: South America Gaming Chair Market Revenue Share (%), by Country 2024 & 2032
- Figure 90: South America Gaming Chair Market Volume Share (%), by Country 2024 & 2032
- Figure 91: Middle East and Africa Gaming Chair Market Revenue (Million), by Type 2024 & 2032
- Figure 92: Middle East and Africa Gaming Chair Market Volume (K Units), by Type 2024 & 2032
- Figure 93: Middle East and Africa Gaming Chair Market Revenue Share (%), by Type 2024 & 2032
- Figure 94: Middle East and Africa Gaming Chair Market Volume Share (%), by Type 2024 & 2032
- Figure 95: Middle East and Africa Gaming Chair Market Revenue (Million), by End User 2024 & 2032
- Figure 96: Middle East and Africa Gaming Chair Market Volume (K Units), by End User 2024 & 2032
- Figure 97: Middle East and Africa Gaming Chair Market Revenue Share (%), by End User 2024 & 2032
- Figure 98: Middle East and Africa Gaming Chair Market Volume Share (%), by End User 2024 & 2032
- Figure 99: Middle East and Africa Gaming Chair Market Revenue (Million), by Distribution Channel 2024 & 2032
- Figure 100: Middle East and Africa Gaming Chair Market Volume (K Units), by Distribution Channel 2024 & 2032
- Figure 101: Middle East and Africa Gaming Chair Market Revenue Share (%), by Distribution Channel 2024 & 2032
- Figure 102: Middle East and Africa Gaming Chair Market Volume Share (%), by Distribution Channel 2024 & 2032
- Figure 103: Middle East and Africa Gaming Chair Market Revenue (Million), by Country 2024 & 2032
- Figure 104: Middle East and Africa Gaming Chair Market Volume (K Units), by Country 2024 & 2032
- Figure 105: Middle East and Africa Gaming Chair Market Revenue Share (%), by Country 2024 & 2032
- Figure 106: Middle East and Africa Gaming Chair Market Volume Share (%), by Country 2024 & 2032
List of Tables
- Table 1: Global Gaming Chair Market Revenue Million Forecast, by Region 2019 & 2032
- Table 2: Global Gaming Chair Market Volume K Units Forecast, by Region 2019 & 2032
- Table 3: Global Gaming Chair Market Revenue Million Forecast, by Type 2019 & 2032
- Table 4: Global Gaming Chair Market Volume K Units Forecast, by Type 2019 & 2032
- Table 5: Global Gaming Chair Market Revenue Million Forecast, by End User 2019 & 2032
- Table 6: Global Gaming Chair Market Volume K Units Forecast, by End User 2019 & 2032
- Table 7: Global Gaming Chair Market Revenue Million Forecast, by Distribution Channel 2019 & 2032
- Table 8: Global Gaming Chair Market Volume K Units Forecast, by Distribution Channel 2019 & 2032
- Table 9: Global Gaming Chair Market Revenue Million Forecast, by Region 2019 & 2032
- Table 10: Global Gaming Chair Market Volume K Units Forecast, by Region 2019 & 2032
- Table 11: Global Gaming Chair Market Revenue Million Forecast, by Country 2019 & 2032
- Table 12: Global Gaming Chair Market Volume K Units Forecast, by Country 2019 & 2032
- Table 13: United States Gaming Chair Market Revenue (Million) Forecast, by Application 2019 & 2032
- Table 14: United States Gaming Chair Market Volume (K Units) Forecast, by Application 2019 & 2032
- Table 15: Canada Gaming Chair Market Revenue (Million) Forecast, by Application 2019 & 2032
- Table 16: Canada Gaming Chair Market Volume (K Units) Forecast, by Application 2019 & 2032
- Table 17: Mexico Gaming Chair Market Revenue (Million) Forecast, by Application 2019 & 2032
- Table 18: Mexico Gaming Chair Market Volume (K Units) Forecast, by Application 2019 & 2032
- Table 19: Global Gaming Chair Market Revenue Million Forecast, by Country 2019 & 2032
- Table 20: Global Gaming Chair Market Volume K Units Forecast, by Country 2019 & 2032
- Table 21: Germany Gaming Chair Market Revenue (Million) Forecast, by Application 2019 & 2032
- Table 22: Germany Gaming Chair Market Volume (K Units) Forecast, by Application 2019 & 2032
- Table 23: United Kingdom Gaming Chair Market Revenue (Million) Forecast, by Application 2019 & 2032
- Table 24: United Kingdom Gaming Chair Market Volume (K Units) Forecast, by Application 2019 & 2032
- Table 25: France Gaming Chair Market Revenue (Million) Forecast, by Application 2019 & 2032
- Table 26: France Gaming Chair Market Volume (K Units) Forecast, by Application 2019 & 2032
- Table 27: Spain Gaming Chair Market Revenue (Million) Forecast, by Application 2019 & 2032
- Table 28: Spain Gaming Chair Market Volume (K Units) Forecast, by Application 2019 & 2032
- Table 29: Italy Gaming Chair Market Revenue (Million) Forecast, by Application 2019 & 2032
- Table 30: Italy Gaming Chair Market Volume (K Units) Forecast, by Application 2019 & 2032
- Table 31: Spain Gaming Chair Market Revenue (Million) Forecast, by Application 2019 & 2032
- Table 32: Spain Gaming Chair Market Volume (K Units) Forecast, by Application 2019 & 2032
- Table 33: Belgium Gaming Chair Market Revenue (Million) Forecast, by Application 2019 & 2032
- Table 34: Belgium Gaming Chair Market Volume (K Units) Forecast, by Application 2019 & 2032
- Table 35: Netherland Gaming Chair Market Revenue (Million) Forecast, by Application 2019 & 2032
- Table 36: Netherland Gaming Chair Market Volume (K Units) Forecast, by Application 2019 & 2032
- Table 37: Nordics Gaming Chair Market Revenue (Million) Forecast, by Application 2019 & 2032
- Table 38: Nordics Gaming Chair Market Volume (K Units) Forecast, by Application 2019 & 2032
- Table 39: Rest of Europe Gaming Chair Market Revenue (Million) Forecast, by Application 2019 & 2032
- Table 40: Rest of Europe Gaming Chair Market Volume (K Units) Forecast, by Application 2019 & 2032
- Table 41: Global Gaming Chair Market Revenue Million Forecast, by Country 2019 & 2032
- Table 42: Global Gaming Chair Market Volume K Units Forecast, by Country 2019 & 2032
- Table 43: China Gaming Chair Market Revenue (Million) Forecast, by Application 2019 & 2032
- Table 44: China Gaming Chair Market Volume (K Units) Forecast, by Application 2019 & 2032
- Table 45: Japan Gaming Chair Market Revenue (Million) Forecast, by Application 2019 & 2032
- Table 46: Japan Gaming Chair Market Volume (K Units) Forecast, by Application 2019 & 2032
- Table 47: India Gaming Chair Market Revenue (Million) Forecast, by Application 2019 & 2032
- Table 48: India Gaming Chair Market Volume (K Units) Forecast, by Application 2019 & 2032
- Table 49: South Korea Gaming Chair Market Revenue (Million) Forecast, by Application 2019 & 2032
- Table 50: South Korea Gaming Chair Market Volume (K Units) Forecast, by Application 2019 & 2032
- Table 51: Southeast Asia Gaming Chair Market Revenue (Million) Forecast, by Application 2019 & 2032
- Table 52: Southeast Asia Gaming Chair Market Volume (K Units) Forecast, by Application 2019 & 2032
- Table 53: Australia Gaming Chair Market Revenue (Million) Forecast, by Application 2019 & 2032
- Table 54: Australia Gaming Chair Market Volume (K Units) Forecast, by Application 2019 & 2032
- Table 55: Indonesia Gaming Chair Market Revenue (Million) Forecast, by Application 2019 & 2032
- Table 56: Indonesia Gaming Chair Market Volume (K Units) Forecast, by Application 2019 & 2032
- Table 57: Phillipes Gaming Chair Market Revenue (Million) Forecast, by Application 2019 & 2032
- Table 58: Phillipes Gaming Chair Market Volume (K Units) Forecast, by Application 2019 & 2032
- Table 59: Singapore Gaming Chair Market Revenue (Million) Forecast, by Application 2019 & 2032
- Table 60: Singapore Gaming Chair Market Volume (K Units) Forecast, by Application 2019 & 2032
- Table 61: Thailandc Gaming Chair Market Revenue (Million) Forecast, by Application 2019 & 2032
- Table 62: Thailandc Gaming Chair Market Volume (K Units) Forecast, by Application 2019 & 2032
- Table 63: Rest of Asia Pacific Gaming Chair Market Revenue (Million) Forecast, by Application 2019 & 2032
- Table 64: Rest of Asia Pacific Gaming Chair Market Volume (K Units) Forecast, by Application 2019 & 2032
- Table 65: Global Gaming Chair Market Revenue Million Forecast, by Country 2019 & 2032
- Table 66: Global Gaming Chair Market Volume K Units Forecast, by Country 2019 & 2032
- Table 67: Brazil Gaming Chair Market Revenue (Million) Forecast, by Application 2019 & 2032
- Table 68: Brazil Gaming Chair Market Volume (K Units) Forecast, by Application 2019 & 2032
- Table 69: Argentina Gaming Chair Market Revenue (Million) Forecast, by Application 2019 & 2032
- Table 70: Argentina Gaming Chair Market Volume (K Units) Forecast, by Application 2019 & 2032
- Table 71: Peru Gaming Chair Market Revenue (Million) Forecast, by Application 2019 & 2032
- Table 72: Peru Gaming Chair Market Volume (K Units) Forecast, by Application 2019 & 2032
- Table 73: Chile Gaming Chair Market Revenue (Million) Forecast, by Application 2019 & 2032
- Table 74: Chile Gaming Chair Market Volume (K Units) Forecast, by Application 2019 & 2032
- Table 75: Colombia Gaming Chair Market Revenue (Million) Forecast, by Application 2019 & 2032
- Table 76: Colombia Gaming Chair Market Volume (K Units) Forecast, by Application 2019 & 2032
- Table 77: Ecuador Gaming Chair Market Revenue (Million) Forecast, by Application 2019 & 2032
- Table 78: Ecuador Gaming Chair Market Volume (K Units) Forecast, by Application 2019 & 2032
- Table 79: Venezuela Gaming Chair Market Revenue (Million) Forecast, by Application 2019 & 2032
- Table 80: Venezuela Gaming Chair Market Volume (K Units) Forecast, by Application 2019 & 2032
- Table 81: Rest of South America Gaming Chair Market Revenue (Million) Forecast, by Application 2019 & 2032
- Table 82: Rest of South America Gaming Chair Market Volume (K Units) Forecast, by Application 2019 & 2032
- Table 83: Global Gaming Chair Market Revenue Million Forecast, by Country 2019 & 2032
- Table 84: Global Gaming Chair Market Volume K Units Forecast, by Country 2019 & 2032
- Table 85: United States Gaming Chair Market Revenue (Million) Forecast, by Application 2019 & 2032
- Table 86: United States Gaming Chair Market Volume (K Units) Forecast, by Application 2019 & 2032
- Table 87: Canada Gaming Chair Market Revenue (Million) Forecast, by Application 2019 & 2032
- Table 88: Canada Gaming Chair Market Volume (K Units) Forecast, by Application 2019 & 2032
- Table 89: Mexico Gaming Chair Market Revenue (Million) Forecast, by Application 2019 & 2032
- Table 90: Mexico Gaming Chair Market Volume (K Units) Forecast, by Application 2019 & 2032
- Table 91: Global Gaming Chair Market Revenue Million Forecast, by Country 2019 & 2032
- Table 92: Global Gaming Chair Market Volume K Units Forecast, by Country 2019 & 2032
- Table 93: United Arab Emirates Gaming Chair Market Revenue (Million) Forecast, by Application 2019 & 2032
- Table 94: United Arab Emirates Gaming Chair Market Volume (K Units) Forecast, by Application 2019 & 2032
- Table 95: Saudi Arabia Gaming Chair Market Revenue (Million) Forecast, by Application 2019 & 2032
- Table 96: Saudi Arabia Gaming Chair Market Volume (K Units) Forecast, by Application 2019 & 2032
- Table 97: South Africa Gaming Chair Market Revenue (Million) Forecast, by Application 2019 & 2032
- Table 98: South Africa Gaming Chair Market Volume (K Units) Forecast, by Application 2019 & 2032
- Table 99: Rest of Middle East and Africa Gaming Chair Market Revenue (Million) Forecast, by Application 2019 & 2032
- Table 100: Rest of Middle East and Africa Gaming Chair Market Volume (K Units) Forecast, by Application 2019 & 2032
- Table 101: Global Gaming Chair Market Revenue Million Forecast, by Type 2019 & 2032
- Table 102: Global Gaming Chair Market Volume K Units Forecast, by Type 2019 & 2032
- Table 103: Global Gaming Chair Market Revenue Million Forecast, by End User 2019 & 2032
- Table 104: Global Gaming Chair Market Volume K Units Forecast, by End User 2019 & 2032
- Table 105: Global Gaming Chair Market Revenue Million Forecast, by Distribution Channel 2019 & 2032
- Table 106: Global Gaming Chair Market Volume K Units Forecast, by Distribution Channel 2019 & 2032
- Table 107: Global Gaming Chair Market Revenue Million Forecast, by Country 2019 & 2032
- Table 108: Global Gaming Chair Market Volume K Units Forecast, by Country 2019 & 2032
- Table 109: United States Gaming Chair Market Revenue (Million) Forecast, by Application 2019 & 2032
- Table 110: United States Gaming Chair Market Volume (K Units) Forecast, by Application 2019 & 2032
- Table 111: Canada Gaming Chair Market Revenue (Million) Forecast, by Application 2019 & 2032
- Table 112: Canada Gaming Chair Market Volume (K Units) Forecast, by Application 2019 & 2032
- Table 113: Rest of North America Gaming Chair Market Revenue (Million) Forecast, by Application 2019 & 2032
- Table 114: Rest of North America Gaming Chair Market Volume (K Units) Forecast, by Application 2019 & 2032
- Table 115: Global Gaming Chair Market Revenue Million Forecast, by Type 2019 & 2032
- Table 116: Global Gaming Chair Market Volume K Units Forecast, by Type 2019 & 2032
- Table 117: Global Gaming Chair Market Revenue Million Forecast, by End User 2019 & 2032
- Table 118: Global Gaming Chair Market Volume K Units Forecast, by End User 2019 & 2032
- Table 119: Global Gaming Chair Market Revenue Million Forecast, by Distribution Channel 2019 & 2032
- Table 120: Global Gaming Chair Market Volume K Units Forecast, by Distribution Channel 2019 & 2032
- Table 121: Global Gaming Chair Market Revenue Million Forecast, by Country 2019 & 2032
- Table 122: Global Gaming Chair Market Volume K Units Forecast, by Country 2019 & 2032
- Table 123: United Kingdom Gaming Chair Market Revenue (Million) Forecast, by Application 2019 & 2032
- Table 124: United Kingdom Gaming Chair Market Volume (K Units) Forecast, by Application 2019 & 2032
- Table 125: Germany Gaming Chair Market Revenue (Million) Forecast, by Application 2019 & 2032
- Table 126: Germany Gaming Chair Market Volume (K Units) Forecast, by Application 2019 & 2032
- Table 127: Rest of Europe Gaming Chair Market Revenue (Million) Forecast, by Application 2019 & 2032
- Table 128: Rest of Europe Gaming Chair Market Volume (K Units) Forecast, by Application 2019 & 2032
- Table 129: Global Gaming Chair Market Revenue Million Forecast, by Type 2019 & 2032
- Table 130: Global Gaming Chair Market Volume K Units Forecast, by Type 2019 & 2032
- Table 131: Global Gaming Chair Market Revenue Million Forecast, by End User 2019 & 2032
- Table 132: Global Gaming Chair Market Volume K Units Forecast, by End User 2019 & 2032
- Table 133: Global Gaming Chair Market Revenue Million Forecast, by Distribution Channel 2019 & 2032
- Table 134: Global Gaming Chair Market Volume K Units Forecast, by Distribution Channel 2019 & 2032
- Table 135: Global Gaming Chair Market Revenue Million Forecast, by Country 2019 & 2032
- Table 136: Global Gaming Chair Market Volume K Units Forecast, by Country 2019 & 2032
- Table 137: India Gaming Chair Market Revenue (Million) Forecast, by Application 2019 & 2032
- Table 138: India Gaming Chair Market Volume (K Units) Forecast, by Application 2019 & 2032
- Table 139: Japan Gaming Chair Market Revenue (Million) Forecast, by Application 2019 & 2032
- Table 140: Japan Gaming Chair Market Volume (K Units) Forecast, by Application 2019 & 2032
- Table 141: Rest of Asia Pacific Gaming Chair Market Revenue (Million) Forecast, by Application 2019 & 2032
- Table 142: Rest of Asia Pacific Gaming Chair Market Volume (K Units) Forecast, by Application 2019 & 2032
- Table 143: Global Gaming Chair Market Revenue Million Forecast, by Type 2019 & 2032
- Table 144: Global Gaming Chair Market Volume K Units Forecast, by Type 2019 & 2032
- Table 145: Global Gaming Chair Market Revenue Million Forecast, by End User 2019 & 2032
- Table 146: Global Gaming Chair Market Volume K Units Forecast, by End User 2019 & 2032
- Table 147: Global Gaming Chair Market Revenue Million Forecast, by Distribution Channel 2019 & 2032
- Table 148: Global Gaming Chair Market Volume K Units Forecast, by Distribution Channel 2019 & 2032
- Table 149: Global Gaming Chair Market Revenue Million Forecast, by Country 2019 & 2032
- Table 150: Global Gaming Chair Market Volume K Units Forecast, by Country 2019 & 2032
- Table 151: Brazil Gaming Chair Market Revenue (Million) Forecast, by Application 2019 & 2032
- Table 152: Brazil Gaming Chair Market Volume (K Units) Forecast, by Application 2019 & 2032
- Table 153: Peru Gaming Chair Market Revenue (Million) Forecast, by Application 2019 & 2032
- Table 154: Peru Gaming Chair Market Volume (K Units) Forecast, by Application 2019 & 2032
- Table 155: Rest of South America Gaming Chair Market Revenue (Million) Forecast, by Application 2019 & 2032
- Table 156: Rest of South America Gaming Chair Market Volume (K Units) Forecast, by Application 2019 & 2032
- Table 157: Global Gaming Chair Market Revenue Million Forecast, by Type 2019 & 2032
- Table 158: Global Gaming Chair Market Volume K Units Forecast, by Type 2019 & 2032
- Table 159: Global Gaming Chair Market Revenue Million Forecast, by End User 2019 & 2032
- Table 160: Global Gaming Chair Market Volume K Units Forecast, by End User 2019 & 2032
- Table 161: Global Gaming Chair Market Revenue Million Forecast, by Distribution Channel 2019 & 2032
- Table 162: Global Gaming Chair Market Volume K Units Forecast, by Distribution Channel 2019 & 2032
- Table 163: Global Gaming Chair Market Revenue Million Forecast, by Country 2019 & 2032
- Table 164: Global Gaming Chair Market Volume K Units Forecast, by Country 2019 & 2032
- Table 165: Saudi Arabia Gaming Chair Market Revenue (Million) Forecast, by Application 2019 & 2032
- Table 166: Saudi Arabia Gaming Chair Market Volume (K Units) Forecast, by Application 2019 & 2032
- Table 167: United Arab Emirates Gaming Chair Market Revenue (Million) Forecast, by Application 2019 & 2032
- Table 168: United Arab Emirates Gaming Chair Market Volume (K Units) Forecast, by Application 2019 & 2032
- Table 169: Rest of Middle East and Africa Gaming Chair Market Revenue (Million) Forecast, by Application 2019 & 2032
- Table 170: Rest of Middle East and Africa Gaming Chair Market Volume (K Units) Forecast, by Application 2019 & 2032
Frequently Asked Questions
1. What is the projected Compound Annual Growth Rate (CAGR) of the Gaming Chair Market?
The projected CAGR is approximately 8.15%.
2. Which companies are prominent players in the Gaming Chair Market?
Key companies in the market include GT Omega Racing, Corsair, X Rocker, DxRacer USA, Arozzi, AkRacing, Noblechairs, Vertagear, Ace Casual Furniture, Secretlab.
3. What are the main segments of the Gaming Chair Market?
The market segments include Type, End User, Distribution Channel.
4. Can you provide details about the market size?
The market size is estimated to be USD 1.45 Million as of 2022.
5. What are some drivers contributing to market growth?
Technological Advancement booming the industry; Focus on Ergonomics and Comfort.
6. What are the notable trends driving market growth?
Expanding Video Gaming Industry is Driving the Market.
7. Are there any restraints impacting market growth?
High cost; Limited Target Audience.
8. Can you provide examples of recent developments in the market?
August 2022: Cybeart, a Canadian manufacturer of premium gaming accessories, announced the world's first Lord of the Rings Chair on 25th August 2022. In addition to Cybeart's existing range of officially licensed products, the upcoming product line will be a continuation of its ongoing partnership with Warner Bros.
9. What pricing options are available for accessing the report?
Pricing options include single-user, multi-user, and enterprise licenses priced at USD 4750, USD 5250, and USD 8750 respectively.
10. Is the market size provided in terms of value or volume?
The market size is provided in terms of value, measured in Million and volume, measured in K Units.
11. Are there any specific market keywords associated with the report?
Yes, the market keyword associated with the report is "Gaming Chair Market," which aids in identifying and referencing the specific market segment covered.
12. How do I determine which pricing option suits my needs best?
The pricing options vary based on user requirements and access needs. Individual users may opt for single-user licenses, while businesses requiring broader access may choose multi-user or enterprise licenses for cost-effective access to the report.
13. Are there any additional resources or data provided in the Gaming Chair Market report?
While the report offers comprehensive insights, it's advisable to review the specific contents or supplementary materials provided to ascertain if additional resources or data are available.
14. How can I stay updated on further developments or reports in the Gaming Chair Market?
To stay informed about further developments, trends, and reports in the Gaming Chair Market, consider subscribing to industry newsletters, following relevant companies and organizations, or regularly checking reputable industry news sources and publications.
Methodology
Step 1 - Identification of Relevant Samples Size from Population Database


Step 2 - Approaches for Defining Global Market Size (Value, Volume* & Price*)

Note*: In applicable scenarios
Step 3 - Data Sources
Primary Research
- Web Analytics
- Survey Reports
- Research Institute
- Latest Research Reports
- Opinion Leaders
Secondary Research
- Annual Reports
- White Paper
- Latest Press Release
- Industry Association
- Paid Database
- Investor Presentations

Step 4 - Data Triangulation
Involves using different sources of information in order to increase the validity of a study
These sources are likely to be stakeholders in a program - participants, other researchers, program staff, other community members, and so on.
Then we put all data in single framework & apply various statistical tools to find out the dynamic on the market.
During the analysis stage, feedback from the stakeholder groups would be compared to determine areas of agreement as well as areas of divergence
