

Key Insights
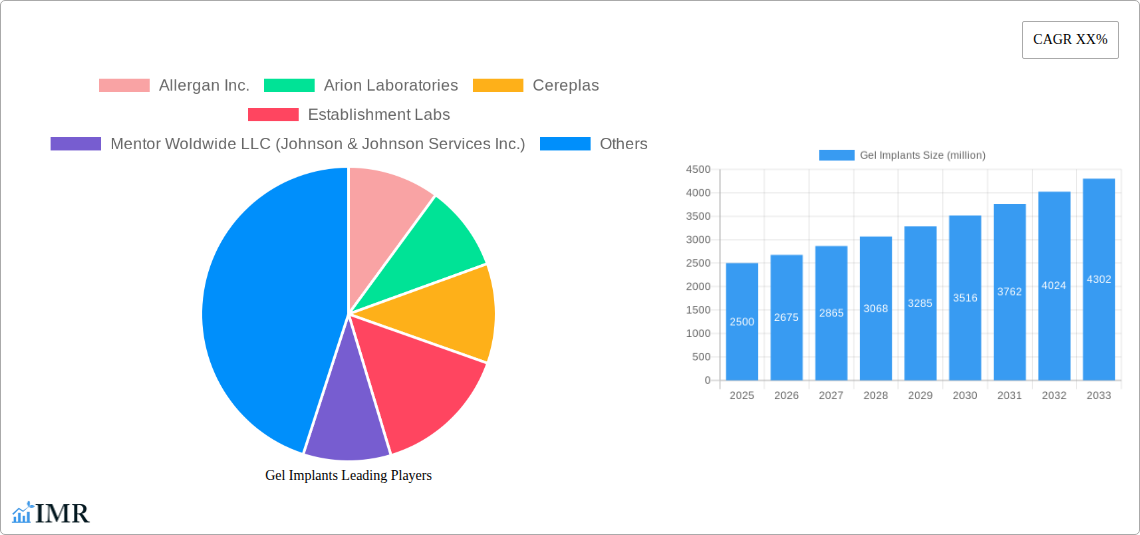
The global gel breast implant market is experiencing robust growth, driven by increasing demand for cosmetic procedures and advancements in implant technology. The market, valued at approximately $2.5 billion in 2025, is projected to expand at a Compound Annual Growth Rate (CAGR) of 7% from 2025 to 2033, reaching an estimated $4.5 billion by 2033. This growth is fueled by several factors, including rising disposable incomes in developing economies, increased awareness of cosmetic surgery options, and a growing preference for minimally invasive procedures. Technological advancements, such as the development of implants with improved safety profiles and more natural-feeling textures, are further propelling market expansion. The key market segments include different implant types (e.g., saline vs. silicone gel), and various patient demographics. The competitive landscape is characterized by a mix of established multinational corporations and specialized manufacturers. Strategic partnerships, mergers and acquisitions, and the introduction of innovative products are key competitive strategies adopted by players to gain a greater market share.
Despite the promising growth outlook, the market faces certain challenges. Regulatory hurdles and safety concerns surrounding implant use remain significant restraints. Moreover, the high cost of procedures and potential post-operative complications can limit accessibility for some segments of the population. Despite these challenges, the growing awareness of body image and self-improvement, along with an increasing acceptance of cosmetic procedures, is expected to support sustained market growth in the long term. The increasing demand for personalized medicine and the use of AI and machine learning in the development of safer and more effective implants are set to be major trends that will shape the sector's future trajectory.
Gel Implants Market Report: 2019-2033
This comprehensive report provides an in-depth analysis of the global Gel Implants market, encompassing market dynamics, growth trends, regional analysis, competitive landscape, and future outlook. The study period covers 2019-2033, with 2025 as the base and estimated year. This report is essential for industry professionals, investors, and strategic decision-makers seeking a clear understanding of this dynamic market. The parent market is the medical devices industry, and the child market is cosmetic surgery and reconstructive surgery.
Gel Implants Market Dynamics & Structure
The global gel implants market, valued at $xx million in 2025, is characterized by moderate concentration with key players holding significant market share. Technological innovation, primarily in material science and implant design, is a crucial driver. Stringent regulatory frameworks, varying across regions, influence market access and product approvals. Competitive substitutes, such as autologous fat grafting, pose challenges, while end-user demographics (age, income, aesthetic preferences) significantly influence demand. The market has witnessed a moderate level of M&A activity in recent years, with consolidation expected to continue.
- Market Concentration: Top 5 players hold approximately xx% of the market share in 2025.
- Technological Innovation: Focus on improved biocompatibility, longevity, and reduced complication rates.
- Regulatory Landscape: Varying approval processes across regions create market access barriers.
- Competitive Substitutes: Autologous fat grafting and other minimally invasive procedures present competition.
- M&A Activity: xx major M&A deals occurred between 2019 and 2024, with an average deal value of $xx million.
- Innovation Barriers: High R&D costs, lengthy regulatory approval processes, and safety concerns.
Gel Implants Growth Trends & Insights
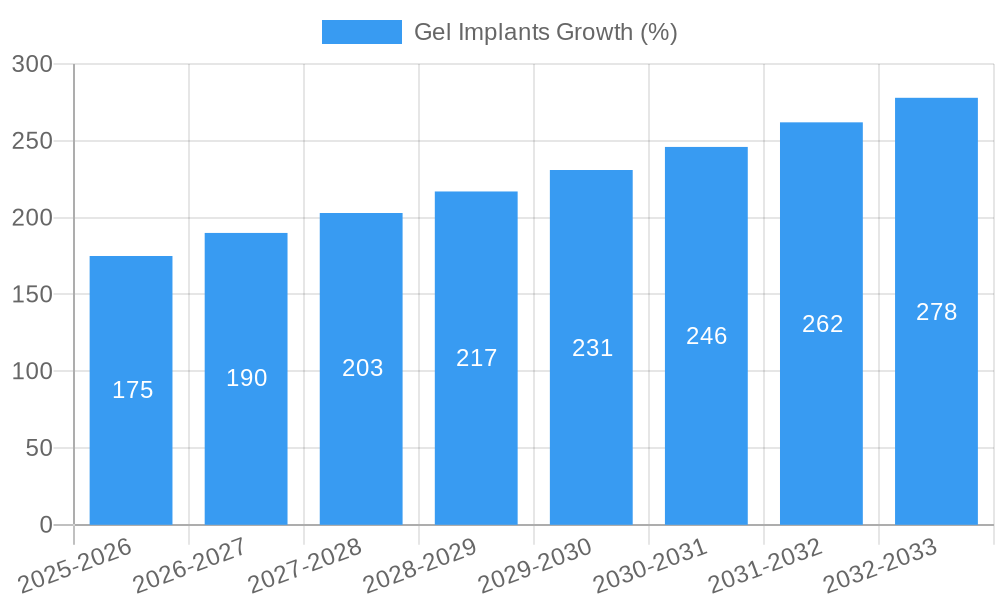
The gel implants market experienced a CAGR of xx% during the historical period (2019-2024), driven by increasing demand for cosmetic procedures and reconstructive surgeries. Market penetration remains relatively high in developed regions but shows significant growth potential in emerging markets. Technological advancements, such as improved implant designs and minimally invasive surgical techniques, are accelerating adoption. Consumer behavior shifts towards personalized medicine and enhanced aesthetic outcomes further fuel market growth. The forecast period (2025-2033) projects a CAGR of xx%, reaching a market value of $xx million by 2033. This growth is fueled by factors such as increasing disposable income in developing countries, rising awareness about cosmetic surgeries, and technological advancements that enhance the safety and efficacy of gel implants.
Dominant Regions, Countries, or Segments in Gel Implants
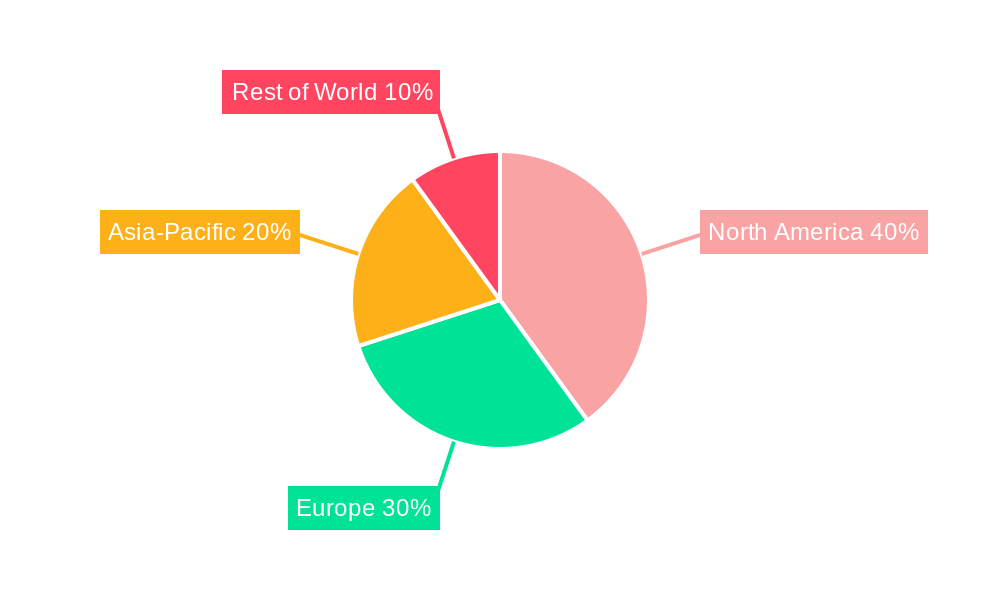
North America currently dominates the gel implants market, holding the largest market share in 2025 (xx%), followed by Europe (xx%) and Asia Pacific (xx%). This dominance is attributed to high disposable incomes, advanced healthcare infrastructure, and a high prevalence of cosmetic procedures. However, Asia Pacific is projected to experience the fastest growth rate during the forecast period, driven by increasing awareness and acceptance of cosmetic enhancements, coupled with expanding healthcare infrastructure.
- North America: High adoption rates due to advanced healthcare infrastructure and high disposable incomes.
- Europe: Stable growth driven by established cosmetic surgery markets and regulatory frameworks.
- Asia Pacific: Fastest-growing region due to rising disposable incomes and increasing awareness of cosmetic procedures.
- Key Drivers: Rising disposable income, favorable regulatory environment, increasing awareness of cosmetic procedures, advancements in surgical techniques.
Gel Implants Product Landscape
Gel implants are available in various forms, including cohesive gel, silicone gel, and saline-filled implants, each offering specific advantages in terms of texture, feel, and longevity. Recent innovations focus on improving biocompatibility, reducing the risk of complications (e.g., rupture, capsular contracture), and enhancing the aesthetic outcome. These advancements are aimed at improving patient satisfaction and reducing post-operative complications. Unique selling propositions often center on improved safety profiles, enhanced implant design for natural aesthetics, and minimally invasive surgical techniques.
Key Drivers, Barriers & Challenges in Gel Implants
Key Drivers: Increasing demand for cosmetic procedures, technological advancements leading to improved safety and efficacy, favorable regulatory environments in certain regions, and rising disposable incomes in emerging markets.
Challenges & Restraints: High procedure costs, potential complications (e.g., rupture, infection, capsular contracture), stringent regulatory hurdles in some regions, and competition from alternative treatments. The estimated impact of these challenges on market growth is around xx% reduction in projected growth during the forecast period.
Emerging Opportunities in Gel Implants
Emerging opportunities lie in untapped markets in developing countries, the development of innovative implant materials with enhanced biocompatibility, and the increasing demand for minimally invasive surgical techniques. Personalized medicine approaches, focusing on tailoring implant characteristics to individual patient needs, are also creating exciting opportunities for market expansion.
Growth Accelerators in the Gel Implants Industry
Strategic partnerships between implant manufacturers and surgical centers are expected to accelerate market growth. Technological advancements, particularly in implant design and surgical techniques, will continue to drive adoption. Expansion into untapped markets, coupled with effective marketing and patient education campaigns, will further accelerate market growth.
Key Players Shaping the Gel Implants Market
- Allergan Inc.
- Arion Laboratories
- Cereplas
- Establishment Labs
- Mentor Worldwide LLC (Johnson & Johnson Services Inc.)
- GC Aesthetics PLC
- Sientra Inc.
- Groupe Sebbin SAS
- Polytech Health & Aesthetics GmbH
- HansBiomed Co Ltd.
- Guangzhou Wanhe Plastic Materials
- Ideal Implant
Notable Milestones in Gel Implants Sector
- 2020: FDA approval of a new gel implant with improved biocompatibility.
- 2021: Launch of a minimally invasive surgical technique for gel implant placement.
- 2022: Acquisition of a smaller gel implant manufacturer by a major medical device company.
- 2023: Publication of a major clinical study demonstrating the long-term safety and efficacy of a new implant design.
- 2024: Several new gel implant models launched by multiple companies.
In-Depth Gel Implants Market Outlook
The gel implants market is poised for significant growth over the next decade, driven by technological advancements, expanding market penetration in emerging economies, and an increasing demand for aesthetic and reconstructive procedures. Strategic investments in R&D, strategic partnerships, and focused marketing efforts will be crucial for companies to capture a greater market share in this evolving landscape. The forecast period will see continued innovation and a greater focus on patient safety and personalized outcomes.
Gel Implants Segmentation
-
1. Application
- 1.1. Hospitals
- 1.2. Cosmetology Clinics
- 1.3. Ambulatory Surgical Centers
-
2. Types
- 2.1. Cohesive Gel Implants
- 2.2. Highly Cohesive Gel Implants
Gel Implants Segmentation By Geography
-
1. North America
- 1.1. United States
- 1.2. Canada
- 1.3. Mexico
-
2. South America
- 2.1. Brazil
- 2.2. Argentina
- 2.3. Rest of South America
-
3. Europe
- 3.1. United Kingdom
- 3.2. Germany
- 3.3. France
- 3.4. Italy
- 3.5. Spain
- 3.6. Russia
- 3.7. Benelux
- 3.8. Nordics
- 3.9. Rest of Europe
-
4. Middle East & Africa
- 4.1. Turkey
- 4.2. Israel
- 4.3. GCC
- 4.4. North Africa
- 4.5. South Africa
- 4.6. Rest of Middle East & Africa
-
5. Asia Pacific
- 5.1. China
- 5.2. India
- 5.3. Japan
- 5.4. South Korea
- 5.5. ASEAN
- 5.6. Oceania
- 5.7. Rest of Asia Pacific
Gel Implants REPORT HIGHLIGHTS
| Aspects | Details |
|---|---|
| Study Period | 2019-2033 |
| Base Year | 2024 |
| Estimated Year | 2025 |
| Forecast Period | 2025-2033 |
| Historical Period | 2019-2024 |
| Growth Rate | CAGR of XX% from 2019-2033 |
| Segmentation |
|
Table of Contents
- 1. Introduction
- 1.1. Research Scope
- 1.2. Market Segmentation
- 1.3. Research Methodology
- 1.4. Definitions and Assumptions
- 2. Executive Summary
- 2.1. Introduction
- 3. Market Dynamics
- 3.1. Introduction
- 3.2. Market Drivers
- 3.3. Market Restrains
- 3.4. Market Trends
- 4. Market Factor Analysis
- 4.1. Porters Five Forces
- 4.2. Supply/Value Chain
- 4.3. PESTEL analysis
- 4.4. Market Entropy
- 4.5. Patent/Trademark Analysis
- 5. Global Gel Implants Analysis, Insights and Forecast, 2019-2031
- 5.1. Market Analysis, Insights and Forecast - by Application
- 5.1.1. Hospitals
- 5.1.2. Cosmetology Clinics
- 5.1.3. Ambulatory Surgical Centers
- 5.2. Market Analysis, Insights and Forecast - by Types
- 5.2.1. Cohesive Gel Implants
- 5.2.2. Highly Cohesive Gel Implants
- 5.3. Market Analysis, Insights and Forecast - by Region
- 5.3.1. North America
- 5.3.2. South America
- 5.3.3. Europe
- 5.3.4. Middle East & Africa
- 5.3.5. Asia Pacific
- 5.1. Market Analysis, Insights and Forecast - by Application
- 6. North America Gel Implants Analysis, Insights and Forecast, 2019-2031
- 6.1. Market Analysis, Insights and Forecast - by Application
- 6.1.1. Hospitals
- 6.1.2. Cosmetology Clinics
- 6.1.3. Ambulatory Surgical Centers
- 6.2. Market Analysis, Insights and Forecast - by Types
- 6.2.1. Cohesive Gel Implants
- 6.2.2. Highly Cohesive Gel Implants
- 6.1. Market Analysis, Insights and Forecast - by Application
- 7. South America Gel Implants Analysis, Insights and Forecast, 2019-2031
- 7.1. Market Analysis, Insights and Forecast - by Application
- 7.1.1. Hospitals
- 7.1.2. Cosmetology Clinics
- 7.1.3. Ambulatory Surgical Centers
- 7.2. Market Analysis, Insights and Forecast - by Types
- 7.2.1. Cohesive Gel Implants
- 7.2.2. Highly Cohesive Gel Implants
- 7.1. Market Analysis, Insights and Forecast - by Application
- 8. Europe Gel Implants Analysis, Insights and Forecast, 2019-2031
- 8.1. Market Analysis, Insights and Forecast - by Application
- 8.1.1. Hospitals
- 8.1.2. Cosmetology Clinics
- 8.1.3. Ambulatory Surgical Centers
- 8.2. Market Analysis, Insights and Forecast - by Types
- 8.2.1. Cohesive Gel Implants
- 8.2.2. Highly Cohesive Gel Implants
- 8.1. Market Analysis, Insights and Forecast - by Application
- 9. Middle East & Africa Gel Implants Analysis, Insights and Forecast, 2019-2031
- 9.1. Market Analysis, Insights and Forecast - by Application
- 9.1.1. Hospitals
- 9.1.2. Cosmetology Clinics
- 9.1.3. Ambulatory Surgical Centers
- 9.2. Market Analysis, Insights and Forecast - by Types
- 9.2.1. Cohesive Gel Implants
- 9.2.2. Highly Cohesive Gel Implants
- 9.1. Market Analysis, Insights and Forecast - by Application
- 10. Asia Pacific Gel Implants Analysis, Insights and Forecast, 2019-2031
- 10.1. Market Analysis, Insights and Forecast - by Application
- 10.1.1. Hospitals
- 10.1.2. Cosmetology Clinics
- 10.1.3. Ambulatory Surgical Centers
- 10.2. Market Analysis, Insights and Forecast - by Types
- 10.2.1. Cohesive Gel Implants
- 10.2.2. Highly Cohesive Gel Implants
- 10.1. Market Analysis, Insights and Forecast - by Application
- 11. Competitive Analysis
- 11.1. Global Market Share Analysis 2024
- 11.2. Company Profiles
- 11.2.1 Allergan Inc.
- 11.2.1.1. Overview
- 11.2.1.2. Products
- 11.2.1.3. SWOT Analysis
- 11.2.1.4. Recent Developments
- 11.2.1.5. Financials (Based on Availability)
- 11.2.2 Arion Laboratories
- 11.2.2.1. Overview
- 11.2.2.2. Products
- 11.2.2.3. SWOT Analysis
- 11.2.2.4. Recent Developments
- 11.2.2.5. Financials (Based on Availability)
- 11.2.3 Cereplas
- 11.2.3.1. Overview
- 11.2.3.2. Products
- 11.2.3.3. SWOT Analysis
- 11.2.3.4. Recent Developments
- 11.2.3.5. Financials (Based on Availability)
- 11.2.4 Establishment Labs
- 11.2.4.1. Overview
- 11.2.4.2. Products
- 11.2.4.3. SWOT Analysis
- 11.2.4.4. Recent Developments
- 11.2.4.5. Financials (Based on Availability)
- 11.2.5 Mentor Woldwide LLC (Johnson & Johnson Services Inc.)
- 11.2.5.1. Overview
- 11.2.5.2. Products
- 11.2.5.3. SWOT Analysis
- 11.2.5.4. Recent Developments
- 11.2.5.5. Financials (Based on Availability)
- 11.2.6 GC Aesthetics PLC
- 11.2.6.1. Overview
- 11.2.6.2. Products
- 11.2.6.3. SWOT Analysis
- 11.2.6.4. Recent Developments
- 11.2.6.5. Financials (Based on Availability)
- 11.2.7 Sientra Inc.
- 11.2.7.1. Overview
- 11.2.7.2. Products
- 11.2.7.3. SWOT Analysis
- 11.2.7.4. Recent Developments
- 11.2.7.5. Financials (Based on Availability)
- 11.2.8 Groupe Sebbin SAS
- 11.2.8.1. Overview
- 11.2.8.2. Products
- 11.2.8.3. SWOT Analysis
- 11.2.8.4. Recent Developments
- 11.2.8.5. Financials (Based on Availability)
- 11.2.9 Polytech Health & Aesthetics GmbH
- 11.2.9.1. Overview
- 11.2.9.2. Products
- 11.2.9.3. SWOT Analysis
- 11.2.9.4. Recent Developments
- 11.2.9.5. Financials (Based on Availability)
- 11.2.10 HansBiomed Co Ltd.
- 11.2.10.1. Overview
- 11.2.10.2. Products
- 11.2.10.3. SWOT Analysis
- 11.2.10.4. Recent Developments
- 11.2.10.5. Financials (Based on Availability)
- 11.2.11 Guangzhou Wanhe Plastic Materials
- 11.2.11.1. Overview
- 11.2.11.2. Products
- 11.2.11.3. SWOT Analysis
- 11.2.11.4. Recent Developments
- 11.2.11.5. Financials (Based on Availability)
- 11.2.12 Ideal Implant
- 11.2.12.1. Overview
- 11.2.12.2. Products
- 11.2.12.3. SWOT Analysis
- 11.2.12.4. Recent Developments
- 11.2.12.5. Financials (Based on Availability)
- 11.2.1 Allergan Inc.
List of Figures
- Figure 1: Global Gel Implants Revenue Breakdown (million, %) by Region 2024 & 2032
- Figure 2: Global Gel Implants Volume Breakdown (K, %) by Region 2024 & 2032
- Figure 3: North America Gel Implants Revenue (million), by Application 2024 & 2032
- Figure 4: North America Gel Implants Volume (K), by Application 2024 & 2032
- Figure 5: North America Gel Implants Revenue Share (%), by Application 2024 & 2032
- Figure 6: North America Gel Implants Volume Share (%), by Application 2024 & 2032
- Figure 7: North America Gel Implants Revenue (million), by Types 2024 & 2032
- Figure 8: North America Gel Implants Volume (K), by Types 2024 & 2032
- Figure 9: North America Gel Implants Revenue Share (%), by Types 2024 & 2032
- Figure 10: North America Gel Implants Volume Share (%), by Types 2024 & 2032
- Figure 11: North America Gel Implants Revenue (million), by Country 2024 & 2032
- Figure 12: North America Gel Implants Volume (K), by Country 2024 & 2032
- Figure 13: North America Gel Implants Revenue Share (%), by Country 2024 & 2032
- Figure 14: North America Gel Implants Volume Share (%), by Country 2024 & 2032
- Figure 15: South America Gel Implants Revenue (million), by Application 2024 & 2032
- Figure 16: South America Gel Implants Volume (K), by Application 2024 & 2032
- Figure 17: South America Gel Implants Revenue Share (%), by Application 2024 & 2032
- Figure 18: South America Gel Implants Volume Share (%), by Application 2024 & 2032
- Figure 19: South America Gel Implants Revenue (million), by Types 2024 & 2032
- Figure 20: South America Gel Implants Volume (K), by Types 2024 & 2032
- Figure 21: South America Gel Implants Revenue Share (%), by Types 2024 & 2032
- Figure 22: South America Gel Implants Volume Share (%), by Types 2024 & 2032
- Figure 23: South America Gel Implants Revenue (million), by Country 2024 & 2032
- Figure 24: South America Gel Implants Volume (K), by Country 2024 & 2032
- Figure 25: South America Gel Implants Revenue Share (%), by Country 2024 & 2032
- Figure 26: South America Gel Implants Volume Share (%), by Country 2024 & 2032
- Figure 27: Europe Gel Implants Revenue (million), by Application 2024 & 2032
- Figure 28: Europe Gel Implants Volume (K), by Application 2024 & 2032
- Figure 29: Europe Gel Implants Revenue Share (%), by Application 2024 & 2032
- Figure 30: Europe Gel Implants Volume Share (%), by Application 2024 & 2032
- Figure 31: Europe Gel Implants Revenue (million), by Types 2024 & 2032
- Figure 32: Europe Gel Implants Volume (K), by Types 2024 & 2032
- Figure 33: Europe Gel Implants Revenue Share (%), by Types 2024 & 2032
- Figure 34: Europe Gel Implants Volume Share (%), by Types 2024 & 2032
- Figure 35: Europe Gel Implants Revenue (million), by Country 2024 & 2032
- Figure 36: Europe Gel Implants Volume (K), by Country 2024 & 2032
- Figure 37: Europe Gel Implants Revenue Share (%), by Country 2024 & 2032
- Figure 38: Europe Gel Implants Volume Share (%), by Country 2024 & 2032
- Figure 39: Middle East & Africa Gel Implants Revenue (million), by Application 2024 & 2032
- Figure 40: Middle East & Africa Gel Implants Volume (K), by Application 2024 & 2032
- Figure 41: Middle East & Africa Gel Implants Revenue Share (%), by Application 2024 & 2032
- Figure 42: Middle East & Africa Gel Implants Volume Share (%), by Application 2024 & 2032
- Figure 43: Middle East & Africa Gel Implants Revenue (million), by Types 2024 & 2032
- Figure 44: Middle East & Africa Gel Implants Volume (K), by Types 2024 & 2032
- Figure 45: Middle East & Africa Gel Implants Revenue Share (%), by Types 2024 & 2032
- Figure 46: Middle East & Africa Gel Implants Volume Share (%), by Types 2024 & 2032
- Figure 47: Middle East & Africa Gel Implants Revenue (million), by Country 2024 & 2032
- Figure 48: Middle East & Africa Gel Implants Volume (K), by Country 2024 & 2032
- Figure 49: Middle East & Africa Gel Implants Revenue Share (%), by Country 2024 & 2032
- Figure 50: Middle East & Africa Gel Implants Volume Share (%), by Country 2024 & 2032
- Figure 51: Asia Pacific Gel Implants Revenue (million), by Application 2024 & 2032
- Figure 52: Asia Pacific Gel Implants Volume (K), by Application 2024 & 2032
- Figure 53: Asia Pacific Gel Implants Revenue Share (%), by Application 2024 & 2032
- Figure 54: Asia Pacific Gel Implants Volume Share (%), by Application 2024 & 2032
- Figure 55: Asia Pacific Gel Implants Revenue (million), by Types 2024 & 2032
- Figure 56: Asia Pacific Gel Implants Volume (K), by Types 2024 & 2032
- Figure 57: Asia Pacific Gel Implants Revenue Share (%), by Types 2024 & 2032
- Figure 58: Asia Pacific Gel Implants Volume Share (%), by Types 2024 & 2032
- Figure 59: Asia Pacific Gel Implants Revenue (million), by Country 2024 & 2032
- Figure 60: Asia Pacific Gel Implants Volume (K), by Country 2024 & 2032
- Figure 61: Asia Pacific Gel Implants Revenue Share (%), by Country 2024 & 2032
- Figure 62: Asia Pacific Gel Implants Volume Share (%), by Country 2024 & 2032
List of Tables
- Table 1: Global Gel Implants Revenue million Forecast, by Region 2019 & 2032
- Table 2: Global Gel Implants Volume K Forecast, by Region 2019 & 2032
- Table 3: Global Gel Implants Revenue million Forecast, by Application 2019 & 2032
- Table 4: Global Gel Implants Volume K Forecast, by Application 2019 & 2032
- Table 5: Global Gel Implants Revenue million Forecast, by Types 2019 & 2032
- Table 6: Global Gel Implants Volume K Forecast, by Types 2019 & 2032
- Table 7: Global Gel Implants Revenue million Forecast, by Region 2019 & 2032
- Table 8: Global Gel Implants Volume K Forecast, by Region 2019 & 2032
- Table 9: Global Gel Implants Revenue million Forecast, by Application 2019 & 2032
- Table 10: Global Gel Implants Volume K Forecast, by Application 2019 & 2032
- Table 11: Global Gel Implants Revenue million Forecast, by Types 2019 & 2032
- Table 12: Global Gel Implants Volume K Forecast, by Types 2019 & 2032
- Table 13: Global Gel Implants Revenue million Forecast, by Country 2019 & 2032
- Table 14: Global Gel Implants Volume K Forecast, by Country 2019 & 2032
- Table 15: United States Gel Implants Revenue (million) Forecast, by Application 2019 & 2032
- Table 16: United States Gel Implants Volume (K) Forecast, by Application 2019 & 2032
- Table 17: Canada Gel Implants Revenue (million) Forecast, by Application 2019 & 2032
- Table 18: Canada Gel Implants Volume (K) Forecast, by Application 2019 & 2032
- Table 19: Mexico Gel Implants Revenue (million) Forecast, by Application 2019 & 2032
- Table 20: Mexico Gel Implants Volume (K) Forecast, by Application 2019 & 2032
- Table 21: Global Gel Implants Revenue million Forecast, by Application 2019 & 2032
- Table 22: Global Gel Implants Volume K Forecast, by Application 2019 & 2032
- Table 23: Global Gel Implants Revenue million Forecast, by Types 2019 & 2032
- Table 24: Global Gel Implants Volume K Forecast, by Types 2019 & 2032
- Table 25: Global Gel Implants Revenue million Forecast, by Country 2019 & 2032
- Table 26: Global Gel Implants Volume K Forecast, by Country 2019 & 2032
- Table 27: Brazil Gel Implants Revenue (million) Forecast, by Application 2019 & 2032
- Table 28: Brazil Gel Implants Volume (K) Forecast, by Application 2019 & 2032
- Table 29: Argentina Gel Implants Revenue (million) Forecast, by Application 2019 & 2032
- Table 30: Argentina Gel Implants Volume (K) Forecast, by Application 2019 & 2032
- Table 31: Rest of South America Gel Implants Revenue (million) Forecast, by Application 2019 & 2032
- Table 32: Rest of South America Gel Implants Volume (K) Forecast, by Application 2019 & 2032
- Table 33: Global Gel Implants Revenue million Forecast, by Application 2019 & 2032
- Table 34: Global Gel Implants Volume K Forecast, by Application 2019 & 2032
- Table 35: Global Gel Implants Revenue million Forecast, by Types 2019 & 2032
- Table 36: Global Gel Implants Volume K Forecast, by Types 2019 & 2032
- Table 37: Global Gel Implants Revenue million Forecast, by Country 2019 & 2032
- Table 38: Global Gel Implants Volume K Forecast, by Country 2019 & 2032
- Table 39: United Kingdom Gel Implants Revenue (million) Forecast, by Application 2019 & 2032
- Table 40: United Kingdom Gel Implants Volume (K) Forecast, by Application 2019 & 2032
- Table 41: Germany Gel Implants Revenue (million) Forecast, by Application 2019 & 2032
- Table 42: Germany Gel Implants Volume (K) Forecast, by Application 2019 & 2032
- Table 43: France Gel Implants Revenue (million) Forecast, by Application 2019 & 2032
- Table 44: France Gel Implants Volume (K) Forecast, by Application 2019 & 2032
- Table 45: Italy Gel Implants Revenue (million) Forecast, by Application 2019 & 2032
- Table 46: Italy Gel Implants Volume (K) Forecast, by Application 2019 & 2032
- Table 47: Spain Gel Implants Revenue (million) Forecast, by Application 2019 & 2032
- Table 48: Spain Gel Implants Volume (K) Forecast, by Application 2019 & 2032
- Table 49: Russia Gel Implants Revenue (million) Forecast, by Application 2019 & 2032
- Table 50: Russia Gel Implants Volume (K) Forecast, by Application 2019 & 2032
- Table 51: Benelux Gel Implants Revenue (million) Forecast, by Application 2019 & 2032
- Table 52: Benelux Gel Implants Volume (K) Forecast, by Application 2019 & 2032
- Table 53: Nordics Gel Implants Revenue (million) Forecast, by Application 2019 & 2032
- Table 54: Nordics Gel Implants Volume (K) Forecast, by Application 2019 & 2032
- Table 55: Rest of Europe Gel Implants Revenue (million) Forecast, by Application 2019 & 2032
- Table 56: Rest of Europe Gel Implants Volume (K) Forecast, by Application 2019 & 2032
- Table 57: Global Gel Implants Revenue million Forecast, by Application 2019 & 2032
- Table 58: Global Gel Implants Volume K Forecast, by Application 2019 & 2032
- Table 59: Global Gel Implants Revenue million Forecast, by Types 2019 & 2032
- Table 60: Global Gel Implants Volume K Forecast, by Types 2019 & 2032
- Table 61: Global Gel Implants Revenue million Forecast, by Country 2019 & 2032
- Table 62: Global Gel Implants Volume K Forecast, by Country 2019 & 2032
- Table 63: Turkey Gel Implants Revenue (million) Forecast, by Application 2019 & 2032
- Table 64: Turkey Gel Implants Volume (K) Forecast, by Application 2019 & 2032
- Table 65: Israel Gel Implants Revenue (million) Forecast, by Application 2019 & 2032
- Table 66: Israel Gel Implants Volume (K) Forecast, by Application 2019 & 2032
- Table 67: GCC Gel Implants Revenue (million) Forecast, by Application 2019 & 2032
- Table 68: GCC Gel Implants Volume (K) Forecast, by Application 2019 & 2032
- Table 69: North Africa Gel Implants Revenue (million) Forecast, by Application 2019 & 2032
- Table 70: North Africa Gel Implants Volume (K) Forecast, by Application 2019 & 2032
- Table 71: South Africa Gel Implants Revenue (million) Forecast, by Application 2019 & 2032
- Table 72: South Africa Gel Implants Volume (K) Forecast, by Application 2019 & 2032
- Table 73: Rest of Middle East & Africa Gel Implants Revenue (million) Forecast, by Application 2019 & 2032
- Table 74: Rest of Middle East & Africa Gel Implants Volume (K) Forecast, by Application 2019 & 2032
- Table 75: Global Gel Implants Revenue million Forecast, by Application 2019 & 2032
- Table 76: Global Gel Implants Volume K Forecast, by Application 2019 & 2032
- Table 77: Global Gel Implants Revenue million Forecast, by Types 2019 & 2032
- Table 78: Global Gel Implants Volume K Forecast, by Types 2019 & 2032
- Table 79: Global Gel Implants Revenue million Forecast, by Country 2019 & 2032
- Table 80: Global Gel Implants Volume K Forecast, by Country 2019 & 2032
- Table 81: China Gel Implants Revenue (million) Forecast, by Application 2019 & 2032
- Table 82: China Gel Implants Volume (K) Forecast, by Application 2019 & 2032
- Table 83: India Gel Implants Revenue (million) Forecast, by Application 2019 & 2032
- Table 84: India Gel Implants Volume (K) Forecast, by Application 2019 & 2032
- Table 85: Japan Gel Implants Revenue (million) Forecast, by Application 2019 & 2032
- Table 86: Japan Gel Implants Volume (K) Forecast, by Application 2019 & 2032
- Table 87: South Korea Gel Implants Revenue (million) Forecast, by Application 2019 & 2032
- Table 88: South Korea Gel Implants Volume (K) Forecast, by Application 2019 & 2032
- Table 89: ASEAN Gel Implants Revenue (million) Forecast, by Application 2019 & 2032
- Table 90: ASEAN Gel Implants Volume (K) Forecast, by Application 2019 & 2032
- Table 91: Oceania Gel Implants Revenue (million) Forecast, by Application 2019 & 2032
- Table 92: Oceania Gel Implants Volume (K) Forecast, by Application 2019 & 2032
- Table 93: Rest of Asia Pacific Gel Implants Revenue (million) Forecast, by Application 2019 & 2032
- Table 94: Rest of Asia Pacific Gel Implants Volume (K) Forecast, by Application 2019 & 2032
Frequently Asked Questions
1. What is the projected Compound Annual Growth Rate (CAGR) of the Gel Implants?
The projected CAGR is approximately XX%.
2. Which companies are prominent players in the Gel Implants?
Key companies in the market include Allergan Inc., Arion Laboratories, Cereplas, Establishment Labs, Mentor Woldwide LLC (Johnson & Johnson Services Inc.), GC Aesthetics PLC, Sientra Inc., Groupe Sebbin SAS, Polytech Health & Aesthetics GmbH, HansBiomed Co Ltd., Guangzhou Wanhe Plastic Materials, Ideal Implant.
3. What are the main segments of the Gel Implants?
The market segments include Application, Types.
4. Can you provide details about the market size?
The market size is estimated to be USD XXX million as of 2022.
5. What are some drivers contributing to market growth?
N/A
6. What are the notable trends driving market growth?
N/A
7. Are there any restraints impacting market growth?
N/A
8. Can you provide examples of recent developments in the market?
N/A
9. What pricing options are available for accessing the report?
Pricing options include single-user, multi-user, and enterprise licenses priced at USD 3350.00, USD 5025.00, and USD 6700.00 respectively.
10. Is the market size provided in terms of value or volume?
The market size is provided in terms of value, measured in million and volume, measured in K.
11. Are there any specific market keywords associated with the report?
Yes, the market keyword associated with the report is "Gel Implants," which aids in identifying and referencing the specific market segment covered.
12. How do I determine which pricing option suits my needs best?
The pricing options vary based on user requirements and access needs. Individual users may opt for single-user licenses, while businesses requiring broader access may choose multi-user or enterprise licenses for cost-effective access to the report.
13. Are there any additional resources or data provided in the Gel Implants report?
While the report offers comprehensive insights, it's advisable to review the specific contents or supplementary materials provided to ascertain if additional resources or data are available.
14. How can I stay updated on further developments or reports in the Gel Implants?
To stay informed about further developments, trends, and reports in the Gel Implants, consider subscribing to industry newsletters, following relevant companies and organizations, or regularly checking reputable industry news sources and publications.
Methodology
Step 1 - Identification of Relevant Samples Size from Population Database


Step 2 - Approaches for Defining Global Market Size (Value, Volume* & Price*)

Note*: In applicable scenarios
Step 3 - Data Sources
Primary Research
- Web Analytics
- Survey Reports
- Research Institute
- Latest Research Reports
- Opinion Leaders
Secondary Research
- Annual Reports
- White Paper
- Latest Press Release
- Industry Association
- Paid Database
- Investor Presentations

Step 4 - Data Triangulation
Involves using different sources of information in order to increase the validity of a study
These sources are likely to be stakeholders in a program - participants, other researchers, program staff, other community members, and so on.
Then we put all data in single framework & apply various statistical tools to find out the dynamic on the market.
During the analysis stage, feedback from the stakeholder groups would be compared to determine areas of agreement as well as areas of divergence
