

Key Insights
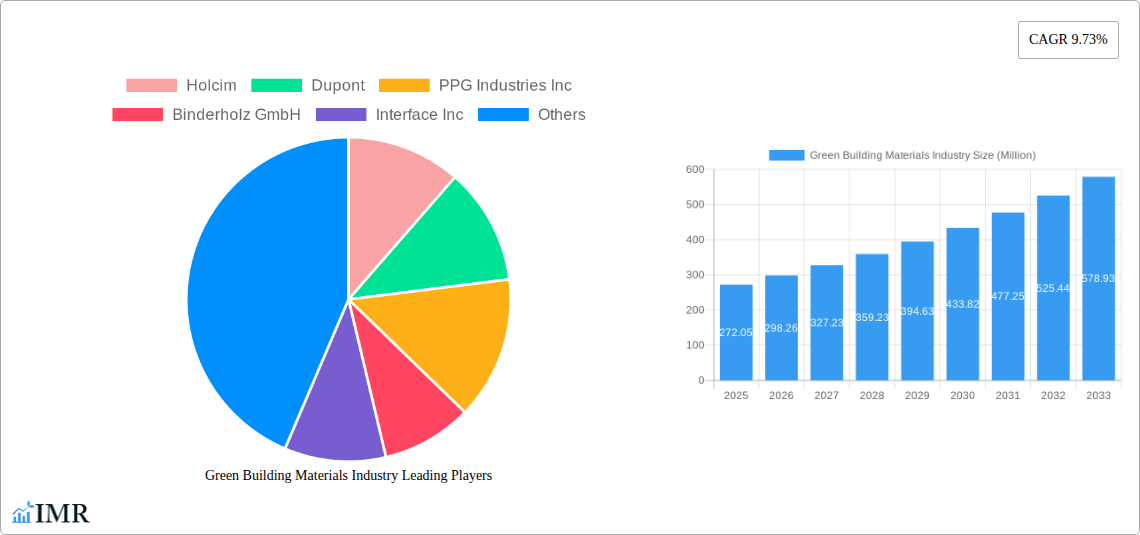
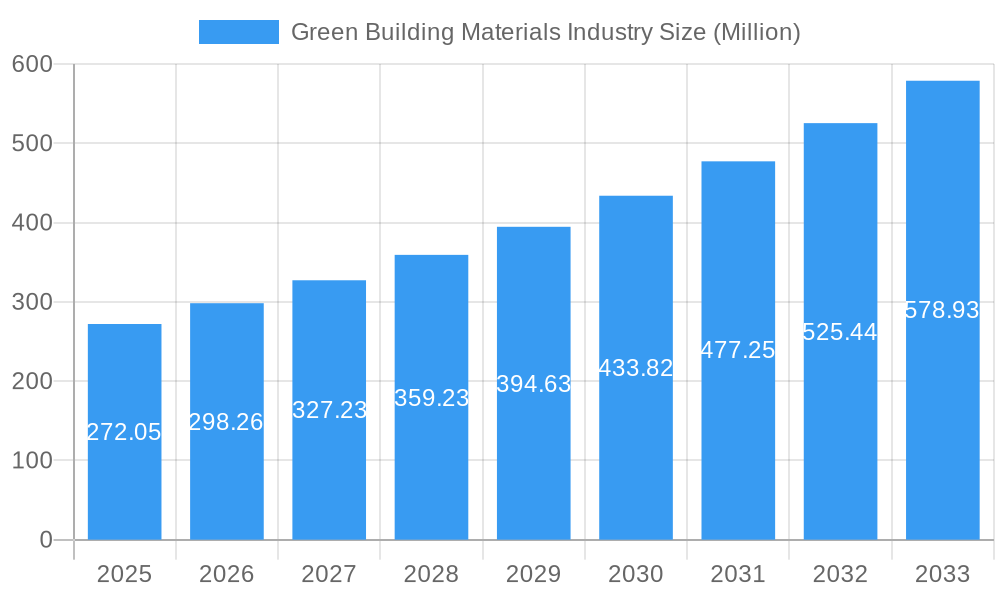
The global green building materials market, valued at $272.05 million in 2025, is experiencing robust growth, projected to expand at a compound annual growth rate (CAGR) of 9.73% from 2025 to 2033. This surge is driven by several key factors. Increasing environmental awareness among consumers and businesses is fueling demand for sustainable construction solutions. Stringent government regulations aimed at reducing carbon emissions and promoting energy efficiency in buildings are further accelerating market expansion. Furthermore, the growing adoption of sustainable building practices, coupled with advancements in green material technology leading to improved performance and cost-effectiveness, are contributing significantly to market growth. Key application segments include framing, insulation, roofing, and exterior/interior finishing, with residential, commercial, and industrial end-use sectors driving demand. Major players like Holcim, DuPont, and Owens Corning are leading innovation and market penetration. Geographical expansion is another contributing factor; Asia-Pacific, particularly China and India, present significant growth opportunities due to rapid urbanization and infrastructure development. However, the high initial cost of some green building materials and limited availability in certain regions pose challenges to widespread adoption. Despite these restraints, the long-term outlook for the green building materials market remains extremely positive, fueled by ongoing technological advancements, supportive government policies, and a growing global commitment to sustainability.
Green Building Materials Industry Market Size (In Million)
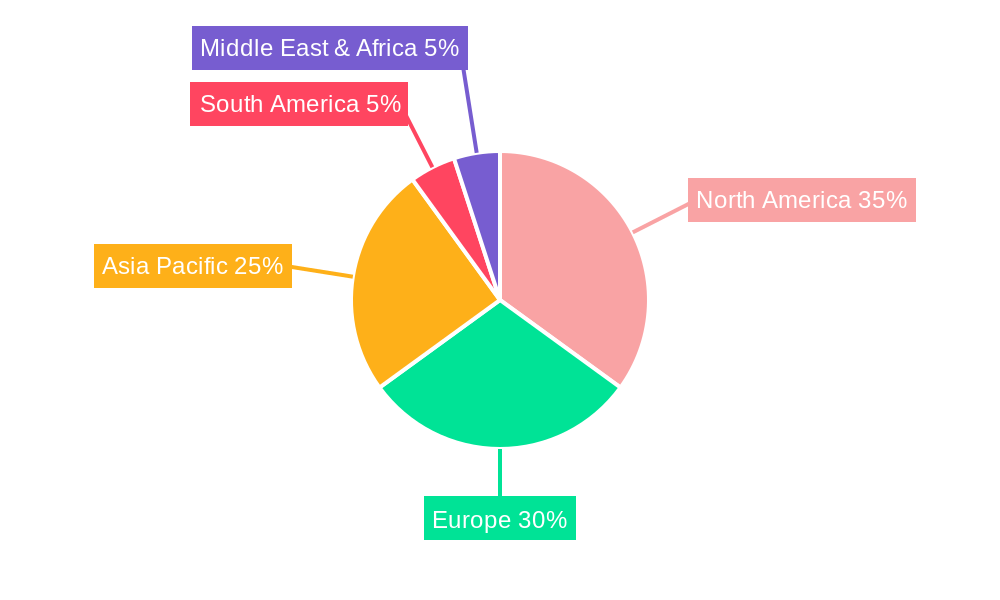
The market segmentation reveals diverse growth patterns across regions and applications. North America and Europe are currently leading the market, but the Asia-Pacific region is expected to witness the most rapid growth in the coming years. Within applications, insulation materials are experiencing significant demand due to their energy efficiency benefits, while the roofing and framing segments are also exhibiting substantial growth. The competitive landscape features both large multinational corporations and specialized manufacturers, indicating a dynamic and innovative market. The industry is likely to see further consolidation and strategic partnerships in the future as companies strive to expand their market share and capitalize on emerging opportunities. Ongoing research and development focused on enhancing the performance and reducing the cost of green building materials will be pivotal to accelerating market penetration and achieving broader adoption globally.
Green Building Materials Industry Company Market Share
Green Building Materials Industry Market Report: 2019-2033
This comprehensive report provides an in-depth analysis of the Green Building Materials industry, encompassing market dynamics, growth trends, regional dominance, product landscape, key players, and future outlook. The study period spans from 2019 to 2033, with 2025 serving as the base and estimated year. This report is crucial for industry professionals, investors, and stakeholders seeking to understand and capitalize on opportunities within this rapidly evolving sector.
Study Period: 2019-2033 Base Year: 2025 Estimated Year: 2025 Forecast Period: 2025-2033 Historical Period: 2019-2024
Green Building Materials Industry Market Dynamics & Structure
The green building materials market is experiencing significant growth driven by increasing environmental awareness, stringent government regulations, and a rising demand for sustainable construction solutions. Market concentration is moderate, with several large multinational players and a diverse range of smaller, specialized firms. Technological innovation, particularly in bio-based materials and advanced manufacturing processes, is a key driver. Regulatory frameworks, including building codes and environmental standards, play a significant role in shaping market demand. Competitive product substitutes, such as traditional building materials, face pressure from the growing appeal of eco-friendly alternatives. End-user demographics, including environmentally conscious consumers and businesses, are increasingly influencing purchasing decisions. Furthermore, mergers and acquisitions (M&A) activity is a prominent feature of the market landscape, with strategic acquisitions shaping market share and competition.
- Market Concentration: Moderate, with a mix of large multinationals and smaller players.
- Technological Innovation: Rapid advancements in bio-based materials and manufacturing.
- Regulatory Frameworks: Stringent environmental standards and building codes driving adoption.
- Competitive Substitutes: Traditional materials facing pressure from green alternatives.
- End-User Demographics: Growing demand from environmentally conscious consumers and businesses.
- M&A Activity: Significant M&A activity shaping market landscape (xx deals in the last 5 years, representing xx Million in value). Example: Holcim’s acquisition of Wiltshire Heavy Building Materials.
Green Building Materials Industry Growth Trends & Insights
The green building materials market is exhibiting robust growth, fueled by a confluence of factors. Market size has expanded significantly over the past five years, with a Compound Annual Growth Rate (CAGR) of xx% during the historical period (2019-2024) and a projected CAGR of xx% during the forecast period (2025-2033). Adoption rates are increasing across various end-use segments, driven by factors such as heightened environmental concerns, government incentives, and cost-effectiveness in the long run. Technological disruptions, such as the introduction of innovative materials and construction techniques, are further accelerating market expansion. Consumer behavior shifts toward sustainable and eco-friendly products are also fueling demand. The market size is expected to reach xx Million by 2033. Market penetration is increasing across all major segments, with the highest penetration observed in the residential sector.
Dominant Regions, Countries, or Segments in Green Building Materials Industry
North America and Europe currently dominate the green building materials market, driven by strong environmental regulations, substantial investments in green infrastructure, and high consumer awareness. Within these regions, specific countries like the United States, Germany, and the United Kingdom show particularly high market share and growth potential. Among application segments, Insulation and Roofing are leading the way, followed closely by Exterior Siding. The Residential end-use industry demonstrates the strongest growth, reflecting increased adoption of green building practices in new home construction and renovations.
- Leading Regions: North America and Europe.
- Key Countries: United States, Germany, United Kingdom.
- Dominant Application Segments: Insulation (xx Million), Roofing (xx Million), Exterior Siding (xx Million).
- Leading End-Use Industry: Residential (xx Million).
- Growth Drivers: Stringent environmental regulations, government incentives, increasing consumer awareness.
Green Building Materials Industry Product Landscape
The green building materials market features a diverse range of products, including recycled content materials, bio-based materials (e.g., bamboo, hemp), and sustainably sourced timber. These products offer superior insulation, durability, and aesthetic appeal, often exceeding the performance of traditional alternatives. Technological advancements in material science and manufacturing processes are constantly improving product properties, leading to enhanced performance metrics. The unique selling propositions are focused on environmental friendliness, improved energy efficiency, and reduced carbon footprint.
Key Drivers, Barriers & Challenges in Green Building Materials Industry
Key Drivers:
- Increasing environmental concerns and regulations.
- Growing demand for sustainable construction.
- Technological advancements in green building materials.
- Government incentives and subsidies.
Challenges:
- Higher initial costs compared to traditional materials.
- Supply chain limitations and logistical complexities.
- Lack of standardization and certification across different products.
- Competition from traditional materials. This results in a xx% reduction in market share for green materials against traditional materials in 2024.
Emerging Opportunities in Green Building Materials Industry
- Growing demand for sustainable infrastructure projects.
- Expansion into emerging markets with rising construction activity.
- Development of innovative green building materials with enhanced performance.
- Increased focus on circular economy principles and material reuse.
Growth Accelerators in the Green Building Materials Industry
Technological breakthroughs, particularly in bio-based materials and advanced manufacturing, are driving rapid innovation in green building materials. Strategic partnerships between material suppliers, construction companies, and research institutions are fostering collaborative efforts to develop and implement sustainable building solutions. Market expansion strategies, targeting emerging economies with high growth potential, are also contributing to long-term industry growth.
Key Players Shaping the Green Building Materials Industry Market
- Holcim
- Dupont
- PPG Industries Inc
- Binderholz GmbH
- Interface Inc
- Owens Corning
- Kingspan Group
- BASF SE
- Soben International (Asia-Pacific) Ltd
- Saint- Gobain (Certainteed)
- Sika AG
Notable Milestones in Green Building Materials Industry Sector
- October 2022: Holcim acquired Wiltshire Heavy Building Materials, strengthening its UK market position.
- August 2022: Saint-Gobain acquired Kaycan, expanding its North American siding market leadership.
- January 2022: Binderholz GmbH acquired BSW Timber Ltd, becoming Europe's largest sawmill company.
In-Depth Green Building Materials Industry Market Outlook
The green building materials market is poised for continued robust growth, driven by sustained demand for sustainable construction solutions and ongoing technological advancements. Strategic opportunities exist in developing innovative materials, expanding into emerging markets, and forging strategic partnerships to drive market penetration and long-term growth. The market is predicted to experience a significant expansion in the coming decade, offering considerable potential for investors and industry players alike.
Green Building Materials Industry Segmentation
-
1. Application
- 1.1. Framing
- 1.2. Insulation
- 1.3. Roofing
- 1.4. Exterior Siding
- 1.5. Interior Finishing
- 1.6. Other Applications
-
2. End-use Industry
- 2.1. Residential
- 2.2. Commercial
- 2.3. Industrial and Institutional
- 2.4. Infrastructure
Green Building Materials Industry Segmentation By Geography
-
1. Asia Pacific
- 1.1. China
- 1.2. India
- 1.3. Japan
- 1.4. South Korea
- 1.5. Rest of Asia Pacific
-
2. North America
- 2.1. United States
- 2.2. Canada
- 2.3. Mexico
-
3. Europe
- 3.1. Germany
- 3.2. United Kingdom
- 3.3. Italy
- 3.4. France
- 3.5. Rest of Europe
-
4. South America
- 4.1. Brazil
- 4.2. Argentina
- 4.3. Rest of South America
- 5. Middle East
-
6. Saudi Arabia
- 6.1. South Africa
- 6.2. Rest of Middle East
Green Building Materials Industry Regional Market Share
Geographic Coverage of Green Building Materials Industry
Green Building Materials Industry REPORT HIGHLIGHTS
| Aspects | Details |
|---|---|
| Study Period | 2020-2034 |
| Base Year | 2025 |
| Estimated Year | 2026 |
| Forecast Period | 2026-2034 |
| Historical Period | 2020-2025 |
| Growth Rate | CAGR of 9.73% from 2020-2034 |
| Segmentation |
|
Table of Contents
- 1. Introduction
- 1.1. Research Scope
- 1.2. Market Segmentation
- 1.3. Research Objective
- 1.4. Definitions and Assumptions
- 2. Executive Summary
- 2.1. Market Snapshot
- 3. Market Dynamics
- 3.1. Market Drivers
- 3.2. Market Restrains
- 3.3. Market Trends
- 3.4. Market Opportunities
- 4. Market Factor Analysis
- 4.1. Porters Five Forces
- 4.1.1. Bargaining Power of Suppliers
- 4.1.2. Bargaining Power of Buyers
- 4.1.3. Threat of New Entrants
- 4.1.4. Threat of Substitutes
- 4.1.5. Competitive Rivalry
- 4.2. PESTEL analysis
- 4.3. BCG Analysis
- 4.3.1. Stars (High Growth, High Market Share)
- 4.3.2. Cash Cows (Low Growth, High Market Share)
- 4.3.3. Question Mark (High Growth, Low Market Share)
- 4.3.4. Dogs (Low Growth, Low Market Share)
- 4.4. Ansoff Matrix Analysis
- 4.5. Supply Chain Analysis
- 4.6. Regulatory Landscape
- 4.7. Current Market Potential and Opportunity Assessment (TAM–SAM–SOM Framework)
- 4.8. IMR Analyst Note
- 4.1. Porters Five Forces
- 5. Market Analysis, Insights and Forecast 2021-2033
- 5.1. Market Analysis, Insights and Forecast - by Application
- 5.1.1. Framing
- 5.1.2. Insulation
- 5.1.3. Roofing
- 5.1.4. Exterior Siding
- 5.1.5. Interior Finishing
- 5.1.6. Other Applications
- 5.2. Market Analysis, Insights and Forecast - by End-use Industry
- 5.2.1. Residential
- 5.2.2. Commercial
- 5.2.3. Industrial and Institutional
- 5.2.4. Infrastructure
- 5.3. Market Analysis, Insights and Forecast - by Region
- 5.3.1. Asia Pacific
- 5.3.2. North America
- 5.3.3. Europe
- 5.3.4. South America
- 5.3.5. Middle East
- 5.3.6. Saudi Arabia
- 5.1. Market Analysis, Insights and Forecast - by Application
- 6. Global Green Building Materials Industry Analysis, Insights and Forecast, 2021-2033
- 6.1. Market Analysis, Insights and Forecast - by Application
- 6.1.1. Framing
- 6.1.2. Insulation
- 6.1.3. Roofing
- 6.1.4. Exterior Siding
- 6.1.5. Interior Finishing
- 6.1.6. Other Applications
- 6.2. Market Analysis, Insights and Forecast - by End-use Industry
- 6.2.1. Residential
- 6.2.2. Commercial
- 6.2.3. Industrial and Institutional
- 6.2.4. Infrastructure
- 6.1. Market Analysis, Insights and Forecast - by Application
- 7. Asia Pacific Green Building Materials Industry Analysis, Insights and Forecast, 2020-2032
- 7.1. Market Analysis, Insights and Forecast - by Application
- 7.1.1. Framing
- 7.1.2. Insulation
- 7.1.3. Roofing
- 7.1.4. Exterior Siding
- 7.1.5. Interior Finishing
- 7.1.6. Other Applications
- 7.2. Market Analysis, Insights and Forecast - by End-use Industry
- 7.2.1. Residential
- 7.2.2. Commercial
- 7.2.3. Industrial and Institutional
- 7.2.4. Infrastructure
- 7.1. Market Analysis, Insights and Forecast - by Application
- 8. North America Green Building Materials Industry Analysis, Insights and Forecast, 2020-2032
- 8.1. Market Analysis, Insights and Forecast - by Application
- 8.1.1. Framing
- 8.1.2. Insulation
- 8.1.3. Roofing
- 8.1.4. Exterior Siding
- 8.1.5. Interior Finishing
- 8.1.6. Other Applications
- 8.2. Market Analysis, Insights and Forecast - by End-use Industry
- 8.2.1. Residential
- 8.2.2. Commercial
- 8.2.3. Industrial and Institutional
- 8.2.4. Infrastructure
- 8.1. Market Analysis, Insights and Forecast - by Application
- 9. Europe Green Building Materials Industry Analysis, Insights and Forecast, 2020-2032
- 9.1. Market Analysis, Insights and Forecast - by Application
- 9.1.1. Framing
- 9.1.2. Insulation
- 9.1.3. Roofing
- 9.1.4. Exterior Siding
- 9.1.5. Interior Finishing
- 9.1.6. Other Applications
- 9.2. Market Analysis, Insights and Forecast - by End-use Industry
- 9.2.1. Residential
- 9.2.2. Commercial
- 9.2.3. Industrial and Institutional
- 9.2.4. Infrastructure
- 9.1. Market Analysis, Insights and Forecast - by Application
- 10. South America Green Building Materials Industry Analysis, Insights and Forecast, 2020-2032
- 10.1. Market Analysis, Insights and Forecast - by Application
- 10.1.1. Framing
- 10.1.2. Insulation
- 10.1.3. Roofing
- 10.1.4. Exterior Siding
- 10.1.5. Interior Finishing
- 10.1.6. Other Applications
- 10.2. Market Analysis, Insights and Forecast - by End-use Industry
- 10.2.1. Residential
- 10.2.2. Commercial
- 10.2.3. Industrial and Institutional
- 10.2.4. Infrastructure
- 10.1. Market Analysis, Insights and Forecast - by Application
- 11. Middle East Green Building Materials Industry Analysis, Insights and Forecast, 2020-2032
- 11.1. Market Analysis, Insights and Forecast - by Application
- 11.1.1. Framing
- 11.1.2. Insulation
- 11.1.3. Roofing
- 11.1.4. Exterior Siding
- 11.1.5. Interior Finishing
- 11.1.6. Other Applications
- 11.2. Market Analysis, Insights and Forecast - by End-use Industry
- 11.2.1. Residential
- 11.2.2. Commercial
- 11.2.3. Industrial and Institutional
- 11.2.4. Infrastructure
- 11.1. Market Analysis, Insights and Forecast - by Application
- 12. Saudi Arabia Green Building Materials Industry Analysis, Insights and Forecast, 2020-2032
- 12.1. Market Analysis, Insights and Forecast - by Application
- 12.1.1. Framing
- 12.1.2. Insulation
- 12.1.3. Roofing
- 12.1.4. Exterior Siding
- 12.1.5. Interior Finishing
- 12.1.6. Other Applications
- 12.2. Market Analysis, Insights and Forecast - by End-use Industry
- 12.2.1. Residential
- 12.2.2. Commercial
- 12.2.3. Industrial and Institutional
- 12.2.4. Infrastructure
- 12.1. Market Analysis, Insights and Forecast - by Application
- 13. Competitive Analysis
- 13.1. Company Profiles
- 13.1.1 Holcim
- 13.1.1.1. Company Overview
- 13.1.1.2. Products
- 13.1.1.3. Company Financials
- 13.1.1.4. SWOT Analysis
- 13.1.2 Dupont
- 13.1.2.1. Company Overview
- 13.1.2.2. Products
- 13.1.2.3. Company Financials
- 13.1.2.4. SWOT Analysis
- 13.1.3 PPG Industries Inc
- 13.1.3.1. Company Overview
- 13.1.3.2. Products
- 13.1.3.3. Company Financials
- 13.1.3.4. SWOT Analysis
- 13.1.4 Binderholz GmbH
- 13.1.4.1. Company Overview
- 13.1.4.2. Products
- 13.1.4.3. Company Financials
- 13.1.4.4. SWOT Analysis
- 13.1.5 Interface Inc
- 13.1.5.1. Company Overview
- 13.1.5.2. Products
- 13.1.5.3. Company Financials
- 13.1.5.4. SWOT Analysis
- 13.1.6 Owens Corning
- 13.1.6.1. Company Overview
- 13.1.6.2. Products
- 13.1.6.3. Company Financials
- 13.1.6.4. SWOT Analysis
- 13.1.7 Kingspan Group
- 13.1.7.1. Company Overview
- 13.1.7.2. Products
- 13.1.7.3. Company Financials
- 13.1.7.4. SWOT Analysis
- 13.1.8 BASF SE
- 13.1.8.1. Company Overview
- 13.1.8.2. Products
- 13.1.8.3. Company Financials
- 13.1.8.4. SWOT Analysis
- 13.1.9 Soben International (Asia-Pacific) Ltd*List Not Exhaustive
- 13.1.9.1. Company Overview
- 13.1.9.2. Products
- 13.1.9.3. Company Financials
- 13.1.9.4. SWOT Analysis
- 13.1.10 Saint- Gobain (Certainteed)
- 13.1.10.1. Company Overview
- 13.1.10.2. Products
- 13.1.10.3. Company Financials
- 13.1.10.4. SWOT Analysis
- 13.1.11 Sika AG
- 13.1.11.1. Company Overview
- 13.1.11.2. Products
- 13.1.11.3. Company Financials
- 13.1.11.4. SWOT Analysis
- 13.1.1 Holcim
- 13.2. Market Entropy
- 13.2.1 Company's Key Areas Served
- 13.2.2 Recent Developments
- 13.3. Company Market Share Analysis 2025
- 13.3.1 Top 5 Companies Market Share Analysis
- 13.3.2 Top 3 Companies Market Share Analysis
- 13.4. List of Potential Customers
- 14. Research Methodology
List of Figures
- Figure 1: Global Green Building Materials Industry Revenue Breakdown (Million, %) by Region 2025 & 2033
- Figure 2: Asia Pacific Green Building Materials Industry Revenue (Million), by Application 2025 & 2033
- Figure 3: Asia Pacific Green Building Materials Industry Revenue Share (%), by Application 2025 & 2033
- Figure 4: Asia Pacific Green Building Materials Industry Revenue (Million), by End-use Industry 2025 & 2033
- Figure 5: Asia Pacific Green Building Materials Industry Revenue Share (%), by End-use Industry 2025 & 2033
- Figure 6: Asia Pacific Green Building Materials Industry Revenue (Million), by Country 2025 & 2033
- Figure 7: Asia Pacific Green Building Materials Industry Revenue Share (%), by Country 2025 & 2033
- Figure 8: North America Green Building Materials Industry Revenue (Million), by Application 2025 & 2033
- Figure 9: North America Green Building Materials Industry Revenue Share (%), by Application 2025 & 2033
- Figure 10: North America Green Building Materials Industry Revenue (Million), by End-use Industry 2025 & 2033
- Figure 11: North America Green Building Materials Industry Revenue Share (%), by End-use Industry 2025 & 2033
- Figure 12: North America Green Building Materials Industry Revenue (Million), by Country 2025 & 2033
- Figure 13: North America Green Building Materials Industry Revenue Share (%), by Country 2025 & 2033
- Figure 14: Europe Green Building Materials Industry Revenue (Million), by Application 2025 & 2033
- Figure 15: Europe Green Building Materials Industry Revenue Share (%), by Application 2025 & 2033
- Figure 16: Europe Green Building Materials Industry Revenue (Million), by End-use Industry 2025 & 2033
- Figure 17: Europe Green Building Materials Industry Revenue Share (%), by End-use Industry 2025 & 2033
- Figure 18: Europe Green Building Materials Industry Revenue (Million), by Country 2025 & 2033
- Figure 19: Europe Green Building Materials Industry Revenue Share (%), by Country 2025 & 2033
- Figure 20: South America Green Building Materials Industry Revenue (Million), by Application 2025 & 2033
- Figure 21: South America Green Building Materials Industry Revenue Share (%), by Application 2025 & 2033
- Figure 22: South America Green Building Materials Industry Revenue (Million), by End-use Industry 2025 & 2033
- Figure 23: South America Green Building Materials Industry Revenue Share (%), by End-use Industry 2025 & 2033
- Figure 24: South America Green Building Materials Industry Revenue (Million), by Country 2025 & 2033
- Figure 25: South America Green Building Materials Industry Revenue Share (%), by Country 2025 & 2033
- Figure 26: Middle East Green Building Materials Industry Revenue (Million), by Application 2025 & 2033
- Figure 27: Middle East Green Building Materials Industry Revenue Share (%), by Application 2025 & 2033
- Figure 28: Middle East Green Building Materials Industry Revenue (Million), by End-use Industry 2025 & 2033
- Figure 29: Middle East Green Building Materials Industry Revenue Share (%), by End-use Industry 2025 & 2033
- Figure 30: Middle East Green Building Materials Industry Revenue (Million), by Country 2025 & 2033
- Figure 31: Middle East Green Building Materials Industry Revenue Share (%), by Country 2025 & 2033
- Figure 32: Saudi Arabia Green Building Materials Industry Revenue (Million), by Application 2025 & 2033
- Figure 33: Saudi Arabia Green Building Materials Industry Revenue Share (%), by Application 2025 & 2033
- Figure 34: Saudi Arabia Green Building Materials Industry Revenue (Million), by End-use Industry 2025 & 2033
- Figure 35: Saudi Arabia Green Building Materials Industry Revenue Share (%), by End-use Industry 2025 & 2033
- Figure 36: Saudi Arabia Green Building Materials Industry Revenue (Million), by Country 2025 & 2033
- Figure 37: Saudi Arabia Green Building Materials Industry Revenue Share (%), by Country 2025 & 2033
List of Tables
- Table 1: Global Green Building Materials Industry Revenue Million Forecast, by Application 2020 & 2033
- Table 2: Global Green Building Materials Industry Revenue Million Forecast, by End-use Industry 2020 & 2033
- Table 3: Global Green Building Materials Industry Revenue Million Forecast, by Region 2020 & 2033
- Table 4: Global Green Building Materials Industry Revenue Million Forecast, by Application 2020 & 2033
- Table 5: Global Green Building Materials Industry Revenue Million Forecast, by End-use Industry 2020 & 2033
- Table 6: Global Green Building Materials Industry Revenue Million Forecast, by Country 2020 & 2033
- Table 7: China Green Building Materials Industry Revenue (Million) Forecast, by Application 2020 & 2033
- Table 8: India Green Building Materials Industry Revenue (Million) Forecast, by Application 2020 & 2033
- Table 9: Japan Green Building Materials Industry Revenue (Million) Forecast, by Application 2020 & 2033
- Table 10: South Korea Green Building Materials Industry Revenue (Million) Forecast, by Application 2020 & 2033
- Table 11: Rest of Asia Pacific Green Building Materials Industry Revenue (Million) Forecast, by Application 2020 & 2033
- Table 12: Global Green Building Materials Industry Revenue Million Forecast, by Application 2020 & 2033
- Table 13: Global Green Building Materials Industry Revenue Million Forecast, by End-use Industry 2020 & 2033
- Table 14: Global Green Building Materials Industry Revenue Million Forecast, by Country 2020 & 2033
- Table 15: United States Green Building Materials Industry Revenue (Million) Forecast, by Application 2020 & 2033
- Table 16: Canada Green Building Materials Industry Revenue (Million) Forecast, by Application 2020 & 2033
- Table 17: Mexico Green Building Materials Industry Revenue (Million) Forecast, by Application 2020 & 2033
- Table 18: Global Green Building Materials Industry Revenue Million Forecast, by Application 2020 & 2033
- Table 19: Global Green Building Materials Industry Revenue Million Forecast, by End-use Industry 2020 & 2033
- Table 20: Global Green Building Materials Industry Revenue Million Forecast, by Country 2020 & 2033
- Table 21: Germany Green Building Materials Industry Revenue (Million) Forecast, by Application 2020 & 2033
- Table 22: United Kingdom Green Building Materials Industry Revenue (Million) Forecast, by Application 2020 & 2033
- Table 23: Italy Green Building Materials Industry Revenue (Million) Forecast, by Application 2020 & 2033
- Table 24: France Green Building Materials Industry Revenue (Million) Forecast, by Application 2020 & 2033
- Table 25: Rest of Europe Green Building Materials Industry Revenue (Million) Forecast, by Application 2020 & 2033
- Table 26: Global Green Building Materials Industry Revenue Million Forecast, by Application 2020 & 2033
- Table 27: Global Green Building Materials Industry Revenue Million Forecast, by End-use Industry 2020 & 2033
- Table 28: Global Green Building Materials Industry Revenue Million Forecast, by Country 2020 & 2033
- Table 29: Brazil Green Building Materials Industry Revenue (Million) Forecast, by Application 2020 & 2033
- Table 30: Argentina Green Building Materials Industry Revenue (Million) Forecast, by Application 2020 & 2033
- Table 31: Rest of South America Green Building Materials Industry Revenue (Million) Forecast, by Application 2020 & 2033
- Table 32: Global Green Building Materials Industry Revenue Million Forecast, by Application 2020 & 2033
- Table 33: Global Green Building Materials Industry Revenue Million Forecast, by End-use Industry 2020 & 2033
- Table 34: Global Green Building Materials Industry Revenue Million Forecast, by Country 2020 & 2033
- Table 35: Global Green Building Materials Industry Revenue Million Forecast, by Application 2020 & 2033
- Table 36: Global Green Building Materials Industry Revenue Million Forecast, by End-use Industry 2020 & 2033
- Table 37: Global Green Building Materials Industry Revenue Million Forecast, by Country 2020 & 2033
- Table 38: South Africa Green Building Materials Industry Revenue (Million) Forecast, by Application 2020 & 2033
- Table 39: Rest of Middle East Green Building Materials Industry Revenue (Million) Forecast, by Application 2020 & 2033
Frequently Asked Questions
1. What is the projected Compound Annual Growth Rate (CAGR) of the Green Building Materials Industry?
The projected CAGR is approximately 9.73%.
2. Which companies are prominent players in the Green Building Materials Industry?
Key companies in the market include Holcim, Dupont, PPG Industries Inc, Binderholz GmbH, Interface Inc, Owens Corning, Kingspan Group, BASF SE, Soben International (Asia-Pacific) Ltd*List Not Exhaustive, Saint- Gobain (Certainteed), Sika AG.
3. What are the main segments of the Green Building Materials Industry?
The market segments include Application, End-use Industry.
4. Can you provide details about the market size?
The market size is estimated to be USD 272.05 Million as of 2022.
5. What are some drivers contributing to market growth?
Increasing Demand for Insulation and Energy-efficient Buildings; Favorable Government Policies for Green Buildings.
6. What are the notable trends driving market growth?
Increasing Consumption of Green Building Materials in the Residential End-use Industry.
7. Are there any restraints impacting market growth?
High Initial Capital Investment Compared to Conventional Buildings.
8. Can you provide examples of recent developments in the market?
October 2022: Holcim acquired Wiltshire Heavy Building Materials, one of the leading companies providing building solutions and material circularity in the United Kingdom. This acquisition will strengthen Holcim's market presence in the United Kingdom's green building materials market.
9. What pricing options are available for accessing the report?
Pricing options include single-user, multi-user, and enterprise licenses priced at USD 4750, USD 5250, and USD 8750 respectively.
10. Is the market size provided in terms of value or volume?
The market size is provided in terms of value, measured in Million.
11. Are there any specific market keywords associated with the report?
Yes, the market keyword associated with the report is "Green Building Materials Industry," which aids in identifying and referencing the specific market segment covered.
12. How do I determine which pricing option suits my needs best?
The pricing options vary based on user requirements and access needs. Individual users may opt for single-user licenses, while businesses requiring broader access may choose multi-user or enterprise licenses for cost-effective access to the report.
13. Are there any additional resources or data provided in the Green Building Materials Industry report?
While the report offers comprehensive insights, it's advisable to review the specific contents or supplementary materials provided to ascertain if additional resources or data are available.
14. How can I stay updated on further developments or reports in the Green Building Materials Industry?
To stay informed about further developments, trends, and reports in the Green Building Materials Industry, consider subscribing to industry newsletters, following relevant companies and organizations, or regularly checking reputable industry news sources and publications.
Methodology
Step 1 - Identification of Relevant Samples Size from Population Database


Step 2 - Approaches for Defining Global Market Size (Value, Volume* & Price*)

Note*: In applicable scenarios
Step 3 - Data Sources
Primary Research
- Web Analytics
- Survey Reports
- Research Institute
- Latest Research Reports
- Opinion Leaders
Secondary Research
- Annual Reports
- White Paper
- Latest Press Release
- Industry Association
- Paid Database
- Investor Presentations

Step 4 - Data Triangulation
Involves using different sources of information in order to increase the validity of a study
These sources are likely to be stakeholders in a program - participants, other researchers, program staff, other community members, and so on.
Then we put all data in single framework & apply various statistical tools to find out the dynamic on the market.
During the analysis stage, feedback from the stakeholder groups would be compared to determine areas of agreement as well as areas of divergence