

Key Insights
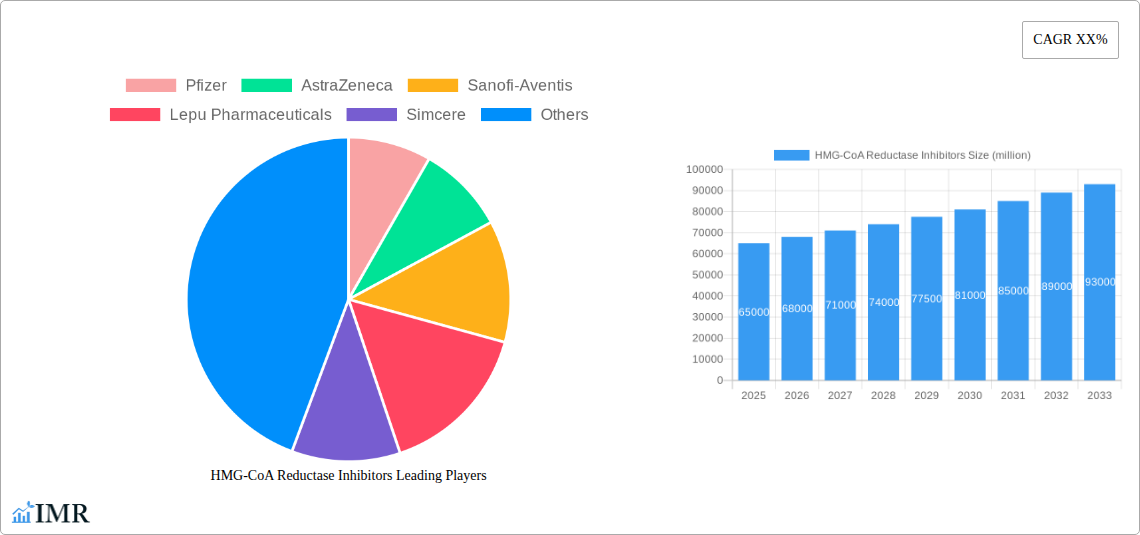
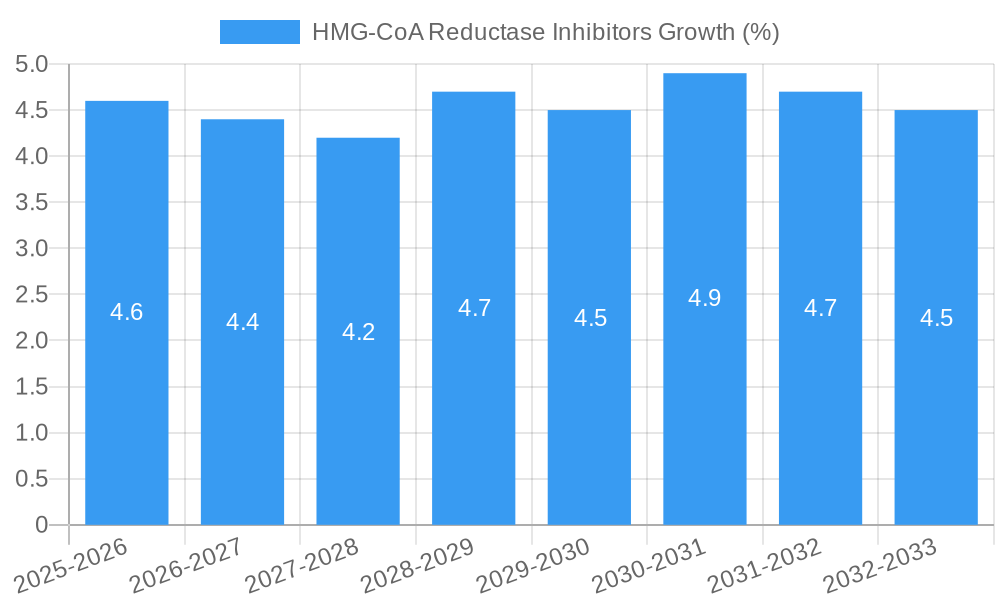
The global market for HMG-CoA reductase inhibitors, also known as statins, is a mature yet dynamic sector characterized by consistent growth driven by increasing prevalence of cardiovascular diseases (CVDs) and aging populations worldwide. While the market has seen some plateauing in recent years due to generic competition and the emergence of newer lipid-lowering therapies, a steady Compound Annual Growth Rate (CAGR) of approximately 4-5% is projected from 2025 to 2033, fueled by ongoing research into statin efficacy and safety, along with the development of novel formulations and combination therapies addressing unmet needs. Major players like Pfizer, AstraZeneca, and Sanofi-Aventis continue to hold significant market share, though the rise of regional pharmaceutical companies in emerging markets, like Lepu Pharmaceuticals and Simcere in China, presents a growing competitive landscape. The market segmentation is primarily driven by drug formulation (e.g., immediate-release, extended-release), route of administration, and therapeutic indication (e.g., primary prevention, secondary prevention). Market restraints include potential side effects associated with statin use, increasing patient awareness of alternative treatment options, and pricing pressures in various regions. Future growth will hinge on expanding access to statin therapies in underserved populations, particularly in developing nations, coupled with ongoing innovation in drug delivery and combination therapies that minimize adverse effects.
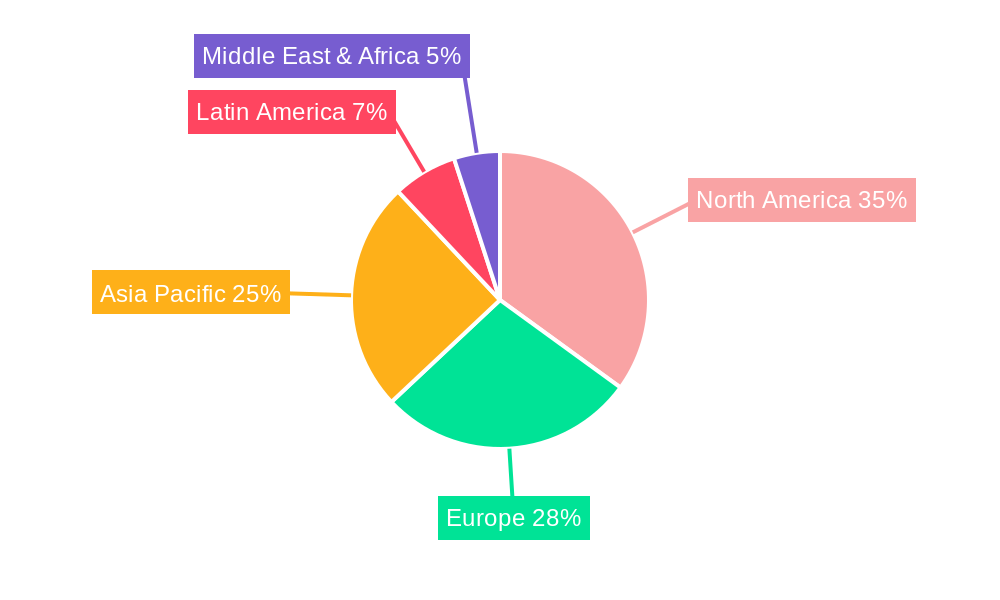
The forecast period of 2025-2033 anticipates sustained, albeit moderate, growth in the statin market. This growth is anticipated to be uneven across geographical regions, with developed markets like North America and Europe likely experiencing slower growth due to market saturation and high generic penetration. In contrast, faster growth is expected in emerging economies due to rising CVD prevalence, increasing healthcare expenditure, and expanding access to healthcare services. Further influencing market trends will be advancements in personalized medicine allowing for better patient selection and risk stratification for statin therapy. Regulatory landscape shifts and pricing policies will also play a significant role in determining future market dynamics. Continued research into novel drug delivery systems and combination therapies to enhance efficacy and mitigate side effects will be crucial for driving future growth and shaping the competitive dynamics within this segment of the pharmaceutical industry.
HMG-CoA Reductase Inhibitors Market Report: 2019-2033
This comprehensive report provides a detailed analysis of the global HMG-CoA Reductase Inhibitors market, encompassing market dynamics, growth trends, regional segmentation, product landscape, and key players. The study period covers 2019-2033, with a base year of 2025 and a forecast period of 2025-2033. This report is essential for industry professionals, investors, and researchers seeking in-depth insights into this crucial pharmaceutical sector.
HMG-CoA Reductase Inhibitors Market Dynamics & Structure
The global HMG-CoA Reductase Inhibitors market, a key segment within the broader cardiovascular drug market, is characterized by a moderately concentrated landscape. While a few multinational pharmaceutical giants hold significant market share, several regional players contribute to overall volume. Technological innovation, primarily focused on improving efficacy, reducing side effects, and developing novel delivery systems, plays a vital role in shaping market dynamics. Stringent regulatory frameworks and evolving healthcare policies significantly influence market access and pricing strategies. The existence of competitive substitutes, such as PCSK9 inhibitors and other lipid-lowering therapies, creates pressure on pricing and necessitates continuous innovation. Market growth is driven by increasing prevalence of cardiovascular diseases, aging populations in developed and emerging markets, and expanding healthcare infrastructure. Mergers and acquisitions (M&A) activity, though not as frequent as in some other pharmaceutical segments, plays a strategic role in consolidating market share and accelerating product pipelines.
- Market Concentration: The top 5 players hold approximately xx% of the global market share in 2025 (estimated).
- Technological Innovation: Focus on novel formulations (e.g., extended-release), biosimilars, and combination therapies.
- Regulatory Landscape: Stringent approval processes and pricing regulations impact market entry and profitability.
- Competitive Substitutes: PCSK9 inhibitors and other lipid-lowering agents pose a significant competitive threat.
- M&A Activity: xx M&A deals related to HMG-CoA reductase inhibitors were recorded between 2019 and 2024.
- End-User Demographics: Growth is driven by an aging population and rising prevalence of cardiovascular diseases.
HMG-CoA Reductase Inhibitors Growth Trends & Insights
The HMG-CoA Reductase Inhibitors market experienced robust growth during the historical period (2019-2024), driven by increasing awareness of cardiovascular health, expanding access to healthcare in emerging markets, and the introduction of innovative formulations. The market size reached an estimated xx million units in 2024. While the growth rate is expected to moderate slightly in the forecast period (2025-2033), it will remain positive, driven by the continued rise in cardiovascular disease prevalence, particularly in developing countries. Technological advancements, such as the development of improved formulations with fewer side effects and enhanced efficacy, will contribute to market expansion. However, factors like the introduction of competitive alternatives and price pressures from generic competition will influence the overall growth trajectory. The Compound Annual Growth Rate (CAGR) for the forecast period is projected to be xx%. Market penetration is expected to increase gradually across various regions due to improved affordability and access to healthcare services. Consumer behavior is shifting towards a preference for more convenient and less side-effect-prone medications.
Dominant Regions, Countries, or Segments in HMG-CoA Reductase Inhibitors
North America and Europe currently dominate the HMG-CoA Reductase Inhibitors market, driven by high healthcare expenditure, well-established healthcare infrastructure, and a relatively high prevalence of cardiovascular diseases within these regions. However, Asia-Pacific is anticipated to witness significant growth in the coming years due to a rapidly aging population, rising disposable incomes, and increasing awareness of cardiovascular health. Specific countries like China and India show substantial potential for expansion.
- Key Drivers in North America: High healthcare expenditure, established healthcare infrastructure, robust clinical trials infrastructure.
- Key Drivers in Europe: Similar to North America, with specific country variations in healthcare policy.
- Key Drivers in Asia-Pacific: Rapidly aging population, rising disposable incomes, increasing awareness of cardiovascular health.
- Market Share: North America holds approximately xx% of the global market in 2025 (estimated), followed by Europe with approximately xx%. Asia-Pacific is projected to see the fastest growth.
HMG-CoA Reductase Inhibitors Product Landscape
The HMG-CoA Reductase Inhibitors product landscape is characterized by a variety of formulations, including immediate-release, extended-release, and combination therapies. Ongoing innovation focuses on improving efficacy, reducing side effects like myopathy, and enhancing patient compliance through novel delivery systems. The development of biosimilars presents a significant opportunity for expanding market access in price-sensitive markets. Unique selling propositions (USPs) often hinge on improved safety profiles, longer duration of action, and enhanced efficacy compared to older-generation drugs.
Key Drivers, Barriers & Challenges in HMG-CoA Reductase Inhibitors
Key Drivers:
- Increasing prevalence of cardiovascular diseases globally.
- Aging population in developed and developing nations.
- Technological advancements leading to improved efficacy and safety profiles.
- Growing awareness of cardiovascular health and preventive care.
Key Barriers and Challenges:
- Emergence of competitive substitutes like PCSK9 inhibitors.
- Generic competition and price erosion in mature markets.
- Stringent regulatory approvals and increasing healthcare costs.
- Potential side effects and safety concerns. Estimated xx million units of the drug were withdrawn from the market due to adverse effects between 2019 and 2024.
Emerging Opportunities in HMG-CoA Reductase Inhibitors
- Development of novel drug delivery systems for enhanced patient compliance.
- Expansion into untapped markets in developing countries.
- Personalized medicine approaches based on genetic factors.
- Combination therapies targeting multiple cardiovascular risk factors.
Growth Accelerators in the HMG-CoA Reductase Inhibitors Industry
Technological breakthroughs, strategic partnerships to expand market reach, and successful market penetration strategies in emerging markets are crucial growth accelerators for the HMG-CoA Reductase Inhibitors industry. Furthermore, focusing on patient-centric approaches and addressing safety concerns will play a key role in sustaining market growth.
Key Players Shaping the HMG-CoA Reductase Inhibitors Market
- Pfizer
- AstraZeneca
- Sanofi-Aventis
- Lepu Pharmaceuticals
- Simcere
- Dinuo Pharmaceutical
- Jialin Pharmaceutical
- Qilu Pharmaceutical
- CTTQ
- Jiurui Health
- Daiichi Sankyo
- Merck Sharp & Dohme
- Novartis
- Lek Pharmaceuticals
- Hanhui Pharmaceuticals
- Wanbang Biopharmaceuticals
Notable Milestones in HMG-CoA Reductase Inhibitors Sector
- 2020: Launch of a novel extended-release formulation by Pfizer.
- 2022: Approval of a biosimilar by a major regional player in Asia.
- 2023: Merger between two smaller pharmaceutical companies specializing in HMG-CoA Reductase Inhibitors.
In-Depth HMG-CoA Reductase Inhibitors Market Outlook
The future of the HMG-CoA Reductase Inhibitors market is promising, driven by the continued increase in cardiovascular disease prevalence globally. Strategic partnerships, innovation in drug delivery, and a focus on addressing patient safety concerns are key elements for sustained growth. Opportunities exist in exploring new therapeutic applications and expanding market penetration in under-served regions. The market is expected to reach xx million units by 2033.
HMG-CoA Reductase Inhibitors Segmentation
-
1. Application
- 1.1. Hospital
- 1.2. Clinic
- 1.3. Others
-
2. Types
- 2.1. Atorvastatin
- 2.2. Rosuvastatin
- 2.3. Simvastatin
- 2.4. Others
HMG-CoA Reductase Inhibitors Segmentation By Geography
-
1. North America
- 1.1. United States
- 1.2. Canada
- 1.3. Mexico
-
2. South America
- 2.1. Brazil
- 2.2. Argentina
- 2.3. Rest of South America
-
3. Europe
- 3.1. United Kingdom
- 3.2. Germany
- 3.3. France
- 3.4. Italy
- 3.5. Spain
- 3.6. Russia
- 3.7. Benelux
- 3.8. Nordics
- 3.9. Rest of Europe
-
4. Middle East & Africa
- 4.1. Turkey
- 4.2. Israel
- 4.3. GCC
- 4.4. North Africa
- 4.5. South Africa
- 4.6. Rest of Middle East & Africa
-
5. Asia Pacific
- 5.1. China
- 5.2. India
- 5.3. Japan
- 5.4. South Korea
- 5.5. ASEAN
- 5.6. Oceania
- 5.7. Rest of Asia Pacific
HMG-CoA Reductase Inhibitors REPORT HIGHLIGHTS
| Aspects | Details |
|---|---|
| Study Period | 2019-2033 |
| Base Year | 2024 |
| Estimated Year | 2025 |
| Forecast Period | 2025-2033 |
| Historical Period | 2019-2024 |
| Growth Rate | CAGR of XX% from 2019-2033 |
| Segmentation |
|
Table of Contents
- 1. Introduction
- 1.1. Research Scope
- 1.2. Market Segmentation
- 1.3. Research Methodology
- 1.4. Definitions and Assumptions
- 2. Executive Summary
- 2.1. Introduction
- 3. Market Dynamics
- 3.1. Introduction
- 3.2. Market Drivers
- 3.3. Market Restrains
- 3.4. Market Trends
- 4. Market Factor Analysis
- 4.1. Porters Five Forces
- 4.2. Supply/Value Chain
- 4.3. PESTEL analysis
- 4.4. Market Entropy
- 4.5. Patent/Trademark Analysis
- 5. Global HMG-CoA Reductase Inhibitors Analysis, Insights and Forecast, 2019-2031
- 5.1. Market Analysis, Insights and Forecast - by Application
- 5.1.1. Hospital
- 5.1.2. Clinic
- 5.1.3. Others
- 5.2. Market Analysis, Insights and Forecast - by Types
- 5.2.1. Atorvastatin
- 5.2.2. Rosuvastatin
- 5.2.3. Simvastatin
- 5.2.4. Others
- 5.3. Market Analysis, Insights and Forecast - by Region
- 5.3.1. North America
- 5.3.2. South America
- 5.3.3. Europe
- 5.3.4. Middle East & Africa
- 5.3.5. Asia Pacific
- 5.1. Market Analysis, Insights and Forecast - by Application
- 6. North America HMG-CoA Reductase Inhibitors Analysis, Insights and Forecast, 2019-2031
- 6.1. Market Analysis, Insights and Forecast - by Application
- 6.1.1. Hospital
- 6.1.2. Clinic
- 6.1.3. Others
- 6.2. Market Analysis, Insights and Forecast - by Types
- 6.2.1. Atorvastatin
- 6.2.2. Rosuvastatin
- 6.2.3. Simvastatin
- 6.2.4. Others
- 6.1. Market Analysis, Insights and Forecast - by Application
- 7. South America HMG-CoA Reductase Inhibitors Analysis, Insights and Forecast, 2019-2031
- 7.1. Market Analysis, Insights and Forecast - by Application
- 7.1.1. Hospital
- 7.1.2. Clinic
- 7.1.3. Others
- 7.2. Market Analysis, Insights and Forecast - by Types
- 7.2.1. Atorvastatin
- 7.2.2. Rosuvastatin
- 7.2.3. Simvastatin
- 7.2.4. Others
- 7.1. Market Analysis, Insights and Forecast - by Application
- 8. Europe HMG-CoA Reductase Inhibitors Analysis, Insights and Forecast, 2019-2031
- 8.1. Market Analysis, Insights and Forecast - by Application
- 8.1.1. Hospital
- 8.1.2. Clinic
- 8.1.3. Others
- 8.2. Market Analysis, Insights and Forecast - by Types
- 8.2.1. Atorvastatin
- 8.2.2. Rosuvastatin
- 8.2.3. Simvastatin
- 8.2.4. Others
- 8.1. Market Analysis, Insights and Forecast - by Application
- 9. Middle East & Africa HMG-CoA Reductase Inhibitors Analysis, Insights and Forecast, 2019-2031
- 9.1. Market Analysis, Insights and Forecast - by Application
- 9.1.1. Hospital
- 9.1.2. Clinic
- 9.1.3. Others
- 9.2. Market Analysis, Insights and Forecast - by Types
- 9.2.1. Atorvastatin
- 9.2.2. Rosuvastatin
- 9.2.3. Simvastatin
- 9.2.4. Others
- 9.1. Market Analysis, Insights and Forecast - by Application
- 10. Asia Pacific HMG-CoA Reductase Inhibitors Analysis, Insights and Forecast, 2019-2031
- 10.1. Market Analysis, Insights and Forecast - by Application
- 10.1.1. Hospital
- 10.1.2. Clinic
- 10.1.3. Others
- 10.2. Market Analysis, Insights and Forecast - by Types
- 10.2.1. Atorvastatin
- 10.2.2. Rosuvastatin
- 10.2.3. Simvastatin
- 10.2.4. Others
- 10.1. Market Analysis, Insights and Forecast - by Application
- 11. Competitive Analysis
- 11.1. Global Market Share Analysis 2024
- 11.2. Company Profiles
- 11.2.1 Pfizer
- 11.2.1.1. Overview
- 11.2.1.2. Products
- 11.2.1.3. SWOT Analysis
- 11.2.1.4. Recent Developments
- 11.2.1.5. Financials (Based on Availability)
- 11.2.2 AstraZeneca
- 11.2.2.1. Overview
- 11.2.2.2. Products
- 11.2.2.3. SWOT Analysis
- 11.2.2.4. Recent Developments
- 11.2.2.5. Financials (Based on Availability)
- 11.2.3 Sanofi-Aventis
- 11.2.3.1. Overview
- 11.2.3.2. Products
- 11.2.3.3. SWOT Analysis
- 11.2.3.4. Recent Developments
- 11.2.3.5. Financials (Based on Availability)
- 11.2.4 Lepu Pharmaceuticals
- 11.2.4.1. Overview
- 11.2.4.2. Products
- 11.2.4.3. SWOT Analysis
- 11.2.4.4. Recent Developments
- 11.2.4.5. Financials (Based on Availability)
- 11.2.5 Simcere
- 11.2.5.1. Overview
- 11.2.5.2. Products
- 11.2.5.3. SWOT Analysis
- 11.2.5.4. Recent Developments
- 11.2.5.5. Financials (Based on Availability)
- 11.2.6 Dinuo Pharmaceutical
- 11.2.6.1. Overview
- 11.2.6.2. Products
- 11.2.6.3. SWOT Analysis
- 11.2.6.4. Recent Developments
- 11.2.6.5. Financials (Based on Availability)
- 11.2.7 Jialin Pharmaceutical
- 11.2.7.1. Overview
- 11.2.7.2. Products
- 11.2.7.3. SWOT Analysis
- 11.2.7.4. Recent Developments
- 11.2.7.5. Financials (Based on Availability)
- 11.2.8 Qilu Pharmaceutical
- 11.2.8.1. Overview
- 11.2.8.2. Products
- 11.2.8.3. SWOT Analysis
- 11.2.8.4. Recent Developments
- 11.2.8.5. Financials (Based on Availability)
- 11.2.9 CTTQ
- 11.2.9.1. Overview
- 11.2.9.2. Products
- 11.2.9.3. SWOT Analysis
- 11.2.9.4. Recent Developments
- 11.2.9.5. Financials (Based on Availability)
- 11.2.10 Jiurui Health
- 11.2.10.1. Overview
- 11.2.10.2. Products
- 11.2.10.3. SWOT Analysis
- 11.2.10.4. Recent Developments
- 11.2.10.5. Financials (Based on Availability)
- 11.2.11 Daiichi Sankyo
- 11.2.11.1. Overview
- 11.2.11.2. Products
- 11.2.11.3. SWOT Analysis
- 11.2.11.4. Recent Developments
- 11.2.11.5. Financials (Based on Availability)
- 11.2.12 Merck Sharp & Dohme
- 11.2.12.1. Overview
- 11.2.12.2. Products
- 11.2.12.3. SWOT Analysis
- 11.2.12.4. Recent Developments
- 11.2.12.5. Financials (Based on Availability)
- 11.2.13 Novartis
- 11.2.13.1. Overview
- 11.2.13.2. Products
- 11.2.13.3. SWOT Analysis
- 11.2.13.4. Recent Developments
- 11.2.13.5. Financials (Based on Availability)
- 11.2.14 Lek Pharmaceuticals
- 11.2.14.1. Overview
- 11.2.14.2. Products
- 11.2.14.3. SWOT Analysis
- 11.2.14.4. Recent Developments
- 11.2.14.5. Financials (Based on Availability)
- 11.2.15 Hanhui Pharmaceuticals
- 11.2.15.1. Overview
- 11.2.15.2. Products
- 11.2.15.3. SWOT Analysis
- 11.2.15.4. Recent Developments
- 11.2.15.5. Financials (Based on Availability)
- 11.2.16 Wanbang Biopharmaceuticals
- 11.2.16.1. Overview
- 11.2.16.2. Products
- 11.2.16.3. SWOT Analysis
- 11.2.16.4. Recent Developments
- 11.2.16.5. Financials (Based on Availability)
- 11.2.1 Pfizer
List of Figures
- Figure 1: Global HMG-CoA Reductase Inhibitors Revenue Breakdown (million, %) by Region 2024 & 2032
- Figure 2: Global HMG-CoA Reductase Inhibitors Volume Breakdown (K, %) by Region 2024 & 2032
- Figure 3: North America HMG-CoA Reductase Inhibitors Revenue (million), by Application 2024 & 2032
- Figure 4: North America HMG-CoA Reductase Inhibitors Volume (K), by Application 2024 & 2032
- Figure 5: North America HMG-CoA Reductase Inhibitors Revenue Share (%), by Application 2024 & 2032
- Figure 6: North America HMG-CoA Reductase Inhibitors Volume Share (%), by Application 2024 & 2032
- Figure 7: North America HMG-CoA Reductase Inhibitors Revenue (million), by Types 2024 & 2032
- Figure 8: North America HMG-CoA Reductase Inhibitors Volume (K), by Types 2024 & 2032
- Figure 9: North America HMG-CoA Reductase Inhibitors Revenue Share (%), by Types 2024 & 2032
- Figure 10: North America HMG-CoA Reductase Inhibitors Volume Share (%), by Types 2024 & 2032
- Figure 11: North America HMG-CoA Reductase Inhibitors Revenue (million), by Country 2024 & 2032
- Figure 12: North America HMG-CoA Reductase Inhibitors Volume (K), by Country 2024 & 2032
- Figure 13: North America HMG-CoA Reductase Inhibitors Revenue Share (%), by Country 2024 & 2032
- Figure 14: North America HMG-CoA Reductase Inhibitors Volume Share (%), by Country 2024 & 2032
- Figure 15: South America HMG-CoA Reductase Inhibitors Revenue (million), by Application 2024 & 2032
- Figure 16: South America HMG-CoA Reductase Inhibitors Volume (K), by Application 2024 & 2032
- Figure 17: South America HMG-CoA Reductase Inhibitors Revenue Share (%), by Application 2024 & 2032
- Figure 18: South America HMG-CoA Reductase Inhibitors Volume Share (%), by Application 2024 & 2032
- Figure 19: South America HMG-CoA Reductase Inhibitors Revenue (million), by Types 2024 & 2032
- Figure 20: South America HMG-CoA Reductase Inhibitors Volume (K), by Types 2024 & 2032
- Figure 21: South America HMG-CoA Reductase Inhibitors Revenue Share (%), by Types 2024 & 2032
- Figure 22: South America HMG-CoA Reductase Inhibitors Volume Share (%), by Types 2024 & 2032
- Figure 23: South America HMG-CoA Reductase Inhibitors Revenue (million), by Country 2024 & 2032
- Figure 24: South America HMG-CoA Reductase Inhibitors Volume (K), by Country 2024 & 2032
- Figure 25: South America HMG-CoA Reductase Inhibitors Revenue Share (%), by Country 2024 & 2032
- Figure 26: South America HMG-CoA Reductase Inhibitors Volume Share (%), by Country 2024 & 2032
- Figure 27: Europe HMG-CoA Reductase Inhibitors Revenue (million), by Application 2024 & 2032
- Figure 28: Europe HMG-CoA Reductase Inhibitors Volume (K), by Application 2024 & 2032
- Figure 29: Europe HMG-CoA Reductase Inhibitors Revenue Share (%), by Application 2024 & 2032
- Figure 30: Europe HMG-CoA Reductase Inhibitors Volume Share (%), by Application 2024 & 2032
- Figure 31: Europe HMG-CoA Reductase Inhibitors Revenue (million), by Types 2024 & 2032
- Figure 32: Europe HMG-CoA Reductase Inhibitors Volume (K), by Types 2024 & 2032
- Figure 33: Europe HMG-CoA Reductase Inhibitors Revenue Share (%), by Types 2024 & 2032
- Figure 34: Europe HMG-CoA Reductase Inhibitors Volume Share (%), by Types 2024 & 2032
- Figure 35: Europe HMG-CoA Reductase Inhibitors Revenue (million), by Country 2024 & 2032
- Figure 36: Europe HMG-CoA Reductase Inhibitors Volume (K), by Country 2024 & 2032
- Figure 37: Europe HMG-CoA Reductase Inhibitors Revenue Share (%), by Country 2024 & 2032
- Figure 38: Europe HMG-CoA Reductase Inhibitors Volume Share (%), by Country 2024 & 2032
- Figure 39: Middle East & Africa HMG-CoA Reductase Inhibitors Revenue (million), by Application 2024 & 2032
- Figure 40: Middle East & Africa HMG-CoA Reductase Inhibitors Volume (K), by Application 2024 & 2032
- Figure 41: Middle East & Africa HMG-CoA Reductase Inhibitors Revenue Share (%), by Application 2024 & 2032
- Figure 42: Middle East & Africa HMG-CoA Reductase Inhibitors Volume Share (%), by Application 2024 & 2032
- Figure 43: Middle East & Africa HMG-CoA Reductase Inhibitors Revenue (million), by Types 2024 & 2032
- Figure 44: Middle East & Africa HMG-CoA Reductase Inhibitors Volume (K), by Types 2024 & 2032
- Figure 45: Middle East & Africa HMG-CoA Reductase Inhibitors Revenue Share (%), by Types 2024 & 2032
- Figure 46: Middle East & Africa HMG-CoA Reductase Inhibitors Volume Share (%), by Types 2024 & 2032
- Figure 47: Middle East & Africa HMG-CoA Reductase Inhibitors Revenue (million), by Country 2024 & 2032
- Figure 48: Middle East & Africa HMG-CoA Reductase Inhibitors Volume (K), by Country 2024 & 2032
- Figure 49: Middle East & Africa HMG-CoA Reductase Inhibitors Revenue Share (%), by Country 2024 & 2032
- Figure 50: Middle East & Africa HMG-CoA Reductase Inhibitors Volume Share (%), by Country 2024 & 2032
- Figure 51: Asia Pacific HMG-CoA Reductase Inhibitors Revenue (million), by Application 2024 & 2032
- Figure 52: Asia Pacific HMG-CoA Reductase Inhibitors Volume (K), by Application 2024 & 2032
- Figure 53: Asia Pacific HMG-CoA Reductase Inhibitors Revenue Share (%), by Application 2024 & 2032
- Figure 54: Asia Pacific HMG-CoA Reductase Inhibitors Volume Share (%), by Application 2024 & 2032
- Figure 55: Asia Pacific HMG-CoA Reductase Inhibitors Revenue (million), by Types 2024 & 2032
- Figure 56: Asia Pacific HMG-CoA Reductase Inhibitors Volume (K), by Types 2024 & 2032
- Figure 57: Asia Pacific HMG-CoA Reductase Inhibitors Revenue Share (%), by Types 2024 & 2032
- Figure 58: Asia Pacific HMG-CoA Reductase Inhibitors Volume Share (%), by Types 2024 & 2032
- Figure 59: Asia Pacific HMG-CoA Reductase Inhibitors Revenue (million), by Country 2024 & 2032
- Figure 60: Asia Pacific HMG-CoA Reductase Inhibitors Volume (K), by Country 2024 & 2032
- Figure 61: Asia Pacific HMG-CoA Reductase Inhibitors Revenue Share (%), by Country 2024 & 2032
- Figure 62: Asia Pacific HMG-CoA Reductase Inhibitors Volume Share (%), by Country 2024 & 2032
List of Tables
- Table 1: Global HMG-CoA Reductase Inhibitors Revenue million Forecast, by Region 2019 & 2032
- Table 2: Global HMG-CoA Reductase Inhibitors Volume K Forecast, by Region 2019 & 2032
- Table 3: Global HMG-CoA Reductase Inhibitors Revenue million Forecast, by Application 2019 & 2032
- Table 4: Global HMG-CoA Reductase Inhibitors Volume K Forecast, by Application 2019 & 2032
- Table 5: Global HMG-CoA Reductase Inhibitors Revenue million Forecast, by Types 2019 & 2032
- Table 6: Global HMG-CoA Reductase Inhibitors Volume K Forecast, by Types 2019 & 2032
- Table 7: Global HMG-CoA Reductase Inhibitors Revenue million Forecast, by Region 2019 & 2032
- Table 8: Global HMG-CoA Reductase Inhibitors Volume K Forecast, by Region 2019 & 2032
- Table 9: Global HMG-CoA Reductase Inhibitors Revenue million Forecast, by Application 2019 & 2032
- Table 10: Global HMG-CoA Reductase Inhibitors Volume K Forecast, by Application 2019 & 2032
- Table 11: Global HMG-CoA Reductase Inhibitors Revenue million Forecast, by Types 2019 & 2032
- Table 12: Global HMG-CoA Reductase Inhibitors Volume K Forecast, by Types 2019 & 2032
- Table 13: Global HMG-CoA Reductase Inhibitors Revenue million Forecast, by Country 2019 & 2032
- Table 14: Global HMG-CoA Reductase Inhibitors Volume K Forecast, by Country 2019 & 2032
- Table 15: United States HMG-CoA Reductase Inhibitors Revenue (million) Forecast, by Application 2019 & 2032
- Table 16: United States HMG-CoA Reductase Inhibitors Volume (K) Forecast, by Application 2019 & 2032
- Table 17: Canada HMG-CoA Reductase Inhibitors Revenue (million) Forecast, by Application 2019 & 2032
- Table 18: Canada HMG-CoA Reductase Inhibitors Volume (K) Forecast, by Application 2019 & 2032
- Table 19: Mexico HMG-CoA Reductase Inhibitors Revenue (million) Forecast, by Application 2019 & 2032
- Table 20: Mexico HMG-CoA Reductase Inhibitors Volume (K) Forecast, by Application 2019 & 2032
- Table 21: Global HMG-CoA Reductase Inhibitors Revenue million Forecast, by Application 2019 & 2032
- Table 22: Global HMG-CoA Reductase Inhibitors Volume K Forecast, by Application 2019 & 2032
- Table 23: Global HMG-CoA Reductase Inhibitors Revenue million Forecast, by Types 2019 & 2032
- Table 24: Global HMG-CoA Reductase Inhibitors Volume K Forecast, by Types 2019 & 2032
- Table 25: Global HMG-CoA Reductase Inhibitors Revenue million Forecast, by Country 2019 & 2032
- Table 26: Global HMG-CoA Reductase Inhibitors Volume K Forecast, by Country 2019 & 2032
- Table 27: Brazil HMG-CoA Reductase Inhibitors Revenue (million) Forecast, by Application 2019 & 2032
- Table 28: Brazil HMG-CoA Reductase Inhibitors Volume (K) Forecast, by Application 2019 & 2032
- Table 29: Argentina HMG-CoA Reductase Inhibitors Revenue (million) Forecast, by Application 2019 & 2032
- Table 30: Argentina HMG-CoA Reductase Inhibitors Volume (K) Forecast, by Application 2019 & 2032
- Table 31: Rest of South America HMG-CoA Reductase Inhibitors Revenue (million) Forecast, by Application 2019 & 2032
- Table 32: Rest of South America HMG-CoA Reductase Inhibitors Volume (K) Forecast, by Application 2019 & 2032
- Table 33: Global HMG-CoA Reductase Inhibitors Revenue million Forecast, by Application 2019 & 2032
- Table 34: Global HMG-CoA Reductase Inhibitors Volume K Forecast, by Application 2019 & 2032
- Table 35: Global HMG-CoA Reductase Inhibitors Revenue million Forecast, by Types 2019 & 2032
- Table 36: Global HMG-CoA Reductase Inhibitors Volume K Forecast, by Types 2019 & 2032
- Table 37: Global HMG-CoA Reductase Inhibitors Revenue million Forecast, by Country 2019 & 2032
- Table 38: Global HMG-CoA Reductase Inhibitors Volume K Forecast, by Country 2019 & 2032
- Table 39: United Kingdom HMG-CoA Reductase Inhibitors Revenue (million) Forecast, by Application 2019 & 2032
- Table 40: United Kingdom HMG-CoA Reductase Inhibitors Volume (K) Forecast, by Application 2019 & 2032
- Table 41: Germany HMG-CoA Reductase Inhibitors Revenue (million) Forecast, by Application 2019 & 2032
- Table 42: Germany HMG-CoA Reductase Inhibitors Volume (K) Forecast, by Application 2019 & 2032
- Table 43: France HMG-CoA Reductase Inhibitors Revenue (million) Forecast, by Application 2019 & 2032
- Table 44: France HMG-CoA Reductase Inhibitors Volume (K) Forecast, by Application 2019 & 2032
- Table 45: Italy HMG-CoA Reductase Inhibitors Revenue (million) Forecast, by Application 2019 & 2032
- Table 46: Italy HMG-CoA Reductase Inhibitors Volume (K) Forecast, by Application 2019 & 2032
- Table 47: Spain HMG-CoA Reductase Inhibitors Revenue (million) Forecast, by Application 2019 & 2032
- Table 48: Spain HMG-CoA Reductase Inhibitors Volume (K) Forecast, by Application 2019 & 2032
- Table 49: Russia HMG-CoA Reductase Inhibitors Revenue (million) Forecast, by Application 2019 & 2032
- Table 50: Russia HMG-CoA Reductase Inhibitors Volume (K) Forecast, by Application 2019 & 2032
- Table 51: Benelux HMG-CoA Reductase Inhibitors Revenue (million) Forecast, by Application 2019 & 2032
- Table 52: Benelux HMG-CoA Reductase Inhibitors Volume (K) Forecast, by Application 2019 & 2032
- Table 53: Nordics HMG-CoA Reductase Inhibitors Revenue (million) Forecast, by Application 2019 & 2032
- Table 54: Nordics HMG-CoA Reductase Inhibitors Volume (K) Forecast, by Application 2019 & 2032
- Table 55: Rest of Europe HMG-CoA Reductase Inhibitors Revenue (million) Forecast, by Application 2019 & 2032
- Table 56: Rest of Europe HMG-CoA Reductase Inhibitors Volume (K) Forecast, by Application 2019 & 2032
- Table 57: Global HMG-CoA Reductase Inhibitors Revenue million Forecast, by Application 2019 & 2032
- Table 58: Global HMG-CoA Reductase Inhibitors Volume K Forecast, by Application 2019 & 2032
- Table 59: Global HMG-CoA Reductase Inhibitors Revenue million Forecast, by Types 2019 & 2032
- Table 60: Global HMG-CoA Reductase Inhibitors Volume K Forecast, by Types 2019 & 2032
- Table 61: Global HMG-CoA Reductase Inhibitors Revenue million Forecast, by Country 2019 & 2032
- Table 62: Global HMG-CoA Reductase Inhibitors Volume K Forecast, by Country 2019 & 2032
- Table 63: Turkey HMG-CoA Reductase Inhibitors Revenue (million) Forecast, by Application 2019 & 2032
- Table 64: Turkey HMG-CoA Reductase Inhibitors Volume (K) Forecast, by Application 2019 & 2032
- Table 65: Israel HMG-CoA Reductase Inhibitors Revenue (million) Forecast, by Application 2019 & 2032
- Table 66: Israel HMG-CoA Reductase Inhibitors Volume (K) Forecast, by Application 2019 & 2032
- Table 67: GCC HMG-CoA Reductase Inhibitors Revenue (million) Forecast, by Application 2019 & 2032
- Table 68: GCC HMG-CoA Reductase Inhibitors Volume (K) Forecast, by Application 2019 & 2032
- Table 69: North Africa HMG-CoA Reductase Inhibitors Revenue (million) Forecast, by Application 2019 & 2032
- Table 70: North Africa HMG-CoA Reductase Inhibitors Volume (K) Forecast, by Application 2019 & 2032
- Table 71: South Africa HMG-CoA Reductase Inhibitors Revenue (million) Forecast, by Application 2019 & 2032
- Table 72: South Africa HMG-CoA Reductase Inhibitors Volume (K) Forecast, by Application 2019 & 2032
- Table 73: Rest of Middle East & Africa HMG-CoA Reductase Inhibitors Revenue (million) Forecast, by Application 2019 & 2032
- Table 74: Rest of Middle East & Africa HMG-CoA Reductase Inhibitors Volume (K) Forecast, by Application 2019 & 2032
- Table 75: Global HMG-CoA Reductase Inhibitors Revenue million Forecast, by Application 2019 & 2032
- Table 76: Global HMG-CoA Reductase Inhibitors Volume K Forecast, by Application 2019 & 2032
- Table 77: Global HMG-CoA Reductase Inhibitors Revenue million Forecast, by Types 2019 & 2032
- Table 78: Global HMG-CoA Reductase Inhibitors Volume K Forecast, by Types 2019 & 2032
- Table 79: Global HMG-CoA Reductase Inhibitors Revenue million Forecast, by Country 2019 & 2032
- Table 80: Global HMG-CoA Reductase Inhibitors Volume K Forecast, by Country 2019 & 2032
- Table 81: China HMG-CoA Reductase Inhibitors Revenue (million) Forecast, by Application 2019 & 2032
- Table 82: China HMG-CoA Reductase Inhibitors Volume (K) Forecast, by Application 2019 & 2032
- Table 83: India HMG-CoA Reductase Inhibitors Revenue (million) Forecast, by Application 2019 & 2032
- Table 84: India HMG-CoA Reductase Inhibitors Volume (K) Forecast, by Application 2019 & 2032
- Table 85: Japan HMG-CoA Reductase Inhibitors Revenue (million) Forecast, by Application 2019 & 2032
- Table 86: Japan HMG-CoA Reductase Inhibitors Volume (K) Forecast, by Application 2019 & 2032
- Table 87: South Korea HMG-CoA Reductase Inhibitors Revenue (million) Forecast, by Application 2019 & 2032
- Table 88: South Korea HMG-CoA Reductase Inhibitors Volume (K) Forecast, by Application 2019 & 2032
- Table 89: ASEAN HMG-CoA Reductase Inhibitors Revenue (million) Forecast, by Application 2019 & 2032
- Table 90: ASEAN HMG-CoA Reductase Inhibitors Volume (K) Forecast, by Application 2019 & 2032
- Table 91: Oceania HMG-CoA Reductase Inhibitors Revenue (million) Forecast, by Application 2019 & 2032
- Table 92: Oceania HMG-CoA Reductase Inhibitors Volume (K) Forecast, by Application 2019 & 2032
- Table 93: Rest of Asia Pacific HMG-CoA Reductase Inhibitors Revenue (million) Forecast, by Application 2019 & 2032
- Table 94: Rest of Asia Pacific HMG-CoA Reductase Inhibitors Volume (K) Forecast, by Application 2019 & 2032
Frequently Asked Questions
1. What is the projected Compound Annual Growth Rate (CAGR) of the HMG-CoA Reductase Inhibitors?
The projected CAGR is approximately XX%.
2. Which companies are prominent players in the HMG-CoA Reductase Inhibitors?
Key companies in the market include Pfizer, AstraZeneca, Sanofi-Aventis, Lepu Pharmaceuticals, Simcere, Dinuo Pharmaceutical, Jialin Pharmaceutical, Qilu Pharmaceutical, CTTQ, Jiurui Health, Daiichi Sankyo, Merck Sharp & Dohme, Novartis, Lek Pharmaceuticals, Hanhui Pharmaceuticals, Wanbang Biopharmaceuticals.
3. What are the main segments of the HMG-CoA Reductase Inhibitors?
The market segments include Application, Types.
4. Can you provide details about the market size?
The market size is estimated to be USD XXX million as of 2022.
5. What are some drivers contributing to market growth?
N/A
6. What are the notable trends driving market growth?
N/A
7. Are there any restraints impacting market growth?
N/A
8. Can you provide examples of recent developments in the market?
N/A
9. What pricing options are available for accessing the report?
Pricing options include single-user, multi-user, and enterprise licenses priced at USD 3950.00, USD 5925.00, and USD 7900.00 respectively.
10. Is the market size provided in terms of value or volume?
The market size is provided in terms of value, measured in million and volume, measured in K.
11. Are there any specific market keywords associated with the report?
Yes, the market keyword associated with the report is "HMG-CoA Reductase Inhibitors," which aids in identifying and referencing the specific market segment covered.
12. How do I determine which pricing option suits my needs best?
The pricing options vary based on user requirements and access needs. Individual users may opt for single-user licenses, while businesses requiring broader access may choose multi-user or enterprise licenses for cost-effective access to the report.
13. Are there any additional resources or data provided in the HMG-CoA Reductase Inhibitors report?
While the report offers comprehensive insights, it's advisable to review the specific contents or supplementary materials provided to ascertain if additional resources or data are available.
14. How can I stay updated on further developments or reports in the HMG-CoA Reductase Inhibitors?
To stay informed about further developments, trends, and reports in the HMG-CoA Reductase Inhibitors, consider subscribing to industry newsletters, following relevant companies and organizations, or regularly checking reputable industry news sources and publications.
Methodology
Step 1 - Identification of Relevant Samples Size from Population Database


Step 2 - Approaches for Defining Global Market Size (Value, Volume* & Price*)

Note*: In applicable scenarios
Step 3 - Data Sources
Primary Research
- Web Analytics
- Survey Reports
- Research Institute
- Latest Research Reports
- Opinion Leaders
Secondary Research
- Annual Reports
- White Paper
- Latest Press Release
- Industry Association
- Paid Database
- Investor Presentations

Step 4 - Data Triangulation
Involves using different sources of information in order to increase the validity of a study
These sources are likely to be stakeholders in a program - participants, other researchers, program staff, other community members, and so on.
Then we put all data in single framework & apply various statistical tools to find out the dynamic on the market.
During the analysis stage, feedback from the stakeholder groups would be compared to determine areas of agreement as well as areas of divergence
