

Key Insights
The global home entertainment product market, valued at $308.60 million in 2025, is projected to experience robust growth, driven by several key factors. The increasing penetration of high-speed internet and affordable streaming services fuels demand for smart TVs, soundbars, and streaming devices. Consumers are increasingly seeking immersive entertainment experiences at home, leading to higher adoption of premium audio-visual technologies like 4K TVs, Dolby Atmos sound systems, and home theater setups. Technological advancements, such as improved display resolutions, enhanced audio quality, and the integration of smart features, continuously drive innovation and consumer interest. Furthermore, the rising disposable incomes in developing economies contribute significantly to the market expansion, particularly in Asia-Pacific and Latin America. However, factors such as the high initial investment costs for premium home entertainment systems and the potential for technological obsolescence could pose challenges to market growth. Competition among established players like Samsung, Sony, LG, and emerging brands necessitates continuous innovation and competitive pricing strategies. The market is segmented by product type (TVs, audio systems, gaming consoles, etc.), technology (OLED, QLED, etc.), and distribution channels (online, offline). The forecast period of 2025-2033 promises sustained growth, with a Compound Annual Growth Rate (CAGR) of 4.80%, indicating significant market potential.
The market's future trajectory is likely to be shaped by several trends. The integration of artificial intelligence (AI) and the Internet of Things (IoT) will further enhance user experience with personalized recommendations, voice control, and seamless connectivity. The rise of virtual and augmented reality (VR/AR) technologies is expected to create new opportunities for immersive gaming and entertainment. Sustainability concerns are also influencing product development, with manufacturers focusing on energy-efficient designs and eco-friendly materials. The continued adoption of streaming platforms and the expansion of content libraries are anticipated to drive demand for high-quality home entertainment systems. Regional variations in consumer preferences and purchasing power will continue to impact market growth. Understanding these trends is crucial for businesses to successfully navigate the dynamic landscape of the home entertainment industry and capture market share.

Home Entertainment Product Market: A Comprehensive Report (2019-2033)
This comprehensive report provides a detailed analysis of the Home Entertainment Product market, encompassing market dynamics, growth trends, regional analysis, product landscape, key players, and future outlook. The study period covers 2019-2033, with 2025 as the base year and a forecast period of 2025-2033. The report offers invaluable insights for industry professionals, investors, and strategic decision-makers seeking to navigate this dynamic market. The market is segmented into various product categories (specific details within the full report).
Home Entertainment Product Market Dynamics & Structure
The Home Entertainment Product market is characterized by a moderately concentrated landscape, with key players like Samsung, Sony, and LG holding significant market share (xx%). Technological innovation, particularly in areas like 8K resolution, HDR, and advanced audio technologies, is a crucial driver. Regulatory frameworks concerning data privacy and content licensing impact market dynamics. Competition from substitutes, such as outdoor recreational activities and online gaming, influences consumer choices. End-user demographics show a significant shift towards younger generations embracing streaming services and smart home integration. Recent M&A activities (e.g., Walmart's acquisition of Vizio) indicate consolidation and a push towards vertical integration.
- Market Concentration: Moderately concentrated, with top 5 players holding xx% market share in 2024.
- Innovation Drivers: 8K resolution, HDR, advanced audio (Dolby Atmos, etc.), AI-powered features, streaming integration.
- Regulatory Impacts: Data privacy regulations (GDPR, CCPA), content licensing agreements.
- Competitive Substitutes: Outdoor activities, online gaming, social media.
- End-User Demographics: Growing adoption among younger demographics, increasing demand for smart home integration.
- M&A Trends: xx M&A deals in the last 5 years, indicating market consolidation and vertical integration strategies.
Home Entertainment Product Market Growth Trends & Insights
The global Home Entertainment Product market is experiencing robust growth, with an estimated market size of xx million units in 2025. The market is projected to grow at a CAGR of xx% during the forecast period (2025-2033), driven by factors such as rising disposable incomes, increasing adoption of streaming services, and technological advancements in display and audio technologies. Consumer behavior is shifting towards premium experiences, with consumers increasingly willing to invest in high-quality home entertainment systems. Adoption rates for smart TVs and streaming devices are exceptionally high, exceeding xx% in developed markets. Technological disruptions, such as the rise of virtual and augmented reality, are creating new avenues for growth.

Dominant Regions, Countries, or Segments in Home Entertainment Product Market
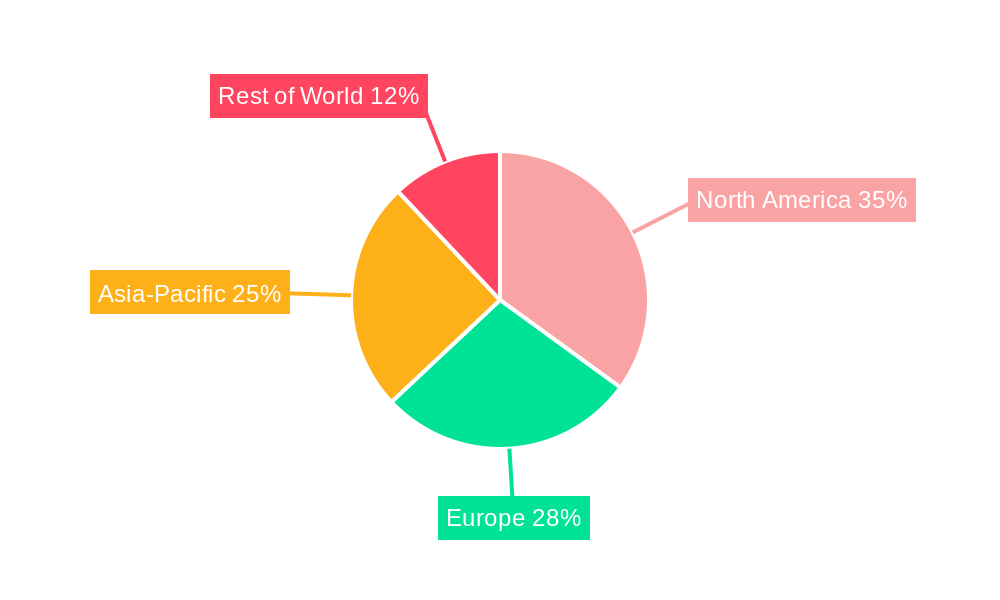
North America and Asia-Pacific currently dominate the Home Entertainment Product market, accounting for xx% and xx% of global market share respectively, in 2024. The dominance of these regions is primarily driven by high consumer spending power, robust technological infrastructure, and early adoption of new technologies. Developed markets in North America and Western Europe exhibit high market penetration of smart TVs and streaming devices, while emerging economies in Asia-Pacific display rapid growth potential due to expanding middle classes and increasing urbanization.
- North America: High disposable incomes, strong technology infrastructure, early adoption of new technologies.
- Asia-Pacific: Rapidly expanding middle class, increasing urbanization, growing demand for premium home entertainment.
- Europe: Relatively mature market, with steady growth driven by technological innovation and premium product adoption.
Home Entertainment Product Market Product Landscape
The home entertainment product landscape is rapidly evolving, with innovations focused on enhancing viewing and listening experiences. High-resolution displays (4K, 8K), HDR technology, and advanced audio systems (like Dolby Atmos) are key features driving consumer demand. Smart functionalities, including voice control and seamless streaming integration, are becoming standard features. The unique selling propositions center on superior image quality, immersive sound, and user-friendly interfaces.
Key Drivers, Barriers & Challenges in Home Entertainment Product Market
Key Drivers: Rising disposable incomes, increasing urbanization, technological advancements (8K, HDR, AI), the growth of streaming services, and the demand for enhanced home entertainment experiences. Examples include the increasing popularity of premium streaming services like Netflix and Disney+.
Challenges: Intense competition among established players, the emergence of disruptive technologies (VR/AR), supply chain disruptions, and evolving consumer preferences. The impact of supply chain disruptions, quantified by xx% increase in production costs in 2022, highlights the vulnerability of the market.
Emerging Opportunities in Home Entertainment Product Market
Emerging opportunities lie in the expanding smart home ecosystem, integration with IoT devices, personalized entertainment experiences driven by AI, and the potential of virtual and augmented reality technologies to create immersive home entertainment. Untapped markets in developing countries also present significant growth potential.
Growth Accelerators in the Home Entertainment Product Market Industry
Technological breakthroughs in display and audio technologies are key growth accelerators. Strategic partnerships between content providers and hardware manufacturers are also crucial for driving market expansion. Furthermore, successful expansion into untapped markets in developing economies is expected to generate significant long-term growth.
Key Players Shaping the Home Entertainment Product Market Market
- Samsung Electronics
- Panasonic Corporation
- Sony Corporation
- Microsoft Corporation
- LG Electronics
- Apple Inc
- Bose Corporation
- Haier Inc
- Koninklijke Philips N V
- Mitsubishi Electric Corporation
- *List Not Exhaustive
Notable Milestones in Home Entertainment Product Market Sector
- July 2024: Evolution Malta Holding Limited acquires Galaxy Gaming Inc., strengthening its position in the US online gaming market. This indirectly impacts the home entertainment market by highlighting the growing convergence between gaming and home entertainment.
- May 2024: ASUS unveils plans for the ROG Ally X handheld gaming console, expanding the market for portable gaming devices. This influences the home entertainment market by suggesting shifts in gaming preferences and consumption.
- April 2024: Sony renews its BRAVIA brand, emphasizing the home cinema experience and directly impacting the high-end home entertainment market.
- February 2024: Walmart acquires Vizio, a significant smart TV manufacturer, impacting the distribution and market share dynamics within the smart TV segment.
In-Depth Home Entertainment Product Market Market Outlook
The future of the Home Entertainment Product market is bright, with continued growth fueled by technological advancements, expanding streaming services, and a growing demand for immersive entertainment experiences. Strategic partnerships and a focus on innovation will be critical for success. The market's potential is vast, particularly in emerging economies and with the integration of new technologies like VR/AR.
Home Entertainment Product Market Segmentation
-
1. Device
- 1.1. Audio Devices
- 1.2. Video Devices
- 1.3. Gaming Consoles
-
2. Distribution Channel
- 2.1. Online
- 2.2. Offline
Home Entertainment Product Market Segmentation By Geography
-
1. North America
- 1.1. United States
- 1.2. Canada
- 1.3. Mexico
-
2. South America
- 2.1. Brazil
- 2.2. Argentina
- 2.3. Rest of South America
-
3. Europe
- 3.1. United Kingdom
- 3.2. Germany
- 3.3. France
- 3.4. Italy
- 3.5. Spain
- 3.6. Russia
- 3.7. Benelux
- 3.8. Nordics
- 3.9. Rest of Europe
-
4. Middle East & Africa
- 4.1. Turkey
- 4.2. Israel
- 4.3. GCC
- 4.4. North Africa
- 4.5. South Africa
- 4.6. Rest of Middle East & Africa
-
5. Asia Pacific
- 5.1. China
- 5.2. India
- 5.3. Japan
- 5.4. South Korea
- 5.5. ASEAN
- 5.6. Oceania
- 5.7. Rest of Asia Pacific
Home Entertainment Product Market REPORT HIGHLIGHTS
| Aspects | Details |
|---|---|
| Study Period | 2019-2033 |
| Base Year | 2024 |
| Estimated Year | 2025 |
| Forecast Period | 2025-2033 |
| Historical Period | 2019-2024 |
| Growth Rate | CAGR of 4.80% from 2019-2033 |
| Segmentation |
|
Table of Contents
- 1. Introduction
- 1.1. Research Scope
- 1.2. Market Segmentation
- 1.3. Research Methodology
- 1.4. Definitions and Assumptions
- 2. Executive Summary
- 2.1. Introduction
- 3. Market Dynamics
- 3.1. Introduction
- 3.2. Market Drivers
- 3.2.1. Rising Popularity of IoT Connected Devices; Growing Number of Gaming Population Globally
- 3.3. Market Restrains
- 3.3.1. Rising Popularity of IoT Connected Devices; Growing Number of Gaming Population Globally
- 3.4. Market Trends
- 3.4.1. Gaming Consoles Gaining Popularity
- 4. Market Factor Analysis
- 4.1. Porters Five Forces
- 4.2. Supply/Value Chain
- 4.3. PESTEL analysis
- 4.4. Market Entropy
- 4.5. Patent/Trademark Analysis
- 5. Global Home Entertainment Product Market Analysis, Insights and Forecast, 2019-2031
- 5.1. Market Analysis, Insights and Forecast - by Device
- 5.1.1. Audio Devices
- 5.1.2. Video Devices
- 5.1.3. Gaming Consoles
- 5.2. Market Analysis, Insights and Forecast - by Distribution Channel
- 5.2.1. Online
- 5.2.2. Offline
- 5.3. Market Analysis, Insights and Forecast - by Region
- 5.3.1. North America
- 5.3.2. South America
- 5.3.3. Europe
- 5.3.4. Middle East & Africa
- 5.3.5. Asia Pacific
- 5.1. Market Analysis, Insights and Forecast - by Device
- 6. North America Home Entertainment Product Market Analysis, Insights and Forecast, 2019-2031
- 6.1. Market Analysis, Insights and Forecast - by Device
- 6.1.1. Audio Devices
- 6.1.2. Video Devices
- 6.1.3. Gaming Consoles
- 6.2. Market Analysis, Insights and Forecast - by Distribution Channel
- 6.2.1. Online
- 6.2.2. Offline
- 6.1. Market Analysis, Insights and Forecast - by Device
- 7. South America Home Entertainment Product Market Analysis, Insights and Forecast, 2019-2031
- 7.1. Market Analysis, Insights and Forecast - by Device
- 7.1.1. Audio Devices
- 7.1.2. Video Devices
- 7.1.3. Gaming Consoles
- 7.2. Market Analysis, Insights and Forecast - by Distribution Channel
- 7.2.1. Online
- 7.2.2. Offline
- 7.1. Market Analysis, Insights and Forecast - by Device
- 8. Europe Home Entertainment Product Market Analysis, Insights and Forecast, 2019-2031
- 8.1. Market Analysis, Insights and Forecast - by Device
- 8.1.1. Audio Devices
- 8.1.2. Video Devices
- 8.1.3. Gaming Consoles
- 8.2. Market Analysis, Insights and Forecast - by Distribution Channel
- 8.2.1. Online
- 8.2.2. Offline
- 8.1. Market Analysis, Insights and Forecast - by Device
- 9. Middle East & Africa Home Entertainment Product Market Analysis, Insights and Forecast, 2019-2031
- 9.1. Market Analysis, Insights and Forecast - by Device
- 9.1.1. Audio Devices
- 9.1.2. Video Devices
- 9.1.3. Gaming Consoles
- 9.2. Market Analysis, Insights and Forecast - by Distribution Channel
- 9.2.1. Online
- 9.2.2. Offline
- 9.1. Market Analysis, Insights and Forecast - by Device
- 10. Asia Pacific Home Entertainment Product Market Analysis, Insights and Forecast, 2019-2031
- 10.1. Market Analysis, Insights and Forecast - by Device
- 10.1.1. Audio Devices
- 10.1.2. Video Devices
- 10.1.3. Gaming Consoles
- 10.2. Market Analysis, Insights and Forecast - by Distribution Channel
- 10.2.1. Online
- 10.2.2. Offline
- 10.1. Market Analysis, Insights and Forecast - by Device
- 11. Competitive Analysis
- 11.1. Global Market Share Analysis 2024
- 11.2. Company Profiles
- 11.2.1 Samsung Electronics
- 11.2.1.1. Overview
- 11.2.1.2. Products
- 11.2.1.3. SWOT Analysis
- 11.2.1.4. Recent Developments
- 11.2.1.5. Financials (Based on Availability)
- 11.2.2 Panasonic Corporation
- 11.2.2.1. Overview
- 11.2.2.2. Products
- 11.2.2.3. SWOT Analysis
- 11.2.2.4. Recent Developments
- 11.2.2.5. Financials (Based on Availability)
- 11.2.3 Sony Corporation
- 11.2.3.1. Overview
- 11.2.3.2. Products
- 11.2.3.3. SWOT Analysis
- 11.2.3.4. Recent Developments
- 11.2.3.5. Financials (Based on Availability)
- 11.2.4 Microsoft Corporation
- 11.2.4.1. Overview
- 11.2.4.2. Products
- 11.2.4.3. SWOT Analysis
- 11.2.4.4. Recent Developments
- 11.2.4.5. Financials (Based on Availability)
- 11.2.5 LG Electronics
- 11.2.5.1. Overview
- 11.2.5.2. Products
- 11.2.5.3. SWOT Analysis
- 11.2.5.4. Recent Developments
- 11.2.5.5. Financials (Based on Availability)
- 11.2.6 Apple Inc
- 11.2.6.1. Overview
- 11.2.6.2. Products
- 11.2.6.3. SWOT Analysis
- 11.2.6.4. Recent Developments
- 11.2.6.5. Financials (Based on Availability)
- 11.2.7 Bose Corporation
- 11.2.7.1. Overview
- 11.2.7.2. Products
- 11.2.7.3. SWOT Analysis
- 11.2.7.4. Recent Developments
- 11.2.7.5. Financials (Based on Availability)
- 11.2.8 Haier Inc
- 11.2.8.1. Overview
- 11.2.8.2. Products
- 11.2.8.3. SWOT Analysis
- 11.2.8.4. Recent Developments
- 11.2.8.5. Financials (Based on Availability)
- 11.2.9 Koninklijke Philips N V
- 11.2.9.1. Overview
- 11.2.9.2. Products
- 11.2.9.3. SWOT Analysis
- 11.2.9.4. Recent Developments
- 11.2.9.5. Financials (Based on Availability)
- 11.2.10 Mitsubishi Electric Corporation*List Not Exhaustive
- 11.2.10.1. Overview
- 11.2.10.2. Products
- 11.2.10.3. SWOT Analysis
- 11.2.10.4. Recent Developments
- 11.2.10.5. Financials (Based on Availability)
- 11.2.1 Samsung Electronics
List of Figures
- Figure 1: Global Home Entertainment Product Market Revenue Breakdown (Million, %) by Region 2024 & 2032
- Figure 2: Global Home Entertainment Product Market Volume Breakdown (Billion, %) by Region 2024 & 2032
- Figure 3: North America Home Entertainment Product Market Revenue (Million), by Device 2024 & 2032
- Figure 4: North America Home Entertainment Product Market Volume (Billion), by Device 2024 & 2032
- Figure 5: North America Home Entertainment Product Market Revenue Share (%), by Device 2024 & 2032
- Figure 6: North America Home Entertainment Product Market Volume Share (%), by Device 2024 & 2032
- Figure 7: North America Home Entertainment Product Market Revenue (Million), by Distribution Channel 2024 & 2032
- Figure 8: North America Home Entertainment Product Market Volume (Billion), by Distribution Channel 2024 & 2032
- Figure 9: North America Home Entertainment Product Market Revenue Share (%), by Distribution Channel 2024 & 2032
- Figure 10: North America Home Entertainment Product Market Volume Share (%), by Distribution Channel 2024 & 2032
- Figure 11: North America Home Entertainment Product Market Revenue (Million), by Country 2024 & 2032
- Figure 12: North America Home Entertainment Product Market Volume (Billion), by Country 2024 & 2032
- Figure 13: North America Home Entertainment Product Market Revenue Share (%), by Country 2024 & 2032
- Figure 14: North America Home Entertainment Product Market Volume Share (%), by Country 2024 & 2032
- Figure 15: South America Home Entertainment Product Market Revenue (Million), by Device 2024 & 2032
- Figure 16: South America Home Entertainment Product Market Volume (Billion), by Device 2024 & 2032
- Figure 17: South America Home Entertainment Product Market Revenue Share (%), by Device 2024 & 2032
- Figure 18: South America Home Entertainment Product Market Volume Share (%), by Device 2024 & 2032
- Figure 19: South America Home Entertainment Product Market Revenue (Million), by Distribution Channel 2024 & 2032
- Figure 20: South America Home Entertainment Product Market Volume (Billion), by Distribution Channel 2024 & 2032
- Figure 21: South America Home Entertainment Product Market Revenue Share (%), by Distribution Channel 2024 & 2032
- Figure 22: South America Home Entertainment Product Market Volume Share (%), by Distribution Channel 2024 & 2032
- Figure 23: South America Home Entertainment Product Market Revenue (Million), by Country 2024 & 2032
- Figure 24: South America Home Entertainment Product Market Volume (Billion), by Country 2024 & 2032
- Figure 25: South America Home Entertainment Product Market Revenue Share (%), by Country 2024 & 2032
- Figure 26: South America Home Entertainment Product Market Volume Share (%), by Country 2024 & 2032
- Figure 27: Europe Home Entertainment Product Market Revenue (Million), by Device 2024 & 2032
- Figure 28: Europe Home Entertainment Product Market Volume (Billion), by Device 2024 & 2032
- Figure 29: Europe Home Entertainment Product Market Revenue Share (%), by Device 2024 & 2032
- Figure 30: Europe Home Entertainment Product Market Volume Share (%), by Device 2024 & 2032
- Figure 31: Europe Home Entertainment Product Market Revenue (Million), by Distribution Channel 2024 & 2032
- Figure 32: Europe Home Entertainment Product Market Volume (Billion), by Distribution Channel 2024 & 2032
- Figure 33: Europe Home Entertainment Product Market Revenue Share (%), by Distribution Channel 2024 & 2032
- Figure 34: Europe Home Entertainment Product Market Volume Share (%), by Distribution Channel 2024 & 2032
- Figure 35: Europe Home Entertainment Product Market Revenue (Million), by Country 2024 & 2032
- Figure 36: Europe Home Entertainment Product Market Volume (Billion), by Country 2024 & 2032
- Figure 37: Europe Home Entertainment Product Market Revenue Share (%), by Country 2024 & 2032
- Figure 38: Europe Home Entertainment Product Market Volume Share (%), by Country 2024 & 2032
- Figure 39: Middle East & Africa Home Entertainment Product Market Revenue (Million), by Device 2024 & 2032
- Figure 40: Middle East & Africa Home Entertainment Product Market Volume (Billion), by Device 2024 & 2032
- Figure 41: Middle East & Africa Home Entertainment Product Market Revenue Share (%), by Device 2024 & 2032
- Figure 42: Middle East & Africa Home Entertainment Product Market Volume Share (%), by Device 2024 & 2032
- Figure 43: Middle East & Africa Home Entertainment Product Market Revenue (Million), by Distribution Channel 2024 & 2032
- Figure 44: Middle East & Africa Home Entertainment Product Market Volume (Billion), by Distribution Channel 2024 & 2032
- Figure 45: Middle East & Africa Home Entertainment Product Market Revenue Share (%), by Distribution Channel 2024 & 2032
- Figure 46: Middle East & Africa Home Entertainment Product Market Volume Share (%), by Distribution Channel 2024 & 2032
- Figure 47: Middle East & Africa Home Entertainment Product Market Revenue (Million), by Country 2024 & 2032
- Figure 48: Middle East & Africa Home Entertainment Product Market Volume (Billion), by Country 2024 & 2032
- Figure 49: Middle East & Africa Home Entertainment Product Market Revenue Share (%), by Country 2024 & 2032
- Figure 50: Middle East & Africa Home Entertainment Product Market Volume Share (%), by Country 2024 & 2032
- Figure 51: Asia Pacific Home Entertainment Product Market Revenue (Million), by Device 2024 & 2032
- Figure 52: Asia Pacific Home Entertainment Product Market Volume (Billion), by Device 2024 & 2032
- Figure 53: Asia Pacific Home Entertainment Product Market Revenue Share (%), by Device 2024 & 2032
- Figure 54: Asia Pacific Home Entertainment Product Market Volume Share (%), by Device 2024 & 2032
- Figure 55: Asia Pacific Home Entertainment Product Market Revenue (Million), by Distribution Channel 2024 & 2032
- Figure 56: Asia Pacific Home Entertainment Product Market Volume (Billion), by Distribution Channel 2024 & 2032
- Figure 57: Asia Pacific Home Entertainment Product Market Revenue Share (%), by Distribution Channel 2024 & 2032
- Figure 58: Asia Pacific Home Entertainment Product Market Volume Share (%), by Distribution Channel 2024 & 2032
- Figure 59: Asia Pacific Home Entertainment Product Market Revenue (Million), by Country 2024 & 2032
- Figure 60: Asia Pacific Home Entertainment Product Market Volume (Billion), by Country 2024 & 2032
- Figure 61: Asia Pacific Home Entertainment Product Market Revenue Share (%), by Country 2024 & 2032
- Figure 62: Asia Pacific Home Entertainment Product Market Volume Share (%), by Country 2024 & 2032
List of Tables
- Table 1: Global Home Entertainment Product Market Revenue Million Forecast, by Region 2019 & 2032
- Table 2: Global Home Entertainment Product Market Volume Billion Forecast, by Region 2019 & 2032
- Table 3: Global Home Entertainment Product Market Revenue Million Forecast, by Device 2019 & 2032
- Table 4: Global Home Entertainment Product Market Volume Billion Forecast, by Device 2019 & 2032
- Table 5: Global Home Entertainment Product Market Revenue Million Forecast, by Distribution Channel 2019 & 2032
- Table 6: Global Home Entertainment Product Market Volume Billion Forecast, by Distribution Channel 2019 & 2032
- Table 7: Global Home Entertainment Product Market Revenue Million Forecast, by Region 2019 & 2032
- Table 8: Global Home Entertainment Product Market Volume Billion Forecast, by Region 2019 & 2032
- Table 9: Global Home Entertainment Product Market Revenue Million Forecast, by Device 2019 & 2032
- Table 10: Global Home Entertainment Product Market Volume Billion Forecast, by Device 2019 & 2032
- Table 11: Global Home Entertainment Product Market Revenue Million Forecast, by Distribution Channel 2019 & 2032
- Table 12: Global Home Entertainment Product Market Volume Billion Forecast, by Distribution Channel 2019 & 2032
- Table 13: Global Home Entertainment Product Market Revenue Million Forecast, by Country 2019 & 2032
- Table 14: Global Home Entertainment Product Market Volume Billion Forecast, by Country 2019 & 2032
- Table 15: United States Home Entertainment Product Market Revenue (Million) Forecast, by Application 2019 & 2032
- Table 16: United States Home Entertainment Product Market Volume (Billion) Forecast, by Application 2019 & 2032
- Table 17: Canada Home Entertainment Product Market Revenue (Million) Forecast, by Application 2019 & 2032
- Table 18: Canada Home Entertainment Product Market Volume (Billion) Forecast, by Application 2019 & 2032
- Table 19: Mexico Home Entertainment Product Market Revenue (Million) Forecast, by Application 2019 & 2032
- Table 20: Mexico Home Entertainment Product Market Volume (Billion) Forecast, by Application 2019 & 2032
- Table 21: Global Home Entertainment Product Market Revenue Million Forecast, by Device 2019 & 2032
- Table 22: Global Home Entertainment Product Market Volume Billion Forecast, by Device 2019 & 2032
- Table 23: Global Home Entertainment Product Market Revenue Million Forecast, by Distribution Channel 2019 & 2032
- Table 24: Global Home Entertainment Product Market Volume Billion Forecast, by Distribution Channel 2019 & 2032
- Table 25: Global Home Entertainment Product Market Revenue Million Forecast, by Country 2019 & 2032
- Table 26: Global Home Entertainment Product Market Volume Billion Forecast, by Country 2019 & 2032
- Table 27: Brazil Home Entertainment Product Market Revenue (Million) Forecast, by Application 2019 & 2032
- Table 28: Brazil Home Entertainment Product Market Volume (Billion) Forecast, by Application 2019 & 2032
- Table 29: Argentina Home Entertainment Product Market Revenue (Million) Forecast, by Application 2019 & 2032
- Table 30: Argentina Home Entertainment Product Market Volume (Billion) Forecast, by Application 2019 & 2032
- Table 31: Rest of South America Home Entertainment Product Market Revenue (Million) Forecast, by Application 2019 & 2032
- Table 32: Rest of South America Home Entertainment Product Market Volume (Billion) Forecast, by Application 2019 & 2032
- Table 33: Global Home Entertainment Product Market Revenue Million Forecast, by Device 2019 & 2032
- Table 34: Global Home Entertainment Product Market Volume Billion Forecast, by Device 2019 & 2032
- Table 35: Global Home Entertainment Product Market Revenue Million Forecast, by Distribution Channel 2019 & 2032
- Table 36: Global Home Entertainment Product Market Volume Billion Forecast, by Distribution Channel 2019 & 2032
- Table 37: Global Home Entertainment Product Market Revenue Million Forecast, by Country 2019 & 2032
- Table 38: Global Home Entertainment Product Market Volume Billion Forecast, by Country 2019 & 2032
- Table 39: United Kingdom Home Entertainment Product Market Revenue (Million) Forecast, by Application 2019 & 2032
- Table 40: United Kingdom Home Entertainment Product Market Volume (Billion) Forecast, by Application 2019 & 2032
- Table 41: Germany Home Entertainment Product Market Revenue (Million) Forecast, by Application 2019 & 2032
- Table 42: Germany Home Entertainment Product Market Volume (Billion) Forecast, by Application 2019 & 2032
- Table 43: France Home Entertainment Product Market Revenue (Million) Forecast, by Application 2019 & 2032
- Table 44: France Home Entertainment Product Market Volume (Billion) Forecast, by Application 2019 & 2032
- Table 45: Italy Home Entertainment Product Market Revenue (Million) Forecast, by Application 2019 & 2032
- Table 46: Italy Home Entertainment Product Market Volume (Billion) Forecast, by Application 2019 & 2032
- Table 47: Spain Home Entertainment Product Market Revenue (Million) Forecast, by Application 2019 & 2032
- Table 48: Spain Home Entertainment Product Market Volume (Billion) Forecast, by Application 2019 & 2032
- Table 49: Russia Home Entertainment Product Market Revenue (Million) Forecast, by Application 2019 & 2032
- Table 50: Russia Home Entertainment Product Market Volume (Billion) Forecast, by Application 2019 & 2032
- Table 51: Benelux Home Entertainment Product Market Revenue (Million) Forecast, by Application 2019 & 2032
- Table 52: Benelux Home Entertainment Product Market Volume (Billion) Forecast, by Application 2019 & 2032
- Table 53: Nordics Home Entertainment Product Market Revenue (Million) Forecast, by Application 2019 & 2032
- Table 54: Nordics Home Entertainment Product Market Volume (Billion) Forecast, by Application 2019 & 2032
- Table 55: Rest of Europe Home Entertainment Product Market Revenue (Million) Forecast, by Application 2019 & 2032
- Table 56: Rest of Europe Home Entertainment Product Market Volume (Billion) Forecast, by Application 2019 & 2032
- Table 57: Global Home Entertainment Product Market Revenue Million Forecast, by Device 2019 & 2032
- Table 58: Global Home Entertainment Product Market Volume Billion Forecast, by Device 2019 & 2032
- Table 59: Global Home Entertainment Product Market Revenue Million Forecast, by Distribution Channel 2019 & 2032
- Table 60: Global Home Entertainment Product Market Volume Billion Forecast, by Distribution Channel 2019 & 2032
- Table 61: Global Home Entertainment Product Market Revenue Million Forecast, by Country 2019 & 2032
- Table 62: Global Home Entertainment Product Market Volume Billion Forecast, by Country 2019 & 2032
- Table 63: Turkey Home Entertainment Product Market Revenue (Million) Forecast, by Application 2019 & 2032
- Table 64: Turkey Home Entertainment Product Market Volume (Billion) Forecast, by Application 2019 & 2032
- Table 65: Israel Home Entertainment Product Market Revenue (Million) Forecast, by Application 2019 & 2032
- Table 66: Israel Home Entertainment Product Market Volume (Billion) Forecast, by Application 2019 & 2032
- Table 67: GCC Home Entertainment Product Market Revenue (Million) Forecast, by Application 2019 & 2032
- Table 68: GCC Home Entertainment Product Market Volume (Billion) Forecast, by Application 2019 & 2032
- Table 69: North Africa Home Entertainment Product Market Revenue (Million) Forecast, by Application 2019 & 2032
- Table 70: North Africa Home Entertainment Product Market Volume (Billion) Forecast, by Application 2019 & 2032
- Table 71: South Africa Home Entertainment Product Market Revenue (Million) Forecast, by Application 2019 & 2032
- Table 72: South Africa Home Entertainment Product Market Volume (Billion) Forecast, by Application 2019 & 2032
- Table 73: Rest of Middle East & Africa Home Entertainment Product Market Revenue (Million) Forecast, by Application 2019 & 2032
- Table 74: Rest of Middle East & Africa Home Entertainment Product Market Volume (Billion) Forecast, by Application 2019 & 2032
- Table 75: Global Home Entertainment Product Market Revenue Million Forecast, by Device 2019 & 2032
- Table 76: Global Home Entertainment Product Market Volume Billion Forecast, by Device 2019 & 2032
- Table 77: Global Home Entertainment Product Market Revenue Million Forecast, by Distribution Channel 2019 & 2032
- Table 78: Global Home Entertainment Product Market Volume Billion Forecast, by Distribution Channel 2019 & 2032
- Table 79: Global Home Entertainment Product Market Revenue Million Forecast, by Country 2019 & 2032
- Table 80: Global Home Entertainment Product Market Volume Billion Forecast, by Country 2019 & 2032
- Table 81: China Home Entertainment Product Market Revenue (Million) Forecast, by Application 2019 & 2032
- Table 82: China Home Entertainment Product Market Volume (Billion) Forecast, by Application 2019 & 2032
- Table 83: India Home Entertainment Product Market Revenue (Million) Forecast, by Application 2019 & 2032
- Table 84: India Home Entertainment Product Market Volume (Billion) Forecast, by Application 2019 & 2032
- Table 85: Japan Home Entertainment Product Market Revenue (Million) Forecast, by Application 2019 & 2032
- Table 86: Japan Home Entertainment Product Market Volume (Billion) Forecast, by Application 2019 & 2032
- Table 87: South Korea Home Entertainment Product Market Revenue (Million) Forecast, by Application 2019 & 2032
- Table 88: South Korea Home Entertainment Product Market Volume (Billion) Forecast, by Application 2019 & 2032
- Table 89: ASEAN Home Entertainment Product Market Revenue (Million) Forecast, by Application 2019 & 2032
- Table 90: ASEAN Home Entertainment Product Market Volume (Billion) Forecast, by Application 2019 & 2032
- Table 91: Oceania Home Entertainment Product Market Revenue (Million) Forecast, by Application 2019 & 2032
- Table 92: Oceania Home Entertainment Product Market Volume (Billion) Forecast, by Application 2019 & 2032
- Table 93: Rest of Asia Pacific Home Entertainment Product Market Revenue (Million) Forecast, by Application 2019 & 2032
- Table 94: Rest of Asia Pacific Home Entertainment Product Market Volume (Billion) Forecast, by Application 2019 & 2032
Frequently Asked Questions
1. What is the projected Compound Annual Growth Rate (CAGR) of the Home Entertainment Product Market?
The projected CAGR is approximately 4.80%.
2. Which companies are prominent players in the Home Entertainment Product Market?
Key companies in the market include Samsung Electronics, Panasonic Corporation, Sony Corporation, Microsoft Corporation, LG Electronics, Apple Inc, Bose Corporation, Haier Inc, Koninklijke Philips N V, Mitsubishi Electric Corporation*List Not Exhaustive.
3. What are the main segments of the Home Entertainment Product Market?
The market segments include Device, Distribution Channel.
4. Can you provide details about the market size?
The market size is estimated to be USD 308.60 Million as of 2022.
5. What are some drivers contributing to market growth?
Rising Popularity of IoT Connected Devices; Growing Number of Gaming Population Globally.
6. What are the notable trends driving market growth?
Gaming Consoles Gaining Popularity.
7. Are there any restraints impacting market growth?
Rising Popularity of IoT Connected Devices; Growing Number of Gaming Population Globally.
8. Can you provide examples of recent developments in the market?
July 2024: Evolution Malta Holding Limited, a wholly-owned subsidiary of Evolution AB (publ), signed an agreement to acquire Galaxy Gaming Inc. This move aligns with Evolution's strategy to become the world's premier provider of casino games, delivering top-tier gaming content to its clientele. By acquiring Galaxy Gaming, Evolution strengthens its foothold in the US market and bolsters its status as a dominant licensor of proprietary table games within the online gaming sector.May 2024: ASUS revealed plans to unveil its ROG Ally X handheld gaming console on June 2. Similar to its predecessor, the ROG Ally, the new X edition will run on the Windows 11 platform and be driven by the AMD Z1 Extreme chipset. In addition, ASUS has stated that the console will feature a 7-inch LCD display with a 120Hz refresh rate and will be available in a sleek black finish.April 2024: Sony is renewing BRAVIA as a brand for watching movies to enrich the ultimate home cinema experience. With the expansion of streaming services, watching movies in the comfort of the home has gained in popularity. Sony’s wide variety of products, such as digital cinema cameras, professional monitors, and professional headphones, have been widely utilized by film production professionals, allowing the company to deeply understand the cinema industry and the intentions of filmmakers and content creators. New BRAVIA further enhances the sense of reality of cinematic content and delivers outstanding picture and sound quality at home so that people can enjoy films with much of the same magic of the big screen.February 2024: Walmart, the US-based retail giant, announced its acquisition of smart TV manufacturer Vizio for a whopping USD 2.3 billion. Historically, Walmart has been a significant retailer of Vizio TVs. With this acquisition, Walmart aims to leverage "a profitable advertising business that is rapidly scaling via Vizio SmartCast OS," as stated by the company.
9. What pricing options are available for accessing the report?
Pricing options include single-user, multi-user, and enterprise licenses priced at USD 3800, USD 4500, and USD 5800 respectively.
10. Is the market size provided in terms of value or volume?
The market size is provided in terms of value, measured in Million and volume, measured in Billion.
11. Are there any specific market keywords associated with the report?
Yes, the market keyword associated with the report is "Home Entertainment Product Market," which aids in identifying and referencing the specific market segment covered.
12. How do I determine which pricing option suits my needs best?
The pricing options vary based on user requirements and access needs. Individual users may opt for single-user licenses, while businesses requiring broader access may choose multi-user or enterprise licenses for cost-effective access to the report.
13. Are there any additional resources or data provided in the Home Entertainment Product Market report?
While the report offers comprehensive insights, it's advisable to review the specific contents or supplementary materials provided to ascertain if additional resources or data are available.
14. How can I stay updated on further developments or reports in the Home Entertainment Product Market?
To stay informed about further developments, trends, and reports in the Home Entertainment Product Market, consider subscribing to industry newsletters, following relevant companies and organizations, or regularly checking reputable industry news sources and publications.
Methodology
Step 1 - Identification of Relevant Samples Size from Population Database


Step 2 - Approaches for Defining Global Market Size (Value, Volume* & Price*)

Note*: In applicable scenarios
Step 3 - Data Sources
Primary Research
- Web Analytics
- Survey Reports
- Research Institute
- Latest Research Reports
- Opinion Leaders
Secondary Research
- Annual Reports
- White Paper
- Latest Press Release
- Industry Association
- Paid Database
- Investor Presentations

Step 4 - Data Triangulation
Involves using different sources of information in order to increase the validity of a study
These sources are likely to be stakeholders in a program - participants, other researchers, program staff, other community members, and so on.
Then we put all data in single framework & apply various statistical tools to find out the dynamic on the market.
During the analysis stage, feedback from the stakeholder groups would be compared to determine areas of agreement as well as areas of divergence
