

Key Insights
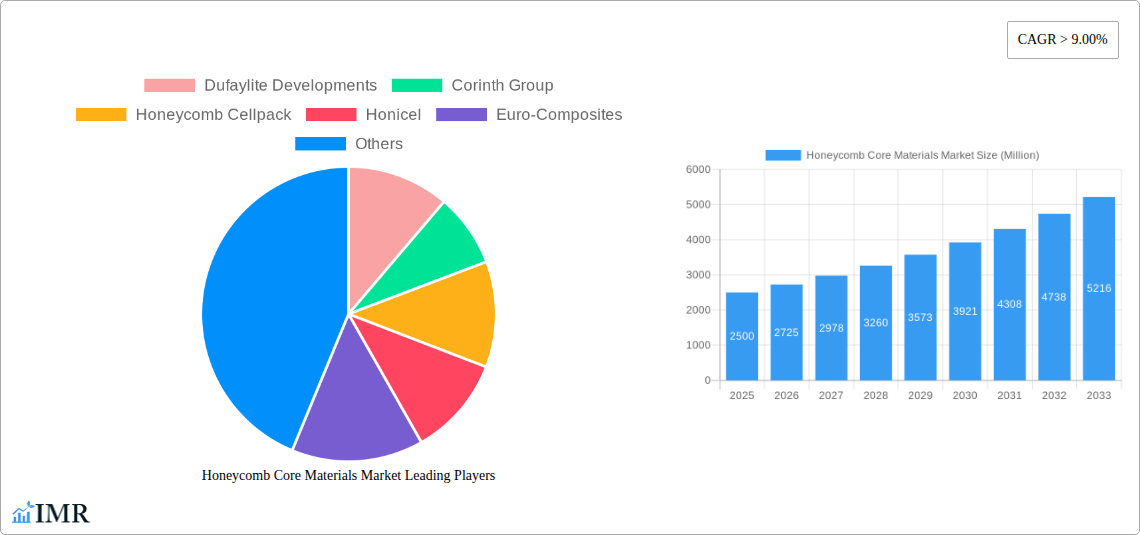
The Honeycomb Core Materials market is experiencing robust growth, projected to maintain a Compound Annual Growth Rate (CAGR) exceeding 9% from 2025 to 2033. This expansion is driven by increasing demand across key end-user industries, particularly aerospace and defense, where lightweight yet high-strength materials are crucial for enhancing fuel efficiency and performance. The rising adoption of honeycomb structures in marine applications and the burgeoning renewable energy sector further contribute to market expansion. Technological advancements in materials science, leading to the development of novel honeycomb core materials like advanced thermoplastics with improved properties, are fueling innovation and expanding market possibilities. While the market faces certain restraints, such as the high initial cost of production and potential supply chain disruptions, these are mitigated by the long-term benefits of using honeycomb cores in various applications. The market segmentation reveals a strong preference for Nomex and Aluminum honeycomb cores, largely due to their established performance and reliability in demanding environments. However, the thermoplastic segment exhibits significant growth potential due to its inherent advantages like recyclability and design flexibility. Geographically, North America and Europe currently dominate the market, although the Asia-Pacific region is expected to witness the fastest growth driven by increasing infrastructure development and rising industrialization. Companies like Hexcel Corporation and Ten Cate are key players, showcasing strong innovation and market presence. The market is characterized by both established players and specialized niche manufacturers, contributing to a dynamic and competitive landscape.
The forecast for the Honeycomb Core Materials market anticipates continued expansion, driven by technological innovations and rising demand from various sectors. The ongoing trend of lightweighting across industries will continue to fuel demand for honeycomb structures. Furthermore, the increasing focus on sustainability is likely to propel the adoption of recyclable thermoplastic honeycomb cores. Competitive pressures are expected to remain strong, with companies investing in research and development to enhance product performance and expand their market share. Geographic expansion, particularly in rapidly developing economies, will create significant growth opportunities. Strategic partnerships and mergers and acquisitions will likely shape the market landscape, as companies strive to achieve economies of scale and diversify their product portfolios. The market's future trajectory points towards significant growth, driven by continuous technological advancements, and increasing demand from aerospace, defense, and other emerging sectors.
Honeycomb Core Materials Market: A Comprehensive Report (2019-2033)
This comprehensive report provides an in-depth analysis of the Honeycomb Core Materials market, encompassing market dynamics, growth trends, regional dominance, product landscape, and key players. The study period spans from 2019 to 2033, with 2025 as the base and estimated year. The forecast period covers 2025-2033, and the historical period is 2019-2024. This report is essential for industry professionals, investors, and strategists seeking to understand and capitalize on opportunities within this dynamic market. The report analyzes both the parent market (Advanced Materials) and the child market (Honeycomb Core Materials) to provide a holistic view.
Honeycomb Core Materials Market Dynamics & Structure
The Honeycomb Core Materials market is characterized by moderate concentration, with key players holding significant market share. Technological innovation, particularly in lightweighting materials for aerospace and automotive applications, is a primary growth driver. Stringent regulatory frameworks, particularly concerning environmental impact and safety standards, significantly influence market dynamics. Competitive product substitutes, such as foam cores, pose a challenge, necessitating continuous product differentiation and innovation. End-user demographics are shifting towards industries prioritizing lightweighting and enhanced performance, driving demand for advanced honeycomb core materials. M&A activity in the sector has been moderate in recent years, with approximately xx deals valued at xx Million between 2019 and 2024. Innovation barriers include high R&D costs and complexities in material science.
- Market Concentration: Moderately concentrated, with top 5 players holding approximately xx% market share in 2024.
- Technological Innovation: Focus on lightweight, high-strength materials, with significant R&D in advanced composites.
- Regulatory Framework: Stringent environmental and safety regulations influence material selection and manufacturing processes.
- Competitive Substitutes: Foam cores and other lightweight materials pose competition.
- End-User Demographics: Growing demand from Aerospace, Defense, and Automotive sectors.
- M&A Activity: Moderate activity, with xx deals completed between 2019 and 2024.
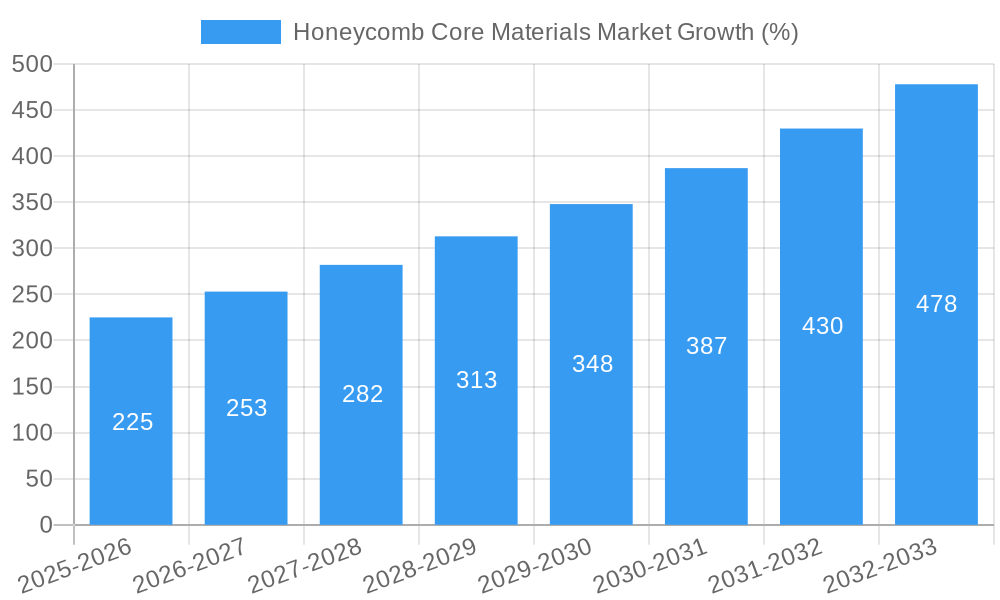
Honeycomb Core Materials Market Growth Trends & Insights
The global Honeycomb Core Materials market is projected to experience substantial growth during the forecast period (2025-2033). Driven by increasing demand from the aerospace and automotive industries, the market is expected to reach xx Million by 2033, exhibiting a CAGR of xx% from 2025 to 2033. The adoption rate of honeycomb core materials is increasing steadily due to their superior strength-to-weight ratio and energy absorption capabilities. Technological disruptions, such as the development of new composite materials and improved manufacturing processes, further fuel market expansion. Consumer behavior shifts towards sustainable and lightweight products are also contributing factors. Market penetration in emerging economies is projected to increase significantly, further boosting market growth. The transition to electric vehicles (EVs) is expected to drive demand in the automotive sector.
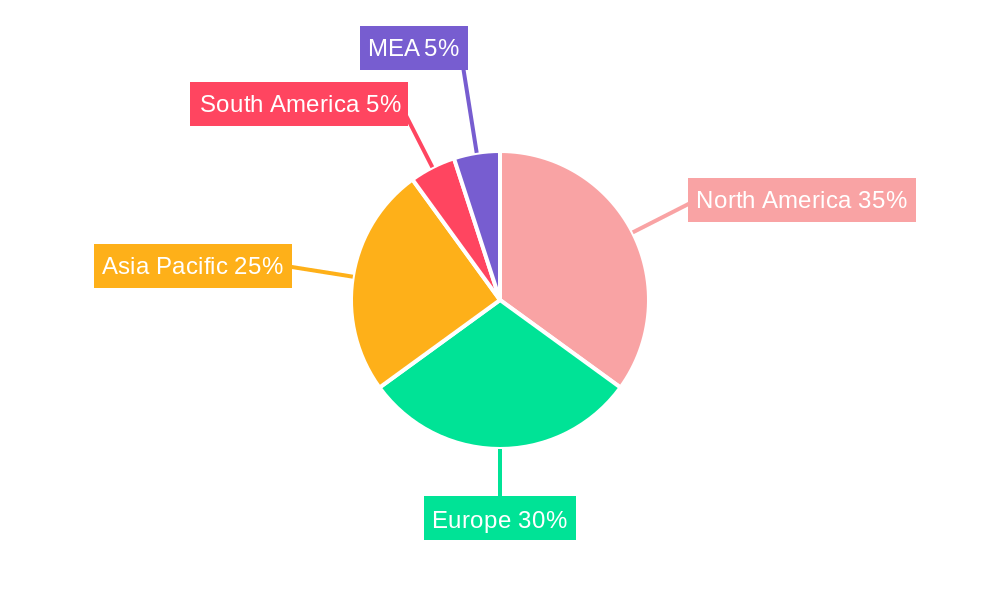
Dominant Regions, Countries, or Segments in Honeycomb Core Materials Market
North America currently holds the largest market share in the Honeycomb Core Materials market, driven by the strong presence of major aerospace and defense companies and a robust manufacturing base. The Aerospace segment, specifically within North America, is a significant contributor due to high demand for lightweight and high-performance materials in aircraft construction. Europe follows closely, exhibiting strong growth driven by investments in renewable energy infrastructure. Within product types, the Aluminum segment dominates due to its cost-effectiveness and wide applicability.
- Key Drivers: High demand from aerospace and defense sectors in North America; growth of renewable energy in Europe; cost-effectiveness of aluminum in various applications.
- Dominance Factors: Strong manufacturing base in North America; high R&D spending in Europe; wide applicability and cost-effectiveness of aluminum.
- Growth Potential: Significant growth potential in emerging economies (Asia-Pacific, South America) due to expanding infrastructure and manufacturing sectors.
Honeycomb Core Materials Market Product Landscape
The Honeycomb Core Materials market offers a diverse range of products, including Nomex, Aluminum, Thermoplastics, and other specialized materials. Innovations focus on enhanced mechanical properties, improved durability, and reduced weight. Advanced manufacturing techniques, such as automated fiber placement (AFP) and resin transfer molding (RTM), are transforming the industry. Unique selling propositions center around superior strength-to-weight ratios, energy absorption, and design flexibility. The development of high-temperature resistant materials is driving growth in aerospace applications.
Key Drivers, Barriers & Challenges in Honeycomb Core Materials Market
Key Drivers: Increasing demand for lightweight materials in aerospace and automotive applications; growing adoption in renewable energy sectors; technological advancements in material science.
Challenges & Restraints: High raw material costs; fluctuating energy prices; supply chain disruptions; stringent environmental regulations; intense competition from substitute materials. These challenges contribute to an estimated xx% reduction in market growth during periods of significant supply chain disruption.
Emerging Opportunities in Honeycomb Core Materials Market
Emerging opportunities include the expansion into new applications, such as construction and medical devices. The development of biodegradable and sustainable honeycomb core materials presents a significant market opportunity. Untapped markets in developing economies offer significant growth potential. Customizable solutions tailored to specific applications are gaining traction, driving market growth.
Growth Accelerators in the Honeycomb Core Materials Market Industry
Technological breakthroughs in material science are driving market expansion. Strategic partnerships and collaborations between material suppliers and end-users are fostering innovation. Expansion into new geographical markets, particularly in Asia and South America, are generating significant growth. The development of new manufacturing technologies, such as additive manufacturing, promises to further enhance production efficiency.
Key Players Shaping the Honeycomb Core Materials Market Market
- Dufaylite Developments
- Corinth Group
- Honeycomb Cellpack
- Honicel
- Euro-Composites
- Grigeo
- Thermhex Waben GmbH
- Samia Canada
- The Gill Corporation
- Hexcel Corporation
- Argosy International
- Koninklijke Ten Cate BV
- Packaging Corporation of America
- Axxion Group
- Tubus Baer GmbH
Notable Milestones in Honeycomb Core Materials Market Sector
- January 2022: FITS Air, a honeycomb panel technology, reaches TRL 6, showcasing significant advancements in material properties and panel size (1.28 m x 1.48 m).
- December 2021: Hexcel Corp. and Metyx Composites partner to produce high-performance carbon fiber profiles for the wind energy sector, expanding applications beyond traditional aerospace and defense.
In-Depth Honeycomb Core Materials Market Market Outlook
The Honeycomb Core Materials market exhibits strong long-term growth potential, driven by continuous technological advancements, expansion into new applications, and increasing demand from various industries. Strategic partnerships and collaborations will play a vital role in shaping future market dynamics. The market is poised for significant expansion in emerging economies, and the development of sustainable and recyclable materials will drive future growth. The ongoing shift towards lightweighting and enhanced performance in diverse sectors ensures a promising outlook for the years to come.
Honeycomb Core Materials Market Segmentation
-
1. Product Type
- 1.1. Nomex
- 1.2. Aluminum
- 1.3. Thermoplastics
- 1.4. Other Product Types
-
2. End-user Industry
- 2.1. Aerospace
- 2.2. Defense
- 2.3. Marine
- 2.4. Other End-user Industries
Honeycomb Core Materials Market Segmentation By Geography
-
1. Asia Pacific
- 1.1. China
- 1.2. India
- 1.3. Japan
- 1.4. South Korea
- 1.5. Rest of Asia Pacific
-
2. North America
- 2.1. United States
- 2.2. Canada
- 2.3. Mexico
-
3. Europe
- 3.1. Germany
- 3.2. United Kingdom
- 3.3. Italy
- 3.4. France
- 3.5. Rest of Europe
-
4. South America
- 4.1. Brazil
- 4.2. Argentina
- 4.3. Rest of South America
-
5. Middle East and Africa
- 5.1. Saudi Arabia
- 5.2. South Africa
- 5.3. Rest of Middle East and Africa
Honeycomb Core Materials Market REPORT HIGHLIGHTS
| Aspects | Details |
|---|---|
| Study Period | 2019-2033 |
| Base Year | 2024 |
| Estimated Year | 2025 |
| Forecast Period | 2025-2033 |
| Historical Period | 2019-2024 |
| Growth Rate | CAGR of > 9.00% from 2019-2033 |
| Segmentation |
|
Table of Contents
- 1. Introduction
- 1.1. Research Scope
- 1.2. Market Segmentation
- 1.3. Research Methodology
- 1.4. Definitions and Assumptions
- 2. Executive Summary
- 2.1. Introduction
- 3. Market Dynamics
- 3.1. Introduction
- 3.2. Market Drivers
- 3.2.1. Increasing Demand for Lightweight Materials for Fuel Efficiency; Other Drivers
- 3.3. Market Restrains
- 3.3.1. Absorption of Water and Moisture; Significant Cost of the Products; Structural Limitations of Honeycomb Core Materials
- 3.4. Market Trends
- 3.4.1. Aerospace Sector to Dominate the Market
- 4. Market Factor Analysis
- 4.1. Porters Five Forces
- 4.2. Supply/Value Chain
- 4.3. PESTEL analysis
- 4.4. Market Entropy
- 4.5. Patent/Trademark Analysis
- 5. Global Honeycomb Core Materials Market Analysis, Insights and Forecast, 2019-2031
- 5.1. Market Analysis, Insights and Forecast - by Product Type
- 5.1.1. Nomex
- 5.1.2. Aluminum
- 5.1.3. Thermoplastics
- 5.1.4. Other Product Types
- 5.2. Market Analysis, Insights and Forecast - by End-user Industry
- 5.2.1. Aerospace
- 5.2.2. Defense
- 5.2.3. Marine
- 5.2.4. Other End-user Industries
- 5.3. Market Analysis, Insights and Forecast - by Region
- 5.3.1. Asia Pacific
- 5.3.2. North America
- 5.3.3. Europe
- 5.3.4. South America
- 5.3.5. Middle East and Africa
- 5.1. Market Analysis, Insights and Forecast - by Product Type
- 6. Asia Pacific Honeycomb Core Materials Market Analysis, Insights and Forecast, 2019-2031
- 6.1. Market Analysis, Insights and Forecast - by Product Type
- 6.1.1. Nomex
- 6.1.2. Aluminum
- 6.1.3. Thermoplastics
- 6.1.4. Other Product Types
- 6.2. Market Analysis, Insights and Forecast - by End-user Industry
- 6.2.1. Aerospace
- 6.2.2. Defense
- 6.2.3. Marine
- 6.2.4. Other End-user Industries
- 6.1. Market Analysis, Insights and Forecast - by Product Type
- 7. North America Honeycomb Core Materials Market Analysis, Insights and Forecast, 2019-2031
- 7.1. Market Analysis, Insights and Forecast - by Product Type
- 7.1.1. Nomex
- 7.1.2. Aluminum
- 7.1.3. Thermoplastics
- 7.1.4. Other Product Types
- 7.2. Market Analysis, Insights and Forecast - by End-user Industry
- 7.2.1. Aerospace
- 7.2.2. Defense
- 7.2.3. Marine
- 7.2.4. Other End-user Industries
- 7.1. Market Analysis, Insights and Forecast - by Product Type
- 8. Europe Honeycomb Core Materials Market Analysis, Insights and Forecast, 2019-2031
- 8.1. Market Analysis, Insights and Forecast - by Product Type
- 8.1.1. Nomex
- 8.1.2. Aluminum
- 8.1.3. Thermoplastics
- 8.1.4. Other Product Types
- 8.2. Market Analysis, Insights and Forecast - by End-user Industry
- 8.2.1. Aerospace
- 8.2.2. Defense
- 8.2.3. Marine
- 8.2.4. Other End-user Industries
- 8.1. Market Analysis, Insights and Forecast - by Product Type
- 9. South America Honeycomb Core Materials Market Analysis, Insights and Forecast, 2019-2031
- 9.1. Market Analysis, Insights and Forecast - by Product Type
- 9.1.1. Nomex
- 9.1.2. Aluminum
- 9.1.3. Thermoplastics
- 9.1.4. Other Product Types
- 9.2. Market Analysis, Insights and Forecast - by End-user Industry
- 9.2.1. Aerospace
- 9.2.2. Defense
- 9.2.3. Marine
- 9.2.4. Other End-user Industries
- 9.1. Market Analysis, Insights and Forecast - by Product Type
- 10. Middle East and Africa Honeycomb Core Materials Market Analysis, Insights and Forecast, 2019-2031
- 10.1. Market Analysis, Insights and Forecast - by Product Type
- 10.1.1. Nomex
- 10.1.2. Aluminum
- 10.1.3. Thermoplastics
- 10.1.4. Other Product Types
- 10.2. Market Analysis, Insights and Forecast - by End-user Industry
- 10.2.1. Aerospace
- 10.2.2. Defense
- 10.2.3. Marine
- 10.2.4. Other End-user Industries
- 10.1. Market Analysis, Insights and Forecast - by Product Type
- 11. North America Honeycomb Core Materials Market Analysis, Insights and Forecast, 2019-2031
- 11.1. Market Analysis, Insights and Forecast - By Country/Sub-region
- 11.1.1 United States
- 11.1.2 Canada
- 11.1.3 Mexico
- 12. Europe Honeycomb Core Materials Market Analysis, Insights and Forecast, 2019-2031
- 12.1. Market Analysis, Insights and Forecast - By Country/Sub-region
- 12.1.1 Germany
- 12.1.2 France
- 12.1.3 Italy
- 12.1.4 United Kingdom
- 12.1.5 Netherlands
- 12.1.6 Rest of Europe
- 13. Asia Pacific Honeycomb Core Materials Market Analysis, Insights and Forecast, 2019-2031
- 13.1. Market Analysis, Insights and Forecast - By Country/Sub-region
- 13.1.1 China
- 13.1.2 Japan
- 13.1.3 India
- 13.1.4 South Korea
- 13.1.5 Taiwan
- 13.1.6 Australia
- 13.1.7 Rest of Asia-Pacific
- 14. South America Honeycomb Core Materials Market Analysis, Insights and Forecast, 2019-2031
- 14.1. Market Analysis, Insights and Forecast - By Country/Sub-region
- 14.1.1 Brazil
- 14.1.2 Argentina
- 14.1.3 Rest of South America
- 15. MEA Honeycomb Core Materials Market Analysis, Insights and Forecast, 2019-2031
- 15.1. Market Analysis, Insights and Forecast - By Country/Sub-region
- 15.1.1 Middle East
- 15.1.2 Africa
- 16. Competitive Analysis
- 16.1. Global Market Share Analysis 2024
- 16.2. Company Profiles
- 16.2.1 Dufaylite Developments
- 16.2.1.1. Overview
- 16.2.1.2. Products
- 16.2.1.3. SWOT Analysis
- 16.2.1.4. Recent Developments
- 16.2.1.5. Financials (Based on Availability)
- 16.2.2 Corinth Group
- 16.2.2.1. Overview
- 16.2.2.2. Products
- 16.2.2.3. SWOT Analysis
- 16.2.2.4. Recent Developments
- 16.2.2.5. Financials (Based on Availability)
- 16.2.3 Honeycomb Cellpack
- 16.2.3.1. Overview
- 16.2.3.2. Products
- 16.2.3.3. SWOT Analysis
- 16.2.3.4. Recent Developments
- 16.2.3.5. Financials (Based on Availability)
- 16.2.4 Honicel
- 16.2.4.1. Overview
- 16.2.4.2. Products
- 16.2.4.3. SWOT Analysis
- 16.2.4.4. Recent Developments
- 16.2.4.5. Financials (Based on Availability)
- 16.2.5 Euro-Composites
- 16.2.5.1. Overview
- 16.2.5.2. Products
- 16.2.5.3. SWOT Analysis
- 16.2.5.4. Recent Developments
- 16.2.5.5. Financials (Based on Availability)
- 16.2.6 Grigeo
- 16.2.6.1. Overview
- 16.2.6.2. Products
- 16.2.6.3. SWOT Analysis
- 16.2.6.4. Recent Developments
- 16.2.6.5. Financials (Based on Availability)
- 16.2.7 Thermhex Waben GmbH
- 16.2.7.1. Overview
- 16.2.7.2. Products
- 16.2.7.3. SWOT Analysis
- 16.2.7.4. Recent Developments
- 16.2.7.5. Financials (Based on Availability)
- 16.2.8 Samia Canada
- 16.2.8.1. Overview
- 16.2.8.2. Products
- 16.2.8.3. SWOT Analysis
- 16.2.8.4. Recent Developments
- 16.2.8.5. Financials (Based on Availability)
- 16.2.9 The Gill Corporation
- 16.2.9.1. Overview
- 16.2.9.2. Products
- 16.2.9.3. SWOT Analysis
- 16.2.9.4. Recent Developments
- 16.2.9.5. Financials (Based on Availability)
- 16.2.10 Hexcel Corporation
- 16.2.10.1. Overview
- 16.2.10.2. Products
- 16.2.10.3. SWOT Analysis
- 16.2.10.4. Recent Developments
- 16.2.10.5. Financials (Based on Availability)
- 16.2.11 Argosy International
- 16.2.11.1. Overview
- 16.2.11.2. Products
- 16.2.11.3. SWOT Analysis
- 16.2.11.4. Recent Developments
- 16.2.11.5. Financials (Based on Availability)
- 16.2.12 Koninklijke Ten Cate BV
- 16.2.12.1. Overview
- 16.2.12.2. Products
- 16.2.12.3. SWOT Analysis
- 16.2.12.4. Recent Developments
- 16.2.12.5. Financials (Based on Availability)
- 16.2.13 Packaging Corporation of America
- 16.2.13.1. Overview
- 16.2.13.2. Products
- 16.2.13.3. SWOT Analysis
- 16.2.13.4. Recent Developments
- 16.2.13.5. Financials (Based on Availability)
- 16.2.14 Axxion Group
- 16.2.14.1. Overview
- 16.2.14.2. Products
- 16.2.14.3. SWOT Analysis
- 16.2.14.4. Recent Developments
- 16.2.14.5. Financials (Based on Availability)
- 16.2.15 Tubus Baer GmbH
- 16.2.15.1. Overview
- 16.2.15.2. Products
- 16.2.15.3. SWOT Analysis
- 16.2.15.4. Recent Developments
- 16.2.15.5. Financials (Based on Availability)
- 16.2.1 Dufaylite Developments
List of Figures
- Figure 1: Global Honeycomb Core Materials Market Revenue Breakdown (Million, %) by Region 2024 & 2032
- Figure 2: Global Honeycomb Core Materials Market Volume Breakdown (K Tons, %) by Region 2024 & 2032
- Figure 3: North America Honeycomb Core Materials Market Revenue (Million), by Country 2024 & 2032
- Figure 4: North America Honeycomb Core Materials Market Volume (K Tons), by Country 2024 & 2032
- Figure 5: North America Honeycomb Core Materials Market Revenue Share (%), by Country 2024 & 2032
- Figure 6: North America Honeycomb Core Materials Market Volume Share (%), by Country 2024 & 2032
- Figure 7: Europe Honeycomb Core Materials Market Revenue (Million), by Country 2024 & 2032
- Figure 8: Europe Honeycomb Core Materials Market Volume (K Tons), by Country 2024 & 2032
- Figure 9: Europe Honeycomb Core Materials Market Revenue Share (%), by Country 2024 & 2032
- Figure 10: Europe Honeycomb Core Materials Market Volume Share (%), by Country 2024 & 2032
- Figure 11: Asia Pacific Honeycomb Core Materials Market Revenue (Million), by Country 2024 & 2032
- Figure 12: Asia Pacific Honeycomb Core Materials Market Volume (K Tons), by Country 2024 & 2032
- Figure 13: Asia Pacific Honeycomb Core Materials Market Revenue Share (%), by Country 2024 & 2032
- Figure 14: Asia Pacific Honeycomb Core Materials Market Volume Share (%), by Country 2024 & 2032
- Figure 15: South America Honeycomb Core Materials Market Revenue (Million), by Country 2024 & 2032
- Figure 16: South America Honeycomb Core Materials Market Volume (K Tons), by Country 2024 & 2032
- Figure 17: South America Honeycomb Core Materials Market Revenue Share (%), by Country 2024 & 2032
- Figure 18: South America Honeycomb Core Materials Market Volume Share (%), by Country 2024 & 2032
- Figure 19: MEA Honeycomb Core Materials Market Revenue (Million), by Country 2024 & 2032
- Figure 20: MEA Honeycomb Core Materials Market Volume (K Tons), by Country 2024 & 2032
- Figure 21: MEA Honeycomb Core Materials Market Revenue Share (%), by Country 2024 & 2032
- Figure 22: MEA Honeycomb Core Materials Market Volume Share (%), by Country 2024 & 2032
- Figure 23: Asia Pacific Honeycomb Core Materials Market Revenue (Million), by Product Type 2024 & 2032
- Figure 24: Asia Pacific Honeycomb Core Materials Market Volume (K Tons), by Product Type 2024 & 2032
- Figure 25: Asia Pacific Honeycomb Core Materials Market Revenue Share (%), by Product Type 2024 & 2032
- Figure 26: Asia Pacific Honeycomb Core Materials Market Volume Share (%), by Product Type 2024 & 2032
- Figure 27: Asia Pacific Honeycomb Core Materials Market Revenue (Million), by End-user Industry 2024 & 2032
- Figure 28: Asia Pacific Honeycomb Core Materials Market Volume (K Tons), by End-user Industry 2024 & 2032
- Figure 29: Asia Pacific Honeycomb Core Materials Market Revenue Share (%), by End-user Industry 2024 & 2032
- Figure 30: Asia Pacific Honeycomb Core Materials Market Volume Share (%), by End-user Industry 2024 & 2032
- Figure 31: Asia Pacific Honeycomb Core Materials Market Revenue (Million), by Country 2024 & 2032
- Figure 32: Asia Pacific Honeycomb Core Materials Market Volume (K Tons), by Country 2024 & 2032
- Figure 33: Asia Pacific Honeycomb Core Materials Market Revenue Share (%), by Country 2024 & 2032
- Figure 34: Asia Pacific Honeycomb Core Materials Market Volume Share (%), by Country 2024 & 2032
- Figure 35: North America Honeycomb Core Materials Market Revenue (Million), by Product Type 2024 & 2032
- Figure 36: North America Honeycomb Core Materials Market Volume (K Tons), by Product Type 2024 & 2032
- Figure 37: North America Honeycomb Core Materials Market Revenue Share (%), by Product Type 2024 & 2032
- Figure 38: North America Honeycomb Core Materials Market Volume Share (%), by Product Type 2024 & 2032
- Figure 39: North America Honeycomb Core Materials Market Revenue (Million), by End-user Industry 2024 & 2032
- Figure 40: North America Honeycomb Core Materials Market Volume (K Tons), by End-user Industry 2024 & 2032
- Figure 41: North America Honeycomb Core Materials Market Revenue Share (%), by End-user Industry 2024 & 2032
- Figure 42: North America Honeycomb Core Materials Market Volume Share (%), by End-user Industry 2024 & 2032
- Figure 43: North America Honeycomb Core Materials Market Revenue (Million), by Country 2024 & 2032
- Figure 44: North America Honeycomb Core Materials Market Volume (K Tons), by Country 2024 & 2032
- Figure 45: North America Honeycomb Core Materials Market Revenue Share (%), by Country 2024 & 2032
- Figure 46: North America Honeycomb Core Materials Market Volume Share (%), by Country 2024 & 2032
- Figure 47: Europe Honeycomb Core Materials Market Revenue (Million), by Product Type 2024 & 2032
- Figure 48: Europe Honeycomb Core Materials Market Volume (K Tons), by Product Type 2024 & 2032
- Figure 49: Europe Honeycomb Core Materials Market Revenue Share (%), by Product Type 2024 & 2032
- Figure 50: Europe Honeycomb Core Materials Market Volume Share (%), by Product Type 2024 & 2032
- Figure 51: Europe Honeycomb Core Materials Market Revenue (Million), by End-user Industry 2024 & 2032
- Figure 52: Europe Honeycomb Core Materials Market Volume (K Tons), by End-user Industry 2024 & 2032
- Figure 53: Europe Honeycomb Core Materials Market Revenue Share (%), by End-user Industry 2024 & 2032
- Figure 54: Europe Honeycomb Core Materials Market Volume Share (%), by End-user Industry 2024 & 2032
- Figure 55: Europe Honeycomb Core Materials Market Revenue (Million), by Country 2024 & 2032
- Figure 56: Europe Honeycomb Core Materials Market Volume (K Tons), by Country 2024 & 2032
- Figure 57: Europe Honeycomb Core Materials Market Revenue Share (%), by Country 2024 & 2032
- Figure 58: Europe Honeycomb Core Materials Market Volume Share (%), by Country 2024 & 2032
- Figure 59: South America Honeycomb Core Materials Market Revenue (Million), by Product Type 2024 & 2032
- Figure 60: South America Honeycomb Core Materials Market Volume (K Tons), by Product Type 2024 & 2032
- Figure 61: South America Honeycomb Core Materials Market Revenue Share (%), by Product Type 2024 & 2032
- Figure 62: South America Honeycomb Core Materials Market Volume Share (%), by Product Type 2024 & 2032
- Figure 63: South America Honeycomb Core Materials Market Revenue (Million), by End-user Industry 2024 & 2032
- Figure 64: South America Honeycomb Core Materials Market Volume (K Tons), by End-user Industry 2024 & 2032
- Figure 65: South America Honeycomb Core Materials Market Revenue Share (%), by End-user Industry 2024 & 2032
- Figure 66: South America Honeycomb Core Materials Market Volume Share (%), by End-user Industry 2024 & 2032
- Figure 67: South America Honeycomb Core Materials Market Revenue (Million), by Country 2024 & 2032
- Figure 68: South America Honeycomb Core Materials Market Volume (K Tons), by Country 2024 & 2032
- Figure 69: South America Honeycomb Core Materials Market Revenue Share (%), by Country 2024 & 2032
- Figure 70: South America Honeycomb Core Materials Market Volume Share (%), by Country 2024 & 2032
- Figure 71: Middle East and Africa Honeycomb Core Materials Market Revenue (Million), by Product Type 2024 & 2032
- Figure 72: Middle East and Africa Honeycomb Core Materials Market Volume (K Tons), by Product Type 2024 & 2032
- Figure 73: Middle East and Africa Honeycomb Core Materials Market Revenue Share (%), by Product Type 2024 & 2032
- Figure 74: Middle East and Africa Honeycomb Core Materials Market Volume Share (%), by Product Type 2024 & 2032
- Figure 75: Middle East and Africa Honeycomb Core Materials Market Revenue (Million), by End-user Industry 2024 & 2032
- Figure 76: Middle East and Africa Honeycomb Core Materials Market Volume (K Tons), by End-user Industry 2024 & 2032
- Figure 77: Middle East and Africa Honeycomb Core Materials Market Revenue Share (%), by End-user Industry 2024 & 2032
- Figure 78: Middle East and Africa Honeycomb Core Materials Market Volume Share (%), by End-user Industry 2024 & 2032
- Figure 79: Middle East and Africa Honeycomb Core Materials Market Revenue (Million), by Country 2024 & 2032
- Figure 80: Middle East and Africa Honeycomb Core Materials Market Volume (K Tons), by Country 2024 & 2032
- Figure 81: Middle East and Africa Honeycomb Core Materials Market Revenue Share (%), by Country 2024 & 2032
- Figure 82: Middle East and Africa Honeycomb Core Materials Market Volume Share (%), by Country 2024 & 2032
List of Tables
- Table 1: Global Honeycomb Core Materials Market Revenue Million Forecast, by Region 2019 & 2032
- Table 2: Global Honeycomb Core Materials Market Volume K Tons Forecast, by Region 2019 & 2032
- Table 3: Global Honeycomb Core Materials Market Revenue Million Forecast, by Product Type 2019 & 2032
- Table 4: Global Honeycomb Core Materials Market Volume K Tons Forecast, by Product Type 2019 & 2032
- Table 5: Global Honeycomb Core Materials Market Revenue Million Forecast, by End-user Industry 2019 & 2032
- Table 6: Global Honeycomb Core Materials Market Volume K Tons Forecast, by End-user Industry 2019 & 2032
- Table 7: Global Honeycomb Core Materials Market Revenue Million Forecast, by Region 2019 & 2032
- Table 8: Global Honeycomb Core Materials Market Volume K Tons Forecast, by Region 2019 & 2032
- Table 9: Global Honeycomb Core Materials Market Revenue Million Forecast, by Country 2019 & 2032
- Table 10: Global Honeycomb Core Materials Market Volume K Tons Forecast, by Country 2019 & 2032
- Table 11: United States Honeycomb Core Materials Market Revenue (Million) Forecast, by Application 2019 & 2032
- Table 12: United States Honeycomb Core Materials Market Volume (K Tons) Forecast, by Application 2019 & 2032
- Table 13: Canada Honeycomb Core Materials Market Revenue (Million) Forecast, by Application 2019 & 2032
- Table 14: Canada Honeycomb Core Materials Market Volume (K Tons) Forecast, by Application 2019 & 2032
- Table 15: Mexico Honeycomb Core Materials Market Revenue (Million) Forecast, by Application 2019 & 2032
- Table 16: Mexico Honeycomb Core Materials Market Volume (K Tons) Forecast, by Application 2019 & 2032
- Table 17: Global Honeycomb Core Materials Market Revenue Million Forecast, by Country 2019 & 2032
- Table 18: Global Honeycomb Core Materials Market Volume K Tons Forecast, by Country 2019 & 2032
- Table 19: Germany Honeycomb Core Materials Market Revenue (Million) Forecast, by Application 2019 & 2032
- Table 20: Germany Honeycomb Core Materials Market Volume (K Tons) Forecast, by Application 2019 & 2032
- Table 21: France Honeycomb Core Materials Market Revenue (Million) Forecast, by Application 2019 & 2032
- Table 22: France Honeycomb Core Materials Market Volume (K Tons) Forecast, by Application 2019 & 2032
- Table 23: Italy Honeycomb Core Materials Market Revenue (Million) Forecast, by Application 2019 & 2032
- Table 24: Italy Honeycomb Core Materials Market Volume (K Tons) Forecast, by Application 2019 & 2032
- Table 25: United Kingdom Honeycomb Core Materials Market Revenue (Million) Forecast, by Application 2019 & 2032
- Table 26: United Kingdom Honeycomb Core Materials Market Volume (K Tons) Forecast, by Application 2019 & 2032
- Table 27: Netherlands Honeycomb Core Materials Market Revenue (Million) Forecast, by Application 2019 & 2032
- Table 28: Netherlands Honeycomb Core Materials Market Volume (K Tons) Forecast, by Application 2019 & 2032
- Table 29: Rest of Europe Honeycomb Core Materials Market Revenue (Million) Forecast, by Application 2019 & 2032
- Table 30: Rest of Europe Honeycomb Core Materials Market Volume (K Tons) Forecast, by Application 2019 & 2032
- Table 31: Global Honeycomb Core Materials Market Revenue Million Forecast, by Country 2019 & 2032
- Table 32: Global Honeycomb Core Materials Market Volume K Tons Forecast, by Country 2019 & 2032
- Table 33: China Honeycomb Core Materials Market Revenue (Million) Forecast, by Application 2019 & 2032
- Table 34: China Honeycomb Core Materials Market Volume (K Tons) Forecast, by Application 2019 & 2032
- Table 35: Japan Honeycomb Core Materials Market Revenue (Million) Forecast, by Application 2019 & 2032
- Table 36: Japan Honeycomb Core Materials Market Volume (K Tons) Forecast, by Application 2019 & 2032
- Table 37: India Honeycomb Core Materials Market Revenue (Million) Forecast, by Application 2019 & 2032
- Table 38: India Honeycomb Core Materials Market Volume (K Tons) Forecast, by Application 2019 & 2032
- Table 39: South Korea Honeycomb Core Materials Market Revenue (Million) Forecast, by Application 2019 & 2032
- Table 40: South Korea Honeycomb Core Materials Market Volume (K Tons) Forecast, by Application 2019 & 2032
- Table 41: Taiwan Honeycomb Core Materials Market Revenue (Million) Forecast, by Application 2019 & 2032
- Table 42: Taiwan Honeycomb Core Materials Market Volume (K Tons) Forecast, by Application 2019 & 2032
- Table 43: Australia Honeycomb Core Materials Market Revenue (Million) Forecast, by Application 2019 & 2032
- Table 44: Australia Honeycomb Core Materials Market Volume (K Tons) Forecast, by Application 2019 & 2032
- Table 45: Rest of Asia-Pacific Honeycomb Core Materials Market Revenue (Million) Forecast, by Application 2019 & 2032
- Table 46: Rest of Asia-Pacific Honeycomb Core Materials Market Volume (K Tons) Forecast, by Application 2019 & 2032
- Table 47: Global Honeycomb Core Materials Market Revenue Million Forecast, by Country 2019 & 2032
- Table 48: Global Honeycomb Core Materials Market Volume K Tons Forecast, by Country 2019 & 2032
- Table 49: Brazil Honeycomb Core Materials Market Revenue (Million) Forecast, by Application 2019 & 2032
- Table 50: Brazil Honeycomb Core Materials Market Volume (K Tons) Forecast, by Application 2019 & 2032
- Table 51: Argentina Honeycomb Core Materials Market Revenue (Million) Forecast, by Application 2019 & 2032
- Table 52: Argentina Honeycomb Core Materials Market Volume (K Tons) Forecast, by Application 2019 & 2032
- Table 53: Rest of South America Honeycomb Core Materials Market Revenue (Million) Forecast, by Application 2019 & 2032
- Table 54: Rest of South America Honeycomb Core Materials Market Volume (K Tons) Forecast, by Application 2019 & 2032
- Table 55: Global Honeycomb Core Materials Market Revenue Million Forecast, by Country 2019 & 2032
- Table 56: Global Honeycomb Core Materials Market Volume K Tons Forecast, by Country 2019 & 2032
- Table 57: Middle East Honeycomb Core Materials Market Revenue (Million) Forecast, by Application 2019 & 2032
- Table 58: Middle East Honeycomb Core Materials Market Volume (K Tons) Forecast, by Application 2019 & 2032
- Table 59: Africa Honeycomb Core Materials Market Revenue (Million) Forecast, by Application 2019 & 2032
- Table 60: Africa Honeycomb Core Materials Market Volume (K Tons) Forecast, by Application 2019 & 2032
- Table 61: Global Honeycomb Core Materials Market Revenue Million Forecast, by Product Type 2019 & 2032
- Table 62: Global Honeycomb Core Materials Market Volume K Tons Forecast, by Product Type 2019 & 2032
- Table 63: Global Honeycomb Core Materials Market Revenue Million Forecast, by End-user Industry 2019 & 2032
- Table 64: Global Honeycomb Core Materials Market Volume K Tons Forecast, by End-user Industry 2019 & 2032
- Table 65: Global Honeycomb Core Materials Market Revenue Million Forecast, by Country 2019 & 2032
- Table 66: Global Honeycomb Core Materials Market Volume K Tons Forecast, by Country 2019 & 2032
- Table 67: China Honeycomb Core Materials Market Revenue (Million) Forecast, by Application 2019 & 2032
- Table 68: China Honeycomb Core Materials Market Volume (K Tons) Forecast, by Application 2019 & 2032
- Table 69: India Honeycomb Core Materials Market Revenue (Million) Forecast, by Application 2019 & 2032
- Table 70: India Honeycomb Core Materials Market Volume (K Tons) Forecast, by Application 2019 & 2032
- Table 71: Japan Honeycomb Core Materials Market Revenue (Million) Forecast, by Application 2019 & 2032
- Table 72: Japan Honeycomb Core Materials Market Volume (K Tons) Forecast, by Application 2019 & 2032
- Table 73: South Korea Honeycomb Core Materials Market Revenue (Million) Forecast, by Application 2019 & 2032
- Table 74: South Korea Honeycomb Core Materials Market Volume (K Tons) Forecast, by Application 2019 & 2032
- Table 75: Rest of Asia Pacific Honeycomb Core Materials Market Revenue (Million) Forecast, by Application 2019 & 2032
- Table 76: Rest of Asia Pacific Honeycomb Core Materials Market Volume (K Tons) Forecast, by Application 2019 & 2032
- Table 77: Global Honeycomb Core Materials Market Revenue Million Forecast, by Product Type 2019 & 2032
- Table 78: Global Honeycomb Core Materials Market Volume K Tons Forecast, by Product Type 2019 & 2032
- Table 79: Global Honeycomb Core Materials Market Revenue Million Forecast, by End-user Industry 2019 & 2032
- Table 80: Global Honeycomb Core Materials Market Volume K Tons Forecast, by End-user Industry 2019 & 2032
- Table 81: Global Honeycomb Core Materials Market Revenue Million Forecast, by Country 2019 & 2032
- Table 82: Global Honeycomb Core Materials Market Volume K Tons Forecast, by Country 2019 & 2032
- Table 83: United States Honeycomb Core Materials Market Revenue (Million) Forecast, by Application 2019 & 2032
- Table 84: United States Honeycomb Core Materials Market Volume (K Tons) Forecast, by Application 2019 & 2032
- Table 85: Canada Honeycomb Core Materials Market Revenue (Million) Forecast, by Application 2019 & 2032
- Table 86: Canada Honeycomb Core Materials Market Volume (K Tons) Forecast, by Application 2019 & 2032
- Table 87: Mexico Honeycomb Core Materials Market Revenue (Million) Forecast, by Application 2019 & 2032
- Table 88: Mexico Honeycomb Core Materials Market Volume (K Tons) Forecast, by Application 2019 & 2032
- Table 89: Global Honeycomb Core Materials Market Revenue Million Forecast, by Product Type 2019 & 2032
- Table 90: Global Honeycomb Core Materials Market Volume K Tons Forecast, by Product Type 2019 & 2032
- Table 91: Global Honeycomb Core Materials Market Revenue Million Forecast, by End-user Industry 2019 & 2032
- Table 92: Global Honeycomb Core Materials Market Volume K Tons Forecast, by End-user Industry 2019 & 2032
- Table 93: Global Honeycomb Core Materials Market Revenue Million Forecast, by Country 2019 & 2032
- Table 94: Global Honeycomb Core Materials Market Volume K Tons Forecast, by Country 2019 & 2032
- Table 95: Germany Honeycomb Core Materials Market Revenue (Million) Forecast, by Application 2019 & 2032
- Table 96: Germany Honeycomb Core Materials Market Volume (K Tons) Forecast, by Application 2019 & 2032
- Table 97: United Kingdom Honeycomb Core Materials Market Revenue (Million) Forecast, by Application 2019 & 2032
- Table 98: United Kingdom Honeycomb Core Materials Market Volume (K Tons) Forecast, by Application 2019 & 2032
- Table 99: Italy Honeycomb Core Materials Market Revenue (Million) Forecast, by Application 2019 & 2032
- Table 100: Italy Honeycomb Core Materials Market Volume (K Tons) Forecast, by Application 2019 & 2032
- Table 101: France Honeycomb Core Materials Market Revenue (Million) Forecast, by Application 2019 & 2032
- Table 102: France Honeycomb Core Materials Market Volume (K Tons) Forecast, by Application 2019 & 2032
- Table 103: Rest of Europe Honeycomb Core Materials Market Revenue (Million) Forecast, by Application 2019 & 2032
- Table 104: Rest of Europe Honeycomb Core Materials Market Volume (K Tons) Forecast, by Application 2019 & 2032
- Table 105: Global Honeycomb Core Materials Market Revenue Million Forecast, by Product Type 2019 & 2032
- Table 106: Global Honeycomb Core Materials Market Volume K Tons Forecast, by Product Type 2019 & 2032
- Table 107: Global Honeycomb Core Materials Market Revenue Million Forecast, by End-user Industry 2019 & 2032
- Table 108: Global Honeycomb Core Materials Market Volume K Tons Forecast, by End-user Industry 2019 & 2032
- Table 109: Global Honeycomb Core Materials Market Revenue Million Forecast, by Country 2019 & 2032
- Table 110: Global Honeycomb Core Materials Market Volume K Tons Forecast, by Country 2019 & 2032
- Table 111: Brazil Honeycomb Core Materials Market Revenue (Million) Forecast, by Application 2019 & 2032
- Table 112: Brazil Honeycomb Core Materials Market Volume (K Tons) Forecast, by Application 2019 & 2032
- Table 113: Argentina Honeycomb Core Materials Market Revenue (Million) Forecast, by Application 2019 & 2032
- Table 114: Argentina Honeycomb Core Materials Market Volume (K Tons) Forecast, by Application 2019 & 2032
- Table 115: Rest of South America Honeycomb Core Materials Market Revenue (Million) Forecast, by Application 2019 & 2032
- Table 116: Rest of South America Honeycomb Core Materials Market Volume (K Tons) Forecast, by Application 2019 & 2032
- Table 117: Global Honeycomb Core Materials Market Revenue Million Forecast, by Product Type 2019 & 2032
- Table 118: Global Honeycomb Core Materials Market Volume K Tons Forecast, by Product Type 2019 & 2032
- Table 119: Global Honeycomb Core Materials Market Revenue Million Forecast, by End-user Industry 2019 & 2032
- Table 120: Global Honeycomb Core Materials Market Volume K Tons Forecast, by End-user Industry 2019 & 2032
- Table 121: Global Honeycomb Core Materials Market Revenue Million Forecast, by Country 2019 & 2032
- Table 122: Global Honeycomb Core Materials Market Volume K Tons Forecast, by Country 2019 & 2032
- Table 123: Saudi Arabia Honeycomb Core Materials Market Revenue (Million) Forecast, by Application 2019 & 2032
- Table 124: Saudi Arabia Honeycomb Core Materials Market Volume (K Tons) Forecast, by Application 2019 & 2032
- Table 125: South Africa Honeycomb Core Materials Market Revenue (Million) Forecast, by Application 2019 & 2032
- Table 126: South Africa Honeycomb Core Materials Market Volume (K Tons) Forecast, by Application 2019 & 2032
- Table 127: Rest of Middle East and Africa Honeycomb Core Materials Market Revenue (Million) Forecast, by Application 2019 & 2032
- Table 128: Rest of Middle East and Africa Honeycomb Core Materials Market Volume (K Tons) Forecast, by Application 2019 & 2032
Frequently Asked Questions
1. What is the projected Compound Annual Growth Rate (CAGR) of the Honeycomb Core Materials Market?
The projected CAGR is approximately > 9.00%.
2. Which companies are prominent players in the Honeycomb Core Materials Market?
Key companies in the market include Dufaylite Developments, Corinth Group, Honeycomb Cellpack, Honicel, Euro-Composites, Grigeo, Thermhex Waben GmbH, Samia Canada, The Gill Corporation, Hexcel Corporation, Argosy International, Koninklijke Ten Cate BV, Packaging Corporation of America, Axxion Group, Tubus Baer GmbH.
3. What are the main segments of the Honeycomb Core Materials Market?
The market segments include Product Type, End-user Industry.
4. Can you provide details about the market size?
The market size is estimated to be USD XX Million as of 2022.
5. What are some drivers contributing to market growth?
Increasing Demand for Lightweight Materials for Fuel Efficiency; Other Drivers.
6. What are the notable trends driving market growth?
Aerospace Sector to Dominate the Market.
7. Are there any restraints impacting market growth?
Absorption of Water and Moisture; Significant Cost of the Products; Structural Limitations of Honeycomb Core Materials.
8. Can you provide examples of recent developments in the market?
In January 2022, FITS Air is currently being developed to TRL 6 technology readiness level, with panels measuring 1.28 m x 1.48 m and having optimum mechanical properties.
9. What pricing options are available for accessing the report?
Pricing options include single-user, multi-user, and enterprise licenses priced at USD 4750, USD 5250, and USD 8750 respectively.
10. Is the market size provided in terms of value or volume?
The market size is provided in terms of value, measured in Million and volume, measured in K Tons.
11. Are there any specific market keywords associated with the report?
Yes, the market keyword associated with the report is "Honeycomb Core Materials Market," which aids in identifying and referencing the specific market segment covered.
12. How do I determine which pricing option suits my needs best?
The pricing options vary based on user requirements and access needs. Individual users may opt for single-user licenses, while businesses requiring broader access may choose multi-user or enterprise licenses for cost-effective access to the report.
13. Are there any additional resources or data provided in the Honeycomb Core Materials Market report?
While the report offers comprehensive insights, it's advisable to review the specific contents or supplementary materials provided to ascertain if additional resources or data are available.
14. How can I stay updated on further developments or reports in the Honeycomb Core Materials Market?
To stay informed about further developments, trends, and reports in the Honeycomb Core Materials Market, consider subscribing to industry newsletters, following relevant companies and organizations, or regularly checking reputable industry news sources and publications.
Methodology
Step 1 - Identification of Relevant Samples Size from Population Database


Step 2 - Approaches for Defining Global Market Size (Value, Volume* & Price*)

Note*: In applicable scenarios
Step 3 - Data Sources
Primary Research
- Web Analytics
- Survey Reports
- Research Institute
- Latest Research Reports
- Opinion Leaders
Secondary Research
- Annual Reports
- White Paper
- Latest Press Release
- Industry Association
- Paid Database
- Investor Presentations

Step 4 - Data Triangulation
Involves using different sources of information in order to increase the validity of a study
These sources are likely to be stakeholders in a program - participants, other researchers, program staff, other community members, and so on.
Then we put all data in single framework & apply various statistical tools to find out the dynamic on the market.
During the analysis stage, feedback from the stakeholder groups would be compared to determine areas of agreement as well as areas of divergence
