

Key Insights
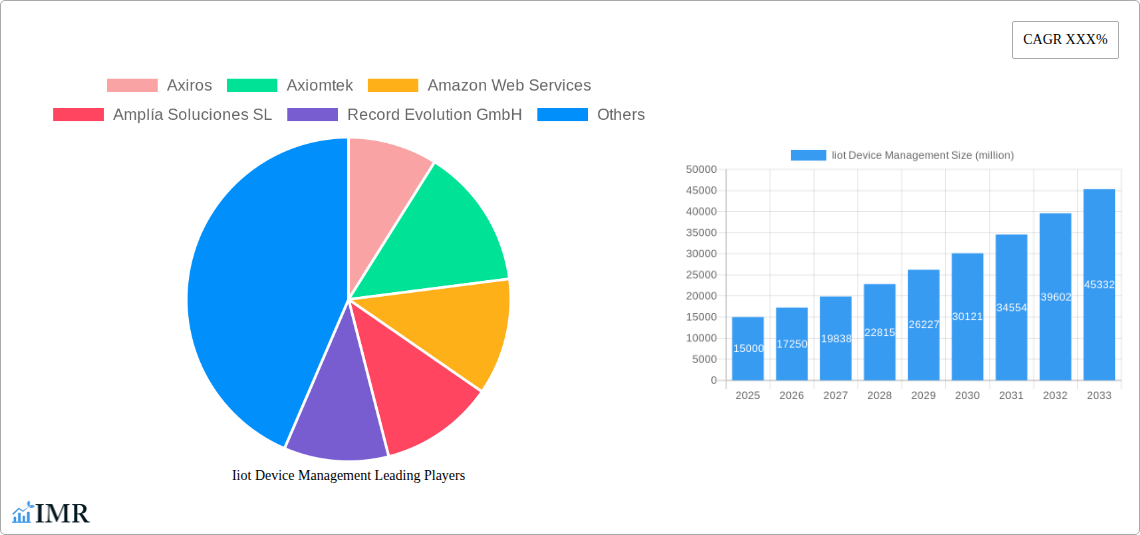
The Industrial IoT (IIoT) Device Management market is experiencing robust growth, driven by the increasing adoption of smart factories, the proliferation of connected devices, and the need for enhanced operational efficiency and security across various industries. The market, estimated at $15 billion in 2025, is projected to witness a Compound Annual Growth Rate (CAGR) of 15% from 2025 to 2033, reaching approximately $45 billion by 2033. This expansion is fueled by several key trends, including the rising demand for predictive maintenance, remote monitoring capabilities, and improved data analytics for optimizing industrial processes. Furthermore, the increasing complexity of IIoT networks necessitates sophisticated management solutions to address security threats and ensure seamless connectivity. Major players like Microsoft, Google, and Amazon Web Services are actively contributing to this growth through their cloud-based platforms and device management services. However, challenges such as interoperability issues, high implementation costs, and a scarcity of skilled professionals continue to restrain market penetration, particularly in smaller industrial settings. Segmentation within the market includes solutions for different device types (sensors, actuators, gateways), deployment models (cloud, on-premise), and industry verticals (manufacturing, energy, transportation).
The competitive landscape is characterized by a mix of established technology giants and specialized IIoT solution providers. Companies like Axiros, Axiomtek, and Davra are focusing on providing niche solutions catering to specific industry needs. The market's future growth will be influenced by advancements in 5G technology, edge computing, and artificial intelligence (AI) which will enable greater device connectivity, faster data processing, and advanced analytics capabilities for improved decision-making. The integration of these technologies will further enhance the capabilities of IIoT device management systems, leading to higher adoption rates across diverse industrial sectors. Strategic partnerships and mergers and acquisitions are likely to shape the competitive dynamics in the coming years as companies strive to expand their market share and offer comprehensive solutions.
Unlock the Potential: The Comprehensive IIoT Device Management Market Report (2019-2033)
This in-depth report provides a comprehensive analysis of the IIoT Device Management market, offering invaluable insights for industry professionals, investors, and strategists. Covering the period from 2019 to 2033, with a focus on 2025, this report dissects market dynamics, growth trends, regional dominance, and key players, equipping you with the knowledge to navigate this rapidly evolving landscape. The parent market is Industrial Internet of Things (IIoT) and the child market is IIoT Device Management. The market size in 2025 is estimated to be xx million units.
IIoT Device Management Market Dynamics & Structure
The IIoT Device Management market is characterized by moderate concentration, with key players vying for market share. Technological innovation, particularly in areas like AI-driven predictive maintenance and edge computing, is a primary growth driver. Stringent regulatory frameworks concerning data security and privacy significantly influence market strategies. Competitive substitutes, such as traditional manual monitoring systems, are gradually being replaced. The end-user demographics span diverse industries, including manufacturing, energy, and transportation. M&A activity has been relatively active in recent years, with xx major deals recorded between 2019 and 2024.
- Market Concentration: Moderately concentrated, with top 5 players holding approximately xx% market share in 2025.
- Technological Innovation: AI, machine learning, and edge computing are key innovation drivers.
- Regulatory Landscape: GDPR, CCPA, and industry-specific regulations impact data security and compliance.
- Competitive Substitutes: Traditional monitoring systems face declining adoption due to IIoT's efficiency.
- End-User Demographics: Manufacturing, energy, transportation, healthcare are major end-users.
- M&A Activity: xx major mergers and acquisitions occurred between 2019 and 2024.
IIoT Device Management Growth Trends & Insights
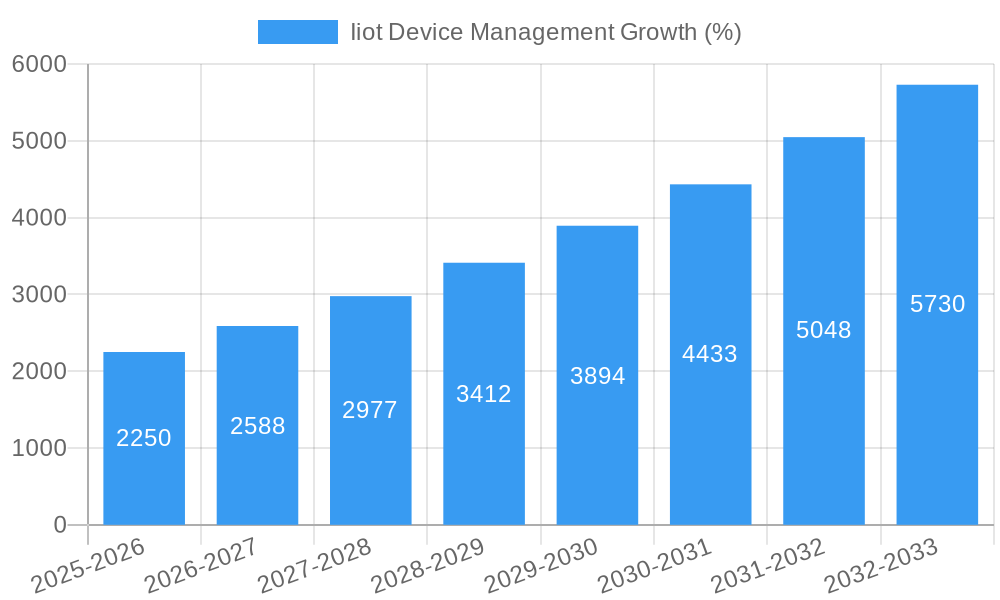
The IIoT Device Management market experienced robust growth between 2019 and 2024, driven by increasing adoption of connected devices and the need for efficient remote management. The market size expanded from xx million units in 2019 to xx million units in 2024, exhibiting a CAGR of xx%. Technological disruptions, such as the rise of 5G and the expansion of cloud-based solutions, significantly accelerated market penetration. A shift in consumer behavior toward proactive maintenance and remote monitoring further fueled market expansion. The forecast period (2025-2033) projects continued growth, reaching xx million units by 2033, with a projected CAGR of xx%. Market penetration is expected to reach xx% by 2033.
Dominant Regions, Countries, or Segments in IIoT Device Management
North America currently holds the largest market share in IIoT Device Management, driven by early adoption of IIoT technologies and a robust technological infrastructure. However, the Asia-Pacific region is projected to witness the fastest growth rate during the forecast period due to rapid industrialization and increasing government investment in digital infrastructure. Specific countries like the US, China, and Germany are leading the market, propelled by strong economic conditions and supportive regulatory environments.
- North America: Strong early adoption, well-developed infrastructure, and high technological maturity.
- Asia-Pacific: Rapid industrialization, increasing government support for digital transformation.
- Europe: Growing focus on sustainability and efficiency in industries driving adoption.
- Key Drivers: Government initiatives, strong industrial base, increasing investment in digital technologies.
IIoT Device Management Product Landscape
The IIoT Device Management product landscape comprises diverse solutions, including software platforms, hardware devices, and managed services. These solutions vary in their functionality, scalability, and integration capabilities. Key product innovations involve AI-powered predictive maintenance, advanced security features, and seamless cloud integration. The focus is shifting towards user-friendly interfaces and improved interoperability to streamline device management and optimize operational efficiency.
Key Drivers, Barriers & Challenges in IIoT Device Management
Key Drivers: The increasing need for real-time monitoring, predictive maintenance, and improved operational efficiency are primary drivers. Technological advancements like AI and cloud computing further accelerate market growth. Government initiatives promoting digital transformation in various sectors also contribute to market expansion.
Key Challenges: Data security concerns, integration complexities, and high initial investment costs are major challenges. Supply chain disruptions and skilled labor shortages can also hinder market growth. Furthermore, the lack of interoperability standards amongst different devices remains a significant barrier.
Emerging Opportunities in IIoT Device Management
The untapped potential of smaller businesses adopting IIoT, the development of secure and scalable edge computing solutions for resource-constrained environments, and the convergence of IIoT with other technologies, such as blockchain and augmented reality, present significant opportunities. The increasing adoption of IIoT in previously underserved sectors, such as agriculture and smart cities, also creates new avenues for growth.
Growth Accelerators in the IIoT Device Management Industry
Strategic partnerships between technology providers and industry players are facilitating market expansion. The development of standardized protocols and interoperability frameworks is fostering greater integration and efficiency. Government investments in digital infrastructure are further driving the adoption of IIoT across diverse sectors. Continuous technological innovation, specifically in AI and edge computing, ensures long-term growth potential.
Key Players Shaping the IIoT Device Management Market
- Axiros
- Axiomtek
- Amazon Web Services
- Amplía Soluciones SL
- Record Evolution GmbH
- Davra
- WellAware Holdings Inc
- Datadog
- Microsoft
- IBM
Notable Milestones in IIoT Device Management Sector
- 2020: Increased focus on cybersecurity solutions for IIoT devices.
- 2021: Launch of several cloud-based IIoT device management platforms.
- 2022: Significant growth in the adoption of AI-powered predictive maintenance solutions.
- 2023: Expansion of IIoT into new industries such as agriculture and smart cities.
In-Depth IIoT Device Management Market Outlook
The IIoT Device Management market is poised for sustained growth, driven by continuous technological advancements, increasing demand for efficient operational management, and expanding applications across various industries. The convergence of technologies and strategic partnerships will create new opportunities for market players, resulting in a more connected and intelligent industrial landscape. Forward-looking strategies should focus on addressing cybersecurity concerns, developing user-friendly interfaces, and promoting interoperability to maximize market potential.
Iiot Device Management Segmentation
-
1. Application
- 1.1. Intelligent City Lighting
- 1.2. Agriculture And Precision Agriculture
-
2. Type
- 2.1. Setup And Authentication
- 2.2. Configuration And Control
- 2.3. Monitoring And Diagnosis
- 2.4. Update And Maintenance
Iiot Device Management Segmentation By Geography
-
1. North America
- 1.1. United States
- 1.2. Canada
- 1.3. Mexico
-
2. South America
- 2.1. Brazil
- 2.2. Argentina
- 2.3. Rest of South America
-
3. Europe
- 3.1. United Kingdom
- 3.2. Germany
- 3.3. France
- 3.4. Italy
- 3.5. Spain
- 3.6. Russia
- 3.7. Benelux
- 3.8. Nordics
- 3.9. Rest of Europe
-
4. Middle East & Africa
- 4.1. Turkey
- 4.2. Israel
- 4.3. GCC
- 4.4. North Africa
- 4.5. South Africa
- 4.6. Rest of Middle East & Africa
-
5. Asia Pacific
- 5.1. China
- 5.2. India
- 5.3. Japan
- 5.4. South Korea
- 5.5. ASEAN
- 5.6. Oceania
- 5.7. Rest of Asia Pacific

Iiot Device Management REPORT HIGHLIGHTS
| Aspects | Details |
|---|---|
| Study Period | 2019-2033 |
| Base Year | 2024 |
| Estimated Year | 2025 |
| Forecast Period | 2025-2033 |
| Historical Period | 2019-2024 |
| Growth Rate | CAGR of XXX% from 2019-2033 |
| Segmentation |
|
Table of Contents
- 1. Introduction
- 1.1. Research Scope
- 1.2. Market Segmentation
- 1.3. Research Methodology
- 1.4. Definitions and Assumptions
- 2. Executive Summary
- 2.1. Introduction
- 3. Market Dynamics
- 3.1. Introduction
- 3.2. Market Drivers
- 3.3. Market Restrains
- 3.4. Market Trends
- 4. Market Factor Analysis
- 4.1. Porters Five Forces
- 4.2. Supply/Value Chain
- 4.3. PESTEL analysis
- 4.4. Market Entropy
- 4.5. Patent/Trademark Analysis
- 5. Global Iiot Device Management Analysis, Insights and Forecast, 2019-2031
- 5.1. Market Analysis, Insights and Forecast - by Application
- 5.1.1. Intelligent City Lighting
- 5.1.2. Agriculture And Precision Agriculture
- 5.2. Market Analysis, Insights and Forecast - by Type
- 5.2.1. Setup And Authentication
- 5.2.2. Configuration And Control
- 5.2.3. Monitoring And Diagnosis
- 5.2.4. Update And Maintenance
- 5.3. Market Analysis, Insights and Forecast - by Region
- 5.3.1. North America
- 5.3.2. South America
- 5.3.3. Europe
- 5.3.4. Middle East & Africa
- 5.3.5. Asia Pacific
- 5.1. Market Analysis, Insights and Forecast - by Application
- 6. North America Iiot Device Management Analysis, Insights and Forecast, 2019-2031
- 6.1. Market Analysis, Insights and Forecast - by Application
- 6.1.1. Intelligent City Lighting
- 6.1.2. Agriculture And Precision Agriculture
- 6.2. Market Analysis, Insights and Forecast - by Type
- 6.2.1. Setup And Authentication
- 6.2.2. Configuration And Control
- 6.2.3. Monitoring And Diagnosis
- 6.2.4. Update And Maintenance
- 6.1. Market Analysis, Insights and Forecast - by Application
- 7. South America Iiot Device Management Analysis, Insights and Forecast, 2019-2031
- 7.1. Market Analysis, Insights and Forecast - by Application
- 7.1.1. Intelligent City Lighting
- 7.1.2. Agriculture And Precision Agriculture
- 7.2. Market Analysis, Insights and Forecast - by Type
- 7.2.1. Setup And Authentication
- 7.2.2. Configuration And Control
- 7.2.3. Monitoring And Diagnosis
- 7.2.4. Update And Maintenance
- 7.1. Market Analysis, Insights and Forecast - by Application
- 8. Europe Iiot Device Management Analysis, Insights and Forecast, 2019-2031
- 8.1. Market Analysis, Insights and Forecast - by Application
- 8.1.1. Intelligent City Lighting
- 8.1.2. Agriculture And Precision Agriculture
- 8.2. Market Analysis, Insights and Forecast - by Type
- 8.2.1. Setup And Authentication
- 8.2.2. Configuration And Control
- 8.2.3. Monitoring And Diagnosis
- 8.2.4. Update And Maintenance
- 8.1. Market Analysis, Insights and Forecast - by Application
- 9. Middle East & Africa Iiot Device Management Analysis, Insights and Forecast, 2019-2031
- 9.1. Market Analysis, Insights and Forecast - by Application
- 9.1.1. Intelligent City Lighting
- 9.1.2. Agriculture And Precision Agriculture
- 9.2. Market Analysis, Insights and Forecast - by Type
- 9.2.1. Setup And Authentication
- 9.2.2. Configuration And Control
- 9.2.3. Monitoring And Diagnosis
- 9.2.4. Update And Maintenance
- 9.1. Market Analysis, Insights and Forecast - by Application
- 10. Asia Pacific Iiot Device Management Analysis, Insights and Forecast, 2019-2031
- 10.1. Market Analysis, Insights and Forecast - by Application
- 10.1.1. Intelligent City Lighting
- 10.1.2. Agriculture And Precision Agriculture
- 10.2. Market Analysis, Insights and Forecast - by Type
- 10.2.1. Setup And Authentication
- 10.2.2. Configuration And Control
- 10.2.3. Monitoring And Diagnosis
- 10.2.4. Update And Maintenance
- 10.1. Market Analysis, Insights and Forecast - by Application
- 11. Competitive Analysis
- 11.1. Global Market Share Analysis 2024
- 11.2. Company Profiles
- 11.2.1 Axiros
- 11.2.1.1. Overview
- 11.2.1.2. Products
- 11.2.1.3. SWOT Analysis
- 11.2.1.4. Recent Developments
- 11.2.1.5. Financials (Based on Availability)
- 11.2.2 Axiomtek
- 11.2.2.1. Overview
- 11.2.2.2. Products
- 11.2.2.3. SWOT Analysis
- 11.2.2.4. Recent Developments
- 11.2.2.5. Financials (Based on Availability)
- 11.2.3 Amazon Web Services
- 11.2.3.1. Overview
- 11.2.3.2. Products
- 11.2.3.3. SWOT Analysis
- 11.2.3.4. Recent Developments
- 11.2.3.5. Financials (Based on Availability)
- 11.2.4 Amplía Soluciones SL
- 11.2.4.1. Overview
- 11.2.4.2. Products
- 11.2.4.3. SWOT Analysis
- 11.2.4.4. Recent Developments
- 11.2.4.5. Financials (Based on Availability)
- 11.2.5 Record Evolution GmbH
- 11.2.5.1. Overview
- 11.2.5.2. Products
- 11.2.5.3. SWOT Analysis
- 11.2.5.4. Recent Developments
- 11.2.5.5. Financials (Based on Availability)
- 11.2.6 Davra
- 11.2.6.1. Overview
- 11.2.6.2. Products
- 11.2.6.3. SWOT Analysis
- 11.2.6.4. Recent Developments
- 11.2.6.5. Financials (Based on Availability)
- 11.2.7 WellAware Holdings Inc
- 11.2.7.1. Overview
- 11.2.7.2. Products
- 11.2.7.3. SWOT Analysis
- 11.2.7.4. Recent Developments
- 11.2.7.5. Financials (Based on Availability)
- 11.2.8 Datadog
- 11.2.8.1. Overview
- 11.2.8.2. Products
- 11.2.8.3. SWOT Analysis
- 11.2.8.4. Recent Developments
- 11.2.8.5. Financials (Based on Availability)
- 11.2.9 Google
- 11.2.9.1. Overview
- 11.2.9.2. Products
- 11.2.9.3. SWOT Analysis
- 11.2.9.4. Recent Developments
- 11.2.9.5. Financials (Based on Availability)
- 11.2.10 Microsof
- 11.2.10.1. Overview
- 11.2.10.2. Products
- 11.2.10.3. SWOT Analysis
- 11.2.10.4. Recent Developments
- 11.2.10.5. Financials (Based on Availability)
- 11.2.11 IBM
- 11.2.11.1. Overview
- 11.2.11.2. Products
- 11.2.11.3. SWOT Analysis
- 11.2.11.4. Recent Developments
- 11.2.11.5. Financials (Based on Availability)
- 11.2.1 Axiros
List of Figures
- Figure 1: Global Iiot Device Management Revenue Breakdown (million, %) by Region 2024 & 2032
- Figure 2: North America Iiot Device Management Revenue (million), by Application 2024 & 2032
- Figure 3: North America Iiot Device Management Revenue Share (%), by Application 2024 & 2032
- Figure 4: North America Iiot Device Management Revenue (million), by Type 2024 & 2032
- Figure 5: North America Iiot Device Management Revenue Share (%), by Type 2024 & 2032
- Figure 6: North America Iiot Device Management Revenue (million), by Country 2024 & 2032
- Figure 7: North America Iiot Device Management Revenue Share (%), by Country 2024 & 2032
- Figure 8: South America Iiot Device Management Revenue (million), by Application 2024 & 2032
- Figure 9: South America Iiot Device Management Revenue Share (%), by Application 2024 & 2032
- Figure 10: South America Iiot Device Management Revenue (million), by Type 2024 & 2032
- Figure 11: South America Iiot Device Management Revenue Share (%), by Type 2024 & 2032
- Figure 12: South America Iiot Device Management Revenue (million), by Country 2024 & 2032
- Figure 13: South America Iiot Device Management Revenue Share (%), by Country 2024 & 2032
- Figure 14: Europe Iiot Device Management Revenue (million), by Application 2024 & 2032
- Figure 15: Europe Iiot Device Management Revenue Share (%), by Application 2024 & 2032
- Figure 16: Europe Iiot Device Management Revenue (million), by Type 2024 & 2032
- Figure 17: Europe Iiot Device Management Revenue Share (%), by Type 2024 & 2032
- Figure 18: Europe Iiot Device Management Revenue (million), by Country 2024 & 2032
- Figure 19: Europe Iiot Device Management Revenue Share (%), by Country 2024 & 2032
- Figure 20: Middle East & Africa Iiot Device Management Revenue (million), by Application 2024 & 2032
- Figure 21: Middle East & Africa Iiot Device Management Revenue Share (%), by Application 2024 & 2032
- Figure 22: Middle East & Africa Iiot Device Management Revenue (million), by Type 2024 & 2032
- Figure 23: Middle East & Africa Iiot Device Management Revenue Share (%), by Type 2024 & 2032
- Figure 24: Middle East & Africa Iiot Device Management Revenue (million), by Country 2024 & 2032
- Figure 25: Middle East & Africa Iiot Device Management Revenue Share (%), by Country 2024 & 2032
- Figure 26: Asia Pacific Iiot Device Management Revenue (million), by Application 2024 & 2032
- Figure 27: Asia Pacific Iiot Device Management Revenue Share (%), by Application 2024 & 2032
- Figure 28: Asia Pacific Iiot Device Management Revenue (million), by Type 2024 & 2032
- Figure 29: Asia Pacific Iiot Device Management Revenue Share (%), by Type 2024 & 2032
- Figure 30: Asia Pacific Iiot Device Management Revenue (million), by Country 2024 & 2032
- Figure 31: Asia Pacific Iiot Device Management Revenue Share (%), by Country 2024 & 2032
List of Tables
- Table 1: Global Iiot Device Management Revenue million Forecast, by Region 2019 & 2032
- Table 2: Global Iiot Device Management Revenue million Forecast, by Application 2019 & 2032
- Table 3: Global Iiot Device Management Revenue million Forecast, by Type 2019 & 2032
- Table 4: Global Iiot Device Management Revenue million Forecast, by Region 2019 & 2032
- Table 5: Global Iiot Device Management Revenue million Forecast, by Application 2019 & 2032
- Table 6: Global Iiot Device Management Revenue million Forecast, by Type 2019 & 2032
- Table 7: Global Iiot Device Management Revenue million Forecast, by Country 2019 & 2032
- Table 8: United States Iiot Device Management Revenue (million) Forecast, by Application 2019 & 2032
- Table 9: Canada Iiot Device Management Revenue (million) Forecast, by Application 2019 & 2032
- Table 10: Mexico Iiot Device Management Revenue (million) Forecast, by Application 2019 & 2032
- Table 11: Global Iiot Device Management Revenue million Forecast, by Application 2019 & 2032
- Table 12: Global Iiot Device Management Revenue million Forecast, by Type 2019 & 2032
- Table 13: Global Iiot Device Management Revenue million Forecast, by Country 2019 & 2032
- Table 14: Brazil Iiot Device Management Revenue (million) Forecast, by Application 2019 & 2032
- Table 15: Argentina Iiot Device Management Revenue (million) Forecast, by Application 2019 & 2032
- Table 16: Rest of South America Iiot Device Management Revenue (million) Forecast, by Application 2019 & 2032
- Table 17: Global Iiot Device Management Revenue million Forecast, by Application 2019 & 2032
- Table 18: Global Iiot Device Management Revenue million Forecast, by Type 2019 & 2032
- Table 19: Global Iiot Device Management Revenue million Forecast, by Country 2019 & 2032
- Table 20: United Kingdom Iiot Device Management Revenue (million) Forecast, by Application 2019 & 2032
- Table 21: Germany Iiot Device Management Revenue (million) Forecast, by Application 2019 & 2032
- Table 22: France Iiot Device Management Revenue (million) Forecast, by Application 2019 & 2032
- Table 23: Italy Iiot Device Management Revenue (million) Forecast, by Application 2019 & 2032
- Table 24: Spain Iiot Device Management Revenue (million) Forecast, by Application 2019 & 2032
- Table 25: Russia Iiot Device Management Revenue (million) Forecast, by Application 2019 & 2032
- Table 26: Benelux Iiot Device Management Revenue (million) Forecast, by Application 2019 & 2032
- Table 27: Nordics Iiot Device Management Revenue (million) Forecast, by Application 2019 & 2032
- Table 28: Rest of Europe Iiot Device Management Revenue (million) Forecast, by Application 2019 & 2032
- Table 29: Global Iiot Device Management Revenue million Forecast, by Application 2019 & 2032
- Table 30: Global Iiot Device Management Revenue million Forecast, by Type 2019 & 2032
- Table 31: Global Iiot Device Management Revenue million Forecast, by Country 2019 & 2032
- Table 32: Turkey Iiot Device Management Revenue (million) Forecast, by Application 2019 & 2032
- Table 33: Israel Iiot Device Management Revenue (million) Forecast, by Application 2019 & 2032
- Table 34: GCC Iiot Device Management Revenue (million) Forecast, by Application 2019 & 2032
- Table 35: North Africa Iiot Device Management Revenue (million) Forecast, by Application 2019 & 2032
- Table 36: South Africa Iiot Device Management Revenue (million) Forecast, by Application 2019 & 2032
- Table 37: Rest of Middle East & Africa Iiot Device Management Revenue (million) Forecast, by Application 2019 & 2032
- Table 38: Global Iiot Device Management Revenue million Forecast, by Application 2019 & 2032
- Table 39: Global Iiot Device Management Revenue million Forecast, by Type 2019 & 2032
- Table 40: Global Iiot Device Management Revenue million Forecast, by Country 2019 & 2032
- Table 41: China Iiot Device Management Revenue (million) Forecast, by Application 2019 & 2032
- Table 42: India Iiot Device Management Revenue (million) Forecast, by Application 2019 & 2032
- Table 43: Japan Iiot Device Management Revenue (million) Forecast, by Application 2019 & 2032
- Table 44: South Korea Iiot Device Management Revenue (million) Forecast, by Application 2019 & 2032
- Table 45: ASEAN Iiot Device Management Revenue (million) Forecast, by Application 2019 & 2032
- Table 46: Oceania Iiot Device Management Revenue (million) Forecast, by Application 2019 & 2032
- Table 47: Rest of Asia Pacific Iiot Device Management Revenue (million) Forecast, by Application 2019 & 2032
Frequently Asked Questions
1. What is the projected Compound Annual Growth Rate (CAGR) of the Iiot Device Management?
The projected CAGR is approximately XXX%.
2. Which companies are prominent players in the Iiot Device Management?
Key companies in the market include Axiros, Axiomtek, Amazon Web Services, Amplía Soluciones SL, Record Evolution GmbH, Davra, WellAware Holdings Inc, Datadog, Google, Microsof, IBM.
3. What are the main segments of the Iiot Device Management?
The market segments include Application, Type.
4. Can you provide details about the market size?
The market size is estimated to be USD XXX million as of 2022.
5. What are some drivers contributing to market growth?
N/A
6. What are the notable trends driving market growth?
N/A
7. Are there any restraints impacting market growth?
N/A
8. Can you provide examples of recent developments in the market?
N/A
9. What pricing options are available for accessing the report?
Pricing options include single-user, multi-user, and enterprise licenses priced at USD 3950.00, USD 5925.00, and USD 7900.00 respectively.
10. Is the market size provided in terms of value or volume?
The market size is provided in terms of value, measured in million.
11. Are there any specific market keywords associated with the report?
Yes, the market keyword associated with the report is "Iiot Device Management," which aids in identifying and referencing the specific market segment covered.
12. How do I determine which pricing option suits my needs best?
The pricing options vary based on user requirements and access needs. Individual users may opt for single-user licenses, while businesses requiring broader access may choose multi-user or enterprise licenses for cost-effective access to the report.
13. Are there any additional resources or data provided in the Iiot Device Management report?
While the report offers comprehensive insights, it's advisable to review the specific contents or supplementary materials provided to ascertain if additional resources or data are available.
14. How can I stay updated on further developments or reports in the Iiot Device Management?
To stay informed about further developments, trends, and reports in the Iiot Device Management, consider subscribing to industry newsletters, following relevant companies and organizations, or regularly checking reputable industry news sources and publications.
Methodology
Step 1 - Identification of Relevant Samples Size from Population Database


Step 2 - Approaches for Defining Global Market Size (Value, Volume* & Price*)

Note*: In applicable scenarios
Step 3 - Data Sources
Primary Research
- Web Analytics
- Survey Reports
- Research Institute
- Latest Research Reports
- Opinion Leaders
Secondary Research
- Annual Reports
- White Paper
- Latest Press Release
- Industry Association
- Paid Database
- Investor Presentations

Step 4 - Data Triangulation
Involves using different sources of information in order to increase the validity of a study
These sources are likely to be stakeholders in a program - participants, other researchers, program staff, other community members, and so on.
Then we put all data in single framework & apply various statistical tools to find out the dynamic on the market.
During the analysis stage, feedback from the stakeholder groups would be compared to determine areas of agreement as well as areas of divergence
