

Key Insights
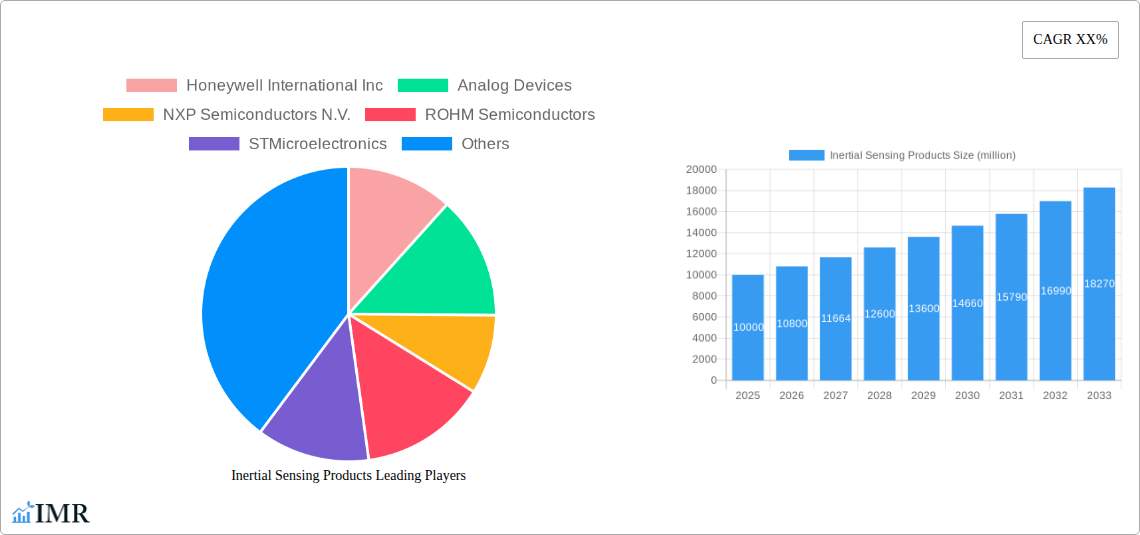
The inertial sensing products market is experiencing robust growth, driven by increasing demand across diverse sectors. The market, estimated at $10 billion in 2025, is projected to expand significantly over the forecast period (2025-2033), fueled by a compound annual growth rate (CAGR) of approximately 8%. This growth is primarily attributed to the proliferation of smartphones, wearable devices, and autonomous vehicles, all of which rely heavily on inertial measurement units (IMUs) for accurate motion tracking and positioning. Further expansion is expected from the burgeoning adoption of inertial sensing technology in industrial automation, robotics, and aerospace applications. These sectors require precise and reliable motion sensing for tasks ranging from drone navigation and stabilization to advanced manufacturing processes and sophisticated control systems. The ongoing miniaturization and enhanced performance of inertial sensors, coupled with decreasing costs, are key factors contributing to market expansion.
However, certain challenges exist. Competition among established players and emerging startups is intensifying, leading to price pressures. Furthermore, technological advancements in alternative sensing technologies, such as vision systems and GPS, pose a competitive threat to the widespread adoption of inertial sensing. Nevertheless, the inherent advantages of inertial sensors—such as their ability to operate in GPS-denied environments and their low power consumption—are expected to maintain their relevance and drive continued market growth. The market segmentation encompasses various sensor types (accelerometers, gyroscopes, and IMUs), applications (automotive, consumer electronics, industrial, aerospace and defense), and geographic regions. Key players like Honeywell, Analog Devices, and STMicroelectronics are actively engaged in developing advanced technologies and expanding their market presence. Strategic partnerships and acquisitions are likely to further shape the competitive landscape in the coming years.
Inertial Sensing Products Market Report: 2019-2033
This comprehensive report provides a detailed analysis of the Inertial Sensing Products market, encompassing market dynamics, growth trends, regional analysis, product landscape, key players, and future outlook. The study period covers 2019-2033, with 2025 as the base and estimated year. This report is essential for industry professionals, investors, and strategic decision-makers seeking to navigate this dynamic market. The parent market is the broader sensor market, while the child market focuses specifically on inertial sensing technologies.
Inertial Sensing Products Market Dynamics & Structure
The Inertial Sensing Products market is characterized by a moderately concentrated landscape with key players like Honeywell International Inc, Analog Devices, and STMicroelectronics holding significant market share. The market size in 2025 is estimated at $xx billion, expected to reach $xx billion by 2033. Technological innovation, particularly in MEMS (Microelectromechanical Systems) and advanced sensor fusion algorithms, are key growth drivers. Stringent regulatory frameworks in specific applications (e.g., automotive safety) influence market dynamics. Competitive substitutes include alternative navigation technologies (e.g., GPS) and the increasing sophistication of sensor integration presents challenges. End-user demographics are diverse, spanning automotive, aerospace, consumer electronics, and industrial automation. M&A activity has been moderate, with xx major deals recorded between 2019-2024, indicating consolidation efforts among existing players.
- Market Concentration: Moderately concentrated, with top 5 players holding approximately xx% market share in 2025.
- Technological Innovation: MEMS technology advancements, sensor fusion, and AI integration are driving growth.
- Regulatory Landscape: Stringent regulations in automotive and aerospace sectors influence product development and adoption.
- Competitive Substitutes: GPS, optical navigation systems pose competitive challenges.
- M&A Activity: xx major mergers and acquisitions between 2019 and 2024.
Inertial Sensing Products Growth Trends & Insights
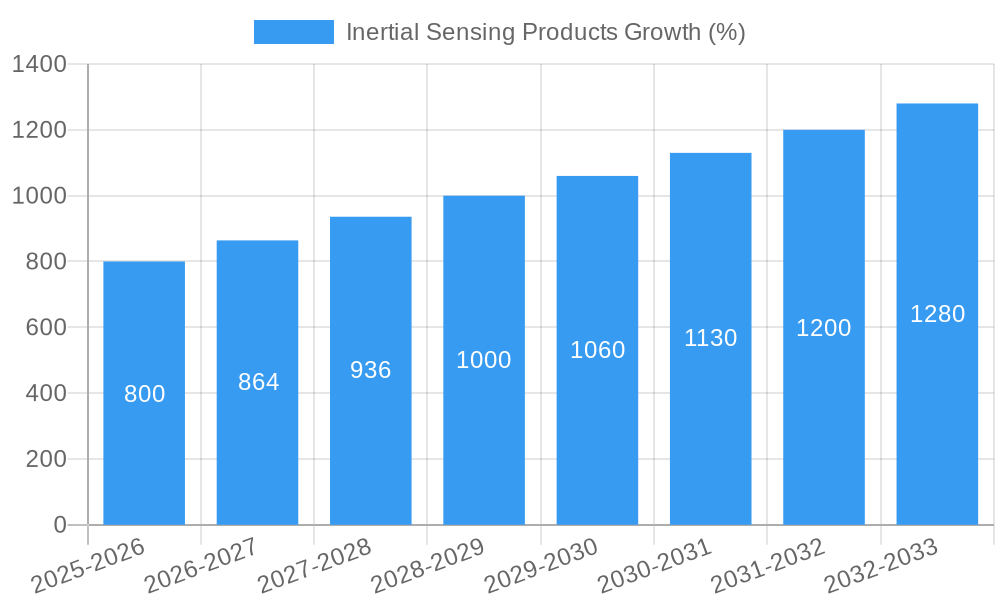
The Inertial Sensing Products market exhibited a CAGR of xx% during the historical period (2019-2024) and is projected to maintain a CAGR of xx% during the forecast period (2025-2033). This growth is fueled by increasing demand across various end-use sectors, particularly in the automotive and consumer electronics segments. The rising adoption of advanced driver-assistance systems (ADAS) and autonomous vehicles is significantly driving market expansion. Technological disruptions, such as the integration of AI and machine learning in inertial sensors for enhanced performance and accuracy, are further boosting market growth. Consumer behavior shifts towards increased preference for smart devices and wearable technology have also contributed to the market's expansion. Market penetration in emerging economies is also expected to contribute significantly to future growth. The overall market size is predicted to increase from $xx billion in 2025 to $xx billion by 2033.
Dominant Regions, Countries, or Segments in Inertial Sensing Products
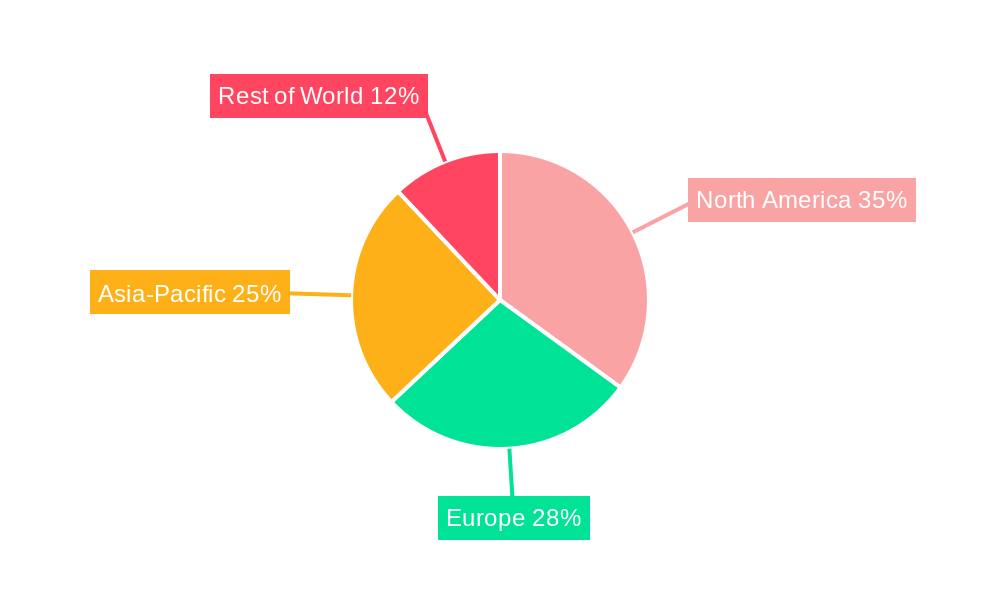
North America currently holds the largest market share in the Inertial Sensing Products market, driven by robust technological advancements, a high concentration of key players, and significant demand from the automotive and aerospace industries. Asia-Pacific is anticipated to witness the fastest growth during the forecast period, fueled by rapid industrialization, rising disposable incomes, and increasing adoption of consumer electronics. Europe holds a significant market share, with substantial contributions from automotive and industrial automation sectors. Within the product segments, MEMS-based inertial sensors dominate the market due to their cost-effectiveness and high performance.
- North America: Strong technological base, high adoption rates in automotive and aerospace.
- Asia-Pacific: Rapid industrialization, growing consumer electronics market.
- Europe: Established automotive and industrial automation sectors.
- MEMS-based Sensors: Dominate the market due to cost-effectiveness and performance.
Inertial Sensing Products Product Landscape
The Inertial Sensing Products market offers a diverse range of products, including accelerometers, gyroscopes, and integrated inertial measurement units (IMUs). These products vary in accuracy, size, power consumption, and functionality, catering to diverse applications. Recent innovations focus on miniaturization, enhanced sensitivity, improved power efficiency, and sensor fusion technologies, resulting in more compact, accurate, and reliable devices. Unique selling propositions include high precision, low noise, wide operating temperature ranges, and robust packaging.
Key Drivers, Barriers & Challenges in Inertial Sensing Products
Key Drivers: Increasing demand from automotive (ADAS, autonomous vehicles), aerospace (navigation, stabilization), and consumer electronics (wearables, smartphones) sectors is the primary driver. Technological advancements in MEMS technology, improved sensor fusion algorithms, and miniaturization are also key factors. Government initiatives promoting automation and smart infrastructure further support market growth.
Key Challenges: High initial investment costs for advanced sensor technologies may hinder market penetration. Supply chain disruptions can impact production and availability. Stringent quality and safety standards, especially in automotive and aerospace applications, pose regulatory hurdles. Intense competition among established players and the emergence of new entrants creates pressure on pricing and profit margins.
Emerging Opportunities in Inertial Sensing Products
Emerging opportunities lie in the growing adoption of IoT (Internet of Things) devices, requiring highly integrated and low-power sensors. The expanding use of inertial sensing technologies in robotics, drones, and industrial automation presents significant growth potential. The development of highly sensitive sensors for healthcare applications (e.g., motion tracking, rehabilitation) offers another promising avenue. Expansion into emerging markets with increasing demand for technology and infrastructure development creates further opportunities.
Growth Accelerators in the Inertial Sensing Products Industry
Technological breakthroughs in sensor fusion, miniaturization, and AI-driven algorithms are key growth catalysts. Strategic partnerships between sensor manufacturers and system integrators accelerate market adoption. Expansion into new applications, such as augmented reality (AR) and virtual reality (VR), will further fuel market expansion.
Key Players Shaping the Inertial Sensing Products Market
- Honeywell International Inc
- Analog Devices
- NXP Semiconductors N.V.
- ROHM Semiconductors
- STMicroelectronics
- Murata Manufacturing Co.
- InvenSense Inc
- Maxim Integrated
- First Sensors AG
- LORD Microstrain
- TE Connectivity
- Xsens
- Sparton
- Airbus
- Al Cielo
- AOSense
- Astrium
- Autoflug
- Boeing
- CASC
- Civitanavi
- Colibrys
- ColdQuanta
- Doosan
- ElbitSystems (Elop)
- Elektropribor
- Emcore/Systron Donner
- Endevco
- Epson Toyocom
- FiberPro
- Fizoptika
- Freescale
- GEM Elettronica
- Gladiator Technologies
- Hitachi
Notable Milestones in Inertial Sensing Products Sector
- 2020: Launch of a new generation of high-precision MEMS gyroscopes by Analog Devices.
- 2021: Acquisition of a sensor technology company by Honeywell International Inc., expanding its product portfolio.
- 2022: Introduction of a novel sensor fusion algorithm by STMicroelectronics, enhancing accuracy and performance.
- 2023: Significant investment in R&D by several key players focusing on miniaturization and power efficiency.
- 2024: Several strategic partnerships formed between sensor manufacturers and automotive companies for ADAS development.
In-Depth Inertial Sensing Products Market Outlook
The Inertial Sensing Products market is poised for sustained growth, driven by continuous technological advancements, expanding applications across diverse sectors, and increasing demand from emerging economies. Strategic partnerships, investments in R&D, and the development of innovative sensor fusion technologies will further fuel market expansion. The market presents significant opportunities for established players and new entrants alike, creating a dynamic and competitive landscape. The long-term outlook is positive, with significant potential for market expansion in the coming years.
Inertial Sensing Products Segmentation
-
1. Application
- 1.1. Defense (Marine and Naval)
- 1.2. Aerospace
- 1.3. Mining
- 1.4. Automotive
- 1.5. Industrial
- 1.6. Automation
- 1.7. Gaming & Simulation
- 1.8. Vehicular Traffic Management
- 1.9. Others
-
2. Types
- 2.1. 1D Plane (x axis)
- 2.2. 2D Plane (x -y axis)
- 2.3. 3D Plane (x -y -z axis)
Inertial Sensing Products Segmentation By Geography
-
1. North America
- 1.1. United States
- 1.2. Canada
- 1.3. Mexico
-
2. South America
- 2.1. Brazil
- 2.2. Argentina
- 2.3. Rest of South America
-
3. Europe
- 3.1. United Kingdom
- 3.2. Germany
- 3.3. France
- 3.4. Italy
- 3.5. Spain
- 3.6. Russia
- 3.7. Benelux
- 3.8. Nordics
- 3.9. Rest of Europe
-
4. Middle East & Africa
- 4.1. Turkey
- 4.2. Israel
- 4.3. GCC
- 4.4. North Africa
- 4.5. South Africa
- 4.6. Rest of Middle East & Africa
-
5. Asia Pacific
- 5.1. China
- 5.2. India
- 5.3. Japan
- 5.4. South Korea
- 5.5. ASEAN
- 5.6. Oceania
- 5.7. Rest of Asia Pacific
Inertial Sensing Products REPORT HIGHLIGHTS
| Aspects | Details |
|---|---|
| Study Period | 2019-2033 |
| Base Year | 2024 |
| Estimated Year | 2025 |
| Forecast Period | 2025-2033 |
| Historical Period | 2019-2024 |
| Growth Rate | CAGR of XX% from 2019-2033 |
| Segmentation |
|
Table of Contents
- 1. Introduction
- 1.1. Research Scope
- 1.2. Market Segmentation
- 1.3. Research Methodology
- 1.4. Definitions and Assumptions
- 2. Executive Summary
- 2.1. Introduction
- 3. Market Dynamics
- 3.1. Introduction
- 3.2. Market Drivers
- 3.3. Market Restrains
- 3.4. Market Trends
- 4. Market Factor Analysis
- 4.1. Porters Five Forces
- 4.2. Supply/Value Chain
- 4.3. PESTEL analysis
- 4.4. Market Entropy
- 4.5. Patent/Trademark Analysis
- 5. Global Inertial Sensing Products Analysis, Insights and Forecast, 2019-2031
- 5.1. Market Analysis, Insights and Forecast - by Application
- 5.1.1. Defense (Marine and Naval)
- 5.1.2. Aerospace
- 5.1.3. Mining
- 5.1.4. Automotive
- 5.1.5. Industrial
- 5.1.6. Automation
- 5.1.7. Gaming & Simulation
- 5.1.8. Vehicular Traffic Management
- 5.1.9. Others
- 5.2. Market Analysis, Insights and Forecast - by Types
- 5.2.1. 1D Plane (x axis)
- 5.2.2. 2D Plane (x -y axis)
- 5.2.3. 3D Plane (x -y -z axis)
- 5.3. Market Analysis, Insights and Forecast - by Region
- 5.3.1. North America
- 5.3.2. South America
- 5.3.3. Europe
- 5.3.4. Middle East & Africa
- 5.3.5. Asia Pacific
- 5.1. Market Analysis, Insights and Forecast - by Application
- 6. North America Inertial Sensing Products Analysis, Insights and Forecast, 2019-2031
- 6.1. Market Analysis, Insights and Forecast - by Application
- 6.1.1. Defense (Marine and Naval)
- 6.1.2. Aerospace
- 6.1.3. Mining
- 6.1.4. Automotive
- 6.1.5. Industrial
- 6.1.6. Automation
- 6.1.7. Gaming & Simulation
- 6.1.8. Vehicular Traffic Management
- 6.1.9. Others
- 6.2. Market Analysis, Insights and Forecast - by Types
- 6.2.1. 1D Plane (x axis)
- 6.2.2. 2D Plane (x -y axis)
- 6.2.3. 3D Plane (x -y -z axis)
- 6.1. Market Analysis, Insights and Forecast - by Application
- 7. South America Inertial Sensing Products Analysis, Insights and Forecast, 2019-2031
- 7.1. Market Analysis, Insights and Forecast - by Application
- 7.1.1. Defense (Marine and Naval)
- 7.1.2. Aerospace
- 7.1.3. Mining
- 7.1.4. Automotive
- 7.1.5. Industrial
- 7.1.6. Automation
- 7.1.7. Gaming & Simulation
- 7.1.8. Vehicular Traffic Management
- 7.1.9. Others
- 7.2. Market Analysis, Insights and Forecast - by Types
- 7.2.1. 1D Plane (x axis)
- 7.2.2. 2D Plane (x -y axis)
- 7.2.3. 3D Plane (x -y -z axis)
- 7.1. Market Analysis, Insights and Forecast - by Application
- 8. Europe Inertial Sensing Products Analysis, Insights and Forecast, 2019-2031
- 8.1. Market Analysis, Insights and Forecast - by Application
- 8.1.1. Defense (Marine and Naval)
- 8.1.2. Aerospace
- 8.1.3. Mining
- 8.1.4. Automotive
- 8.1.5. Industrial
- 8.1.6. Automation
- 8.1.7. Gaming & Simulation
- 8.1.8. Vehicular Traffic Management
- 8.1.9. Others
- 8.2. Market Analysis, Insights and Forecast - by Types
- 8.2.1. 1D Plane (x axis)
- 8.2.2. 2D Plane (x -y axis)
- 8.2.3. 3D Plane (x -y -z axis)
- 8.1. Market Analysis, Insights and Forecast - by Application
- 9. Middle East & Africa Inertial Sensing Products Analysis, Insights and Forecast, 2019-2031
- 9.1. Market Analysis, Insights and Forecast - by Application
- 9.1.1. Defense (Marine and Naval)
- 9.1.2. Aerospace
- 9.1.3. Mining
- 9.1.4. Automotive
- 9.1.5. Industrial
- 9.1.6. Automation
- 9.1.7. Gaming & Simulation
- 9.1.8. Vehicular Traffic Management
- 9.1.9. Others
- 9.2. Market Analysis, Insights and Forecast - by Types
- 9.2.1. 1D Plane (x axis)
- 9.2.2. 2D Plane (x -y axis)
- 9.2.3. 3D Plane (x -y -z axis)
- 9.1. Market Analysis, Insights and Forecast - by Application
- 10. Asia Pacific Inertial Sensing Products Analysis, Insights and Forecast, 2019-2031
- 10.1. Market Analysis, Insights and Forecast - by Application
- 10.1.1. Defense (Marine and Naval)
- 10.1.2. Aerospace
- 10.1.3. Mining
- 10.1.4. Automotive
- 10.1.5. Industrial
- 10.1.6. Automation
- 10.1.7. Gaming & Simulation
- 10.1.8. Vehicular Traffic Management
- 10.1.9. Others
- 10.2. Market Analysis, Insights and Forecast - by Types
- 10.2.1. 1D Plane (x axis)
- 10.2.2. 2D Plane (x -y axis)
- 10.2.3. 3D Plane (x -y -z axis)
- 10.1. Market Analysis, Insights and Forecast - by Application
- 11. Competitive Analysis
- 11.1. Global Market Share Analysis 2024
- 11.2. Company Profiles
- 11.2.1 Honeywell International Inc
- 11.2.1.1. Overview
- 11.2.1.2. Products
- 11.2.1.3. SWOT Analysis
- 11.2.1.4. Recent Developments
- 11.2.1.5. Financials (Based on Availability)
- 11.2.2 Analog Devices
- 11.2.2.1. Overview
- 11.2.2.2. Products
- 11.2.2.3. SWOT Analysis
- 11.2.2.4. Recent Developments
- 11.2.2.5. Financials (Based on Availability)
- 11.2.3 NXP Semiconductors N.V.
- 11.2.3.1. Overview
- 11.2.3.2. Products
- 11.2.3.3. SWOT Analysis
- 11.2.3.4. Recent Developments
- 11.2.3.5. Financials (Based on Availability)
- 11.2.4 ROHM Semiconductors
- 11.2.4.1. Overview
- 11.2.4.2. Products
- 11.2.4.3. SWOT Analysis
- 11.2.4.4. Recent Developments
- 11.2.4.5. Financials (Based on Availability)
- 11.2.5 STMicroelectronics
- 11.2.5.1. Overview
- 11.2.5.2. Products
- 11.2.5.3. SWOT Analysis
- 11.2.5.4. Recent Developments
- 11.2.5.5. Financials (Based on Availability)
- 11.2.6 Murata Manufacturing Co.
- 11.2.6.1. Overview
- 11.2.6.2. Products
- 11.2.6.3. SWOT Analysis
- 11.2.6.4. Recent Developments
- 11.2.6.5. Financials (Based on Availability)
- 11.2.7 InvenSense Inc
- 11.2.7.1. Overview
- 11.2.7.2. Products
- 11.2.7.3. SWOT Analysis
- 11.2.7.4. Recent Developments
- 11.2.7.5. Financials (Based on Availability)
- 11.2.8 Maxim Integrated
- 11.2.8.1. Overview
- 11.2.8.2. Products
- 11.2.8.3. SWOT Analysis
- 11.2.8.4. Recent Developments
- 11.2.8.5. Financials (Based on Availability)
- 11.2.9 First Sensors AG
- 11.2.9.1. Overview
- 11.2.9.2. Products
- 11.2.9.3. SWOT Analysis
- 11.2.9.4. Recent Developments
- 11.2.9.5. Financials (Based on Availability)
- 11.2.10 LORD Microstrain.
- 11.2.10.1. Overview
- 11.2.10.2. Products
- 11.2.10.3. SWOT Analysis
- 11.2.10.4. Recent Developments
- 11.2.10.5. Financials (Based on Availability)
- 11.2.11 TE Connectivity
- 11.2.11.1. Overview
- 11.2.11.2. Products
- 11.2.11.3. SWOT Analysis
- 11.2.11.4. Recent Developments
- 11.2.11.5. Financials (Based on Availability)
- 11.2.12 Xsens
- 11.2.12.1. Overview
- 11.2.12.2. Products
- 11.2.12.3. SWOT Analysis
- 11.2.12.4. Recent Developments
- 11.2.12.5. Financials (Based on Availability)
- 11.2.13 Sparton
- 11.2.13.1. Overview
- 11.2.13.2. Products
- 11.2.13.3. SWOT Analysis
- 11.2.13.4. Recent Developments
- 11.2.13.5. Financials (Based on Availability)
- 11.2.14 Airbus
- 11.2.14.1. Overview
- 11.2.14.2. Products
- 11.2.14.3. SWOT Analysis
- 11.2.14.4. Recent Developments
- 11.2.14.5. Financials (Based on Availability)
- 11.2.15 Al Cielo
- 11.2.15.1. Overview
- 11.2.15.2. Products
- 11.2.15.3. SWOT Analysis
- 11.2.15.4. Recent Developments
- 11.2.15.5. Financials (Based on Availability)
- 11.2.16 AOSense
- 11.2.16.1. Overview
- 11.2.16.2. Products
- 11.2.16.3. SWOT Analysis
- 11.2.16.4. Recent Developments
- 11.2.16.5. Financials (Based on Availability)
- 11.2.17 Astrium
- 11.2.17.1. Overview
- 11.2.17.2. Products
- 11.2.17.3. SWOT Analysis
- 11.2.17.4. Recent Developments
- 11.2.17.5. Financials (Based on Availability)
- 11.2.18 Autoflug
- 11.2.18.1. Overview
- 11.2.18.2. Products
- 11.2.18.3. SWOT Analysis
- 11.2.18.4. Recent Developments
- 11.2.18.5. Financials (Based on Availability)
- 11.2.19 Boeing
- 11.2.19.1. Overview
- 11.2.19.2. Products
- 11.2.19.3. SWOT Analysis
- 11.2.19.4. Recent Developments
- 11.2.19.5. Financials (Based on Availability)
- 11.2.20 CASC
- 11.2.20.1. Overview
- 11.2.20.2. Products
- 11.2.20.3. SWOT Analysis
- 11.2.20.4. Recent Developments
- 11.2.20.5. Financials (Based on Availability)
- 11.2.21 Civitanavi
- 11.2.21.1. Overview
- 11.2.21.2. Products
- 11.2.21.3. SWOT Analysis
- 11.2.21.4. Recent Developments
- 11.2.21.5. Financials (Based on Availability)
- 11.2.22 Colibrys
- 11.2.22.1. Overview
- 11.2.22.2. Products
- 11.2.22.3. SWOT Analysis
- 11.2.22.4. Recent Developments
- 11.2.22.5. Financials (Based on Availability)
- 11.2.23 ColdQuanta
- 11.2.23.1. Overview
- 11.2.23.2. Products
- 11.2.23.3. SWOT Analysis
- 11.2.23.4. Recent Developments
- 11.2.23.5. Financials (Based on Availability)
- 11.2.24 Doosan
- 11.2.24.1. Overview
- 11.2.24.2. Products
- 11.2.24.3. SWOT Analysis
- 11.2.24.4. Recent Developments
- 11.2.24.5. Financials (Based on Availability)
- 11.2.25 ElbitSystems (Elop)
- 11.2.25.1. Overview
- 11.2.25.2. Products
- 11.2.25.3. SWOT Analysis
- 11.2.25.4. Recent Developments
- 11.2.25.5. Financials (Based on Availability)
- 11.2.26 Elektropribor
- 11.2.26.1. Overview
- 11.2.26.2. Products
- 11.2.26.3. SWOT Analysis
- 11.2.26.4. Recent Developments
- 11.2.26.5. Financials (Based on Availability)
- 11.2.27 Emcore/Systron Donner
- 11.2.27.1. Overview
- 11.2.27.2. Products
- 11.2.27.3. SWOT Analysis
- 11.2.27.4. Recent Developments
- 11.2.27.5. Financials (Based on Availability)
- 11.2.28 Endevco
- 11.2.28.1. Overview
- 11.2.28.2. Products
- 11.2.28.3. SWOT Analysis
- 11.2.28.4. Recent Developments
- 11.2.28.5. Financials (Based on Availability)
- 11.2.29 Epson Toyocom
- 11.2.29.1. Overview
- 11.2.29.2. Products
- 11.2.29.3. SWOT Analysis
- 11.2.29.4. Recent Developments
- 11.2.29.5. Financials (Based on Availability)
- 11.2.30 FiberPro
- 11.2.30.1. Overview
- 11.2.30.2. Products
- 11.2.30.3. SWOT Analysis
- 11.2.30.4. Recent Developments
- 11.2.30.5. Financials (Based on Availability)
- 11.2.31 Fizoptika
- 11.2.31.1. Overview
- 11.2.31.2. Products
- 11.2.31.3. SWOT Analysis
- 11.2.31.4. Recent Developments
- 11.2.31.5. Financials (Based on Availability)
- 11.2.32 Freescale
- 11.2.32.1. Overview
- 11.2.32.2. Products
- 11.2.32.3. SWOT Analysis
- 11.2.32.4. Recent Developments
- 11.2.32.5. Financials (Based on Availability)
- 11.2.33 GEM Elettronica
- 11.2.33.1. Overview
- 11.2.33.2. Products
- 11.2.33.3. SWOT Analysis
- 11.2.33.4. Recent Developments
- 11.2.33.5. Financials (Based on Availability)
- 11.2.34 Gladiator Technologies
- 11.2.34.1. Overview
- 11.2.34.2. Products
- 11.2.34.3. SWOT Analysis
- 11.2.34.4. Recent Developments
- 11.2.34.5. Financials (Based on Availability)
- 11.2.35 Hitachi
- 11.2.35.1. Overview
- 11.2.35.2. Products
- 11.2.35.3. SWOT Analysis
- 11.2.35.4. Recent Developments
- 11.2.35.5. Financials (Based on Availability)
- 11.2.1 Honeywell International Inc
List of Figures
- Figure 1: Global Inertial Sensing Products Revenue Breakdown (million, %) by Region 2024 & 2032
- Figure 2: Global Inertial Sensing Products Volume Breakdown (K, %) by Region 2024 & 2032
- Figure 3: North America Inertial Sensing Products Revenue (million), by Application 2024 & 2032
- Figure 4: North America Inertial Sensing Products Volume (K), by Application 2024 & 2032
- Figure 5: North America Inertial Sensing Products Revenue Share (%), by Application 2024 & 2032
- Figure 6: North America Inertial Sensing Products Volume Share (%), by Application 2024 & 2032
- Figure 7: North America Inertial Sensing Products Revenue (million), by Types 2024 & 2032
- Figure 8: North America Inertial Sensing Products Volume (K), by Types 2024 & 2032
- Figure 9: North America Inertial Sensing Products Revenue Share (%), by Types 2024 & 2032
- Figure 10: North America Inertial Sensing Products Volume Share (%), by Types 2024 & 2032
- Figure 11: North America Inertial Sensing Products Revenue (million), by Country 2024 & 2032
- Figure 12: North America Inertial Sensing Products Volume (K), by Country 2024 & 2032
- Figure 13: North America Inertial Sensing Products Revenue Share (%), by Country 2024 & 2032
- Figure 14: North America Inertial Sensing Products Volume Share (%), by Country 2024 & 2032
- Figure 15: South America Inertial Sensing Products Revenue (million), by Application 2024 & 2032
- Figure 16: South America Inertial Sensing Products Volume (K), by Application 2024 & 2032
- Figure 17: South America Inertial Sensing Products Revenue Share (%), by Application 2024 & 2032
- Figure 18: South America Inertial Sensing Products Volume Share (%), by Application 2024 & 2032
- Figure 19: South America Inertial Sensing Products Revenue (million), by Types 2024 & 2032
- Figure 20: South America Inertial Sensing Products Volume (K), by Types 2024 & 2032
- Figure 21: South America Inertial Sensing Products Revenue Share (%), by Types 2024 & 2032
- Figure 22: South America Inertial Sensing Products Volume Share (%), by Types 2024 & 2032
- Figure 23: South America Inertial Sensing Products Revenue (million), by Country 2024 & 2032
- Figure 24: South America Inertial Sensing Products Volume (K), by Country 2024 & 2032
- Figure 25: South America Inertial Sensing Products Revenue Share (%), by Country 2024 & 2032
- Figure 26: South America Inertial Sensing Products Volume Share (%), by Country 2024 & 2032
- Figure 27: Europe Inertial Sensing Products Revenue (million), by Application 2024 & 2032
- Figure 28: Europe Inertial Sensing Products Volume (K), by Application 2024 & 2032
- Figure 29: Europe Inertial Sensing Products Revenue Share (%), by Application 2024 & 2032
- Figure 30: Europe Inertial Sensing Products Volume Share (%), by Application 2024 & 2032
- Figure 31: Europe Inertial Sensing Products Revenue (million), by Types 2024 & 2032
- Figure 32: Europe Inertial Sensing Products Volume (K), by Types 2024 & 2032
- Figure 33: Europe Inertial Sensing Products Revenue Share (%), by Types 2024 & 2032
- Figure 34: Europe Inertial Sensing Products Volume Share (%), by Types 2024 & 2032
- Figure 35: Europe Inertial Sensing Products Revenue (million), by Country 2024 & 2032
- Figure 36: Europe Inertial Sensing Products Volume (K), by Country 2024 & 2032
- Figure 37: Europe Inertial Sensing Products Revenue Share (%), by Country 2024 & 2032
- Figure 38: Europe Inertial Sensing Products Volume Share (%), by Country 2024 & 2032
- Figure 39: Middle East & Africa Inertial Sensing Products Revenue (million), by Application 2024 & 2032
- Figure 40: Middle East & Africa Inertial Sensing Products Volume (K), by Application 2024 & 2032
- Figure 41: Middle East & Africa Inertial Sensing Products Revenue Share (%), by Application 2024 & 2032
- Figure 42: Middle East & Africa Inertial Sensing Products Volume Share (%), by Application 2024 & 2032
- Figure 43: Middle East & Africa Inertial Sensing Products Revenue (million), by Types 2024 & 2032
- Figure 44: Middle East & Africa Inertial Sensing Products Volume (K), by Types 2024 & 2032
- Figure 45: Middle East & Africa Inertial Sensing Products Revenue Share (%), by Types 2024 & 2032
- Figure 46: Middle East & Africa Inertial Sensing Products Volume Share (%), by Types 2024 & 2032
- Figure 47: Middle East & Africa Inertial Sensing Products Revenue (million), by Country 2024 & 2032
- Figure 48: Middle East & Africa Inertial Sensing Products Volume (K), by Country 2024 & 2032
- Figure 49: Middle East & Africa Inertial Sensing Products Revenue Share (%), by Country 2024 & 2032
- Figure 50: Middle East & Africa Inertial Sensing Products Volume Share (%), by Country 2024 & 2032
- Figure 51: Asia Pacific Inertial Sensing Products Revenue (million), by Application 2024 & 2032
- Figure 52: Asia Pacific Inertial Sensing Products Volume (K), by Application 2024 & 2032
- Figure 53: Asia Pacific Inertial Sensing Products Revenue Share (%), by Application 2024 & 2032
- Figure 54: Asia Pacific Inertial Sensing Products Volume Share (%), by Application 2024 & 2032
- Figure 55: Asia Pacific Inertial Sensing Products Revenue (million), by Types 2024 & 2032
- Figure 56: Asia Pacific Inertial Sensing Products Volume (K), by Types 2024 & 2032
- Figure 57: Asia Pacific Inertial Sensing Products Revenue Share (%), by Types 2024 & 2032
- Figure 58: Asia Pacific Inertial Sensing Products Volume Share (%), by Types 2024 & 2032
- Figure 59: Asia Pacific Inertial Sensing Products Revenue (million), by Country 2024 & 2032
- Figure 60: Asia Pacific Inertial Sensing Products Volume (K), by Country 2024 & 2032
- Figure 61: Asia Pacific Inertial Sensing Products Revenue Share (%), by Country 2024 & 2032
- Figure 62: Asia Pacific Inertial Sensing Products Volume Share (%), by Country 2024 & 2032
List of Tables
- Table 1: Global Inertial Sensing Products Revenue million Forecast, by Region 2019 & 2032
- Table 2: Global Inertial Sensing Products Volume K Forecast, by Region 2019 & 2032
- Table 3: Global Inertial Sensing Products Revenue million Forecast, by Application 2019 & 2032
- Table 4: Global Inertial Sensing Products Volume K Forecast, by Application 2019 & 2032
- Table 5: Global Inertial Sensing Products Revenue million Forecast, by Types 2019 & 2032
- Table 6: Global Inertial Sensing Products Volume K Forecast, by Types 2019 & 2032
- Table 7: Global Inertial Sensing Products Revenue million Forecast, by Region 2019 & 2032
- Table 8: Global Inertial Sensing Products Volume K Forecast, by Region 2019 & 2032
- Table 9: Global Inertial Sensing Products Revenue million Forecast, by Application 2019 & 2032
- Table 10: Global Inertial Sensing Products Volume K Forecast, by Application 2019 & 2032
- Table 11: Global Inertial Sensing Products Revenue million Forecast, by Types 2019 & 2032
- Table 12: Global Inertial Sensing Products Volume K Forecast, by Types 2019 & 2032
- Table 13: Global Inertial Sensing Products Revenue million Forecast, by Country 2019 & 2032
- Table 14: Global Inertial Sensing Products Volume K Forecast, by Country 2019 & 2032
- Table 15: United States Inertial Sensing Products Revenue (million) Forecast, by Application 2019 & 2032
- Table 16: United States Inertial Sensing Products Volume (K) Forecast, by Application 2019 & 2032
- Table 17: Canada Inertial Sensing Products Revenue (million) Forecast, by Application 2019 & 2032
- Table 18: Canada Inertial Sensing Products Volume (K) Forecast, by Application 2019 & 2032
- Table 19: Mexico Inertial Sensing Products Revenue (million) Forecast, by Application 2019 & 2032
- Table 20: Mexico Inertial Sensing Products Volume (K) Forecast, by Application 2019 & 2032
- Table 21: Global Inertial Sensing Products Revenue million Forecast, by Application 2019 & 2032
- Table 22: Global Inertial Sensing Products Volume K Forecast, by Application 2019 & 2032
- Table 23: Global Inertial Sensing Products Revenue million Forecast, by Types 2019 & 2032
- Table 24: Global Inertial Sensing Products Volume K Forecast, by Types 2019 & 2032
- Table 25: Global Inertial Sensing Products Revenue million Forecast, by Country 2019 & 2032
- Table 26: Global Inertial Sensing Products Volume K Forecast, by Country 2019 & 2032
- Table 27: Brazil Inertial Sensing Products Revenue (million) Forecast, by Application 2019 & 2032
- Table 28: Brazil Inertial Sensing Products Volume (K) Forecast, by Application 2019 & 2032
- Table 29: Argentina Inertial Sensing Products Revenue (million) Forecast, by Application 2019 & 2032
- Table 30: Argentina Inertial Sensing Products Volume (K) Forecast, by Application 2019 & 2032
- Table 31: Rest of South America Inertial Sensing Products Revenue (million) Forecast, by Application 2019 & 2032
- Table 32: Rest of South America Inertial Sensing Products Volume (K) Forecast, by Application 2019 & 2032
- Table 33: Global Inertial Sensing Products Revenue million Forecast, by Application 2019 & 2032
- Table 34: Global Inertial Sensing Products Volume K Forecast, by Application 2019 & 2032
- Table 35: Global Inertial Sensing Products Revenue million Forecast, by Types 2019 & 2032
- Table 36: Global Inertial Sensing Products Volume K Forecast, by Types 2019 & 2032
- Table 37: Global Inertial Sensing Products Revenue million Forecast, by Country 2019 & 2032
- Table 38: Global Inertial Sensing Products Volume K Forecast, by Country 2019 & 2032
- Table 39: United Kingdom Inertial Sensing Products Revenue (million) Forecast, by Application 2019 & 2032
- Table 40: United Kingdom Inertial Sensing Products Volume (K) Forecast, by Application 2019 & 2032
- Table 41: Germany Inertial Sensing Products Revenue (million) Forecast, by Application 2019 & 2032
- Table 42: Germany Inertial Sensing Products Volume (K) Forecast, by Application 2019 & 2032
- Table 43: France Inertial Sensing Products Revenue (million) Forecast, by Application 2019 & 2032
- Table 44: France Inertial Sensing Products Volume (K) Forecast, by Application 2019 & 2032
- Table 45: Italy Inertial Sensing Products Revenue (million) Forecast, by Application 2019 & 2032
- Table 46: Italy Inertial Sensing Products Volume (K) Forecast, by Application 2019 & 2032
- Table 47: Spain Inertial Sensing Products Revenue (million) Forecast, by Application 2019 & 2032
- Table 48: Spain Inertial Sensing Products Volume (K) Forecast, by Application 2019 & 2032
- Table 49: Russia Inertial Sensing Products Revenue (million) Forecast, by Application 2019 & 2032
- Table 50: Russia Inertial Sensing Products Volume (K) Forecast, by Application 2019 & 2032
- Table 51: Benelux Inertial Sensing Products Revenue (million) Forecast, by Application 2019 & 2032
- Table 52: Benelux Inertial Sensing Products Volume (K) Forecast, by Application 2019 & 2032
- Table 53: Nordics Inertial Sensing Products Revenue (million) Forecast, by Application 2019 & 2032
- Table 54: Nordics Inertial Sensing Products Volume (K) Forecast, by Application 2019 & 2032
- Table 55: Rest of Europe Inertial Sensing Products Revenue (million) Forecast, by Application 2019 & 2032
- Table 56: Rest of Europe Inertial Sensing Products Volume (K) Forecast, by Application 2019 & 2032
- Table 57: Global Inertial Sensing Products Revenue million Forecast, by Application 2019 & 2032
- Table 58: Global Inertial Sensing Products Volume K Forecast, by Application 2019 & 2032
- Table 59: Global Inertial Sensing Products Revenue million Forecast, by Types 2019 & 2032
- Table 60: Global Inertial Sensing Products Volume K Forecast, by Types 2019 & 2032
- Table 61: Global Inertial Sensing Products Revenue million Forecast, by Country 2019 & 2032
- Table 62: Global Inertial Sensing Products Volume K Forecast, by Country 2019 & 2032
- Table 63: Turkey Inertial Sensing Products Revenue (million) Forecast, by Application 2019 & 2032
- Table 64: Turkey Inertial Sensing Products Volume (K) Forecast, by Application 2019 & 2032
- Table 65: Israel Inertial Sensing Products Revenue (million) Forecast, by Application 2019 & 2032
- Table 66: Israel Inertial Sensing Products Volume (K) Forecast, by Application 2019 & 2032
- Table 67: GCC Inertial Sensing Products Revenue (million) Forecast, by Application 2019 & 2032
- Table 68: GCC Inertial Sensing Products Volume (K) Forecast, by Application 2019 & 2032
- Table 69: North Africa Inertial Sensing Products Revenue (million) Forecast, by Application 2019 & 2032
- Table 70: North Africa Inertial Sensing Products Volume (K) Forecast, by Application 2019 & 2032
- Table 71: South Africa Inertial Sensing Products Revenue (million) Forecast, by Application 2019 & 2032
- Table 72: South Africa Inertial Sensing Products Volume (K) Forecast, by Application 2019 & 2032
- Table 73: Rest of Middle East & Africa Inertial Sensing Products Revenue (million) Forecast, by Application 2019 & 2032
- Table 74: Rest of Middle East & Africa Inertial Sensing Products Volume (K) Forecast, by Application 2019 & 2032
- Table 75: Global Inertial Sensing Products Revenue million Forecast, by Application 2019 & 2032
- Table 76: Global Inertial Sensing Products Volume K Forecast, by Application 2019 & 2032
- Table 77: Global Inertial Sensing Products Revenue million Forecast, by Types 2019 & 2032
- Table 78: Global Inertial Sensing Products Volume K Forecast, by Types 2019 & 2032
- Table 79: Global Inertial Sensing Products Revenue million Forecast, by Country 2019 & 2032
- Table 80: Global Inertial Sensing Products Volume K Forecast, by Country 2019 & 2032
- Table 81: China Inertial Sensing Products Revenue (million) Forecast, by Application 2019 & 2032
- Table 82: China Inertial Sensing Products Volume (K) Forecast, by Application 2019 & 2032
- Table 83: India Inertial Sensing Products Revenue (million) Forecast, by Application 2019 & 2032
- Table 84: India Inertial Sensing Products Volume (K) Forecast, by Application 2019 & 2032
- Table 85: Japan Inertial Sensing Products Revenue (million) Forecast, by Application 2019 & 2032
- Table 86: Japan Inertial Sensing Products Volume (K) Forecast, by Application 2019 & 2032
- Table 87: South Korea Inertial Sensing Products Revenue (million) Forecast, by Application 2019 & 2032
- Table 88: South Korea Inertial Sensing Products Volume (K) Forecast, by Application 2019 & 2032
- Table 89: ASEAN Inertial Sensing Products Revenue (million) Forecast, by Application 2019 & 2032
- Table 90: ASEAN Inertial Sensing Products Volume (K) Forecast, by Application 2019 & 2032
- Table 91: Oceania Inertial Sensing Products Revenue (million) Forecast, by Application 2019 & 2032
- Table 92: Oceania Inertial Sensing Products Volume (K) Forecast, by Application 2019 & 2032
- Table 93: Rest of Asia Pacific Inertial Sensing Products Revenue (million) Forecast, by Application 2019 & 2032
- Table 94: Rest of Asia Pacific Inertial Sensing Products Volume (K) Forecast, by Application 2019 & 2032
Frequently Asked Questions
1. What is the projected Compound Annual Growth Rate (CAGR) of the Inertial Sensing Products?
The projected CAGR is approximately XX%.
2. Which companies are prominent players in the Inertial Sensing Products?
Key companies in the market include Honeywell International Inc, Analog Devices, NXP Semiconductors N.V., ROHM Semiconductors, STMicroelectronics, Murata Manufacturing Co., InvenSense Inc, Maxim Integrated, First Sensors AG, LORD Microstrain., TE Connectivity, Xsens, Sparton, Airbus, Al Cielo, AOSense, Astrium, Autoflug, Boeing, CASC, Civitanavi, Colibrys, ColdQuanta, Doosan, ElbitSystems (Elop), Elektropribor, Emcore/Systron Donner, Endevco, Epson Toyocom, FiberPro, Fizoptika, Freescale, GEM Elettronica, Gladiator Technologies, Hitachi.
3. What are the main segments of the Inertial Sensing Products?
The market segments include Application, Types.
4. Can you provide details about the market size?
The market size is estimated to be USD XXX million as of 2022.
5. What are some drivers contributing to market growth?
N/A
6. What are the notable trends driving market growth?
N/A
7. Are there any restraints impacting market growth?
N/A
8. Can you provide examples of recent developments in the market?
N/A
9. What pricing options are available for accessing the report?
Pricing options include single-user, multi-user, and enterprise licenses priced at USD 4350.00, USD 6525.00, and USD 8700.00 respectively.
10. Is the market size provided in terms of value or volume?
The market size is provided in terms of value, measured in million and volume, measured in K.
11. Are there any specific market keywords associated with the report?
Yes, the market keyword associated with the report is "Inertial Sensing Products," which aids in identifying and referencing the specific market segment covered.
12. How do I determine which pricing option suits my needs best?
The pricing options vary based on user requirements and access needs. Individual users may opt for single-user licenses, while businesses requiring broader access may choose multi-user or enterprise licenses for cost-effective access to the report.
13. Are there any additional resources or data provided in the Inertial Sensing Products report?
While the report offers comprehensive insights, it's advisable to review the specific contents or supplementary materials provided to ascertain if additional resources or data are available.
14. How can I stay updated on further developments or reports in the Inertial Sensing Products?
To stay informed about further developments, trends, and reports in the Inertial Sensing Products, consider subscribing to industry newsletters, following relevant companies and organizations, or regularly checking reputable industry news sources and publications.
Methodology
Step 1 - Identification of Relevant Samples Size from Population Database


Step 2 - Approaches for Defining Global Market Size (Value, Volume* & Price*)

Note*: In applicable scenarios
Step 3 - Data Sources
Primary Research
- Web Analytics
- Survey Reports
- Research Institute
- Latest Research Reports
- Opinion Leaders
Secondary Research
- Annual Reports
- White Paper
- Latest Press Release
- Industry Association
- Paid Database
- Investor Presentations

Step 4 - Data Triangulation
Involves using different sources of information in order to increase the validity of a study
These sources are likely to be stakeholders in a program - participants, other researchers, program staff, other community members, and so on.
Then we put all data in single framework & apply various statistical tools to find out the dynamic on the market.
During the analysis stage, feedback from the stakeholder groups would be compared to determine areas of agreement as well as areas of divergence
