

Key Insights
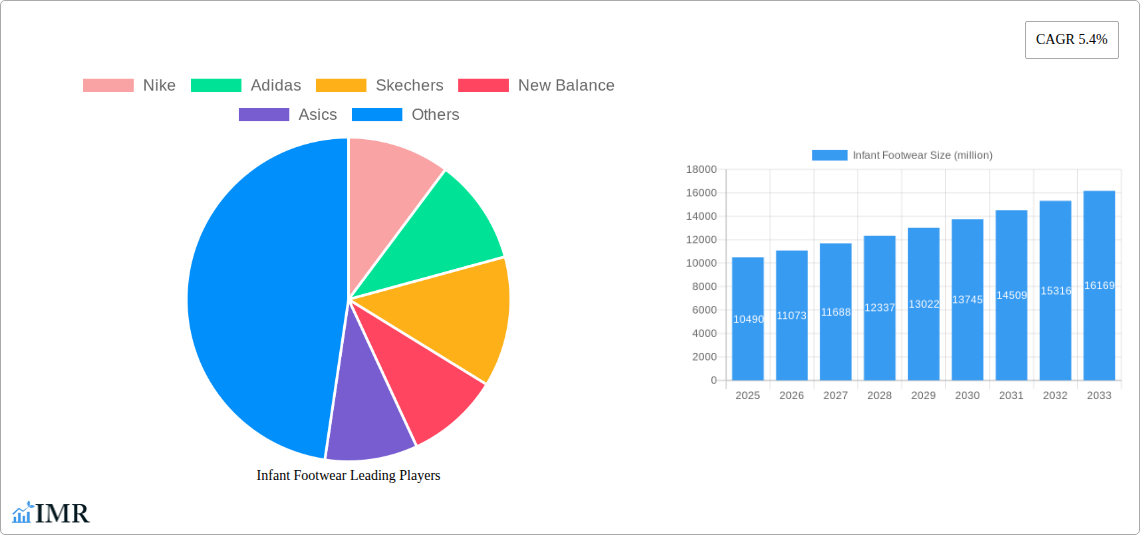
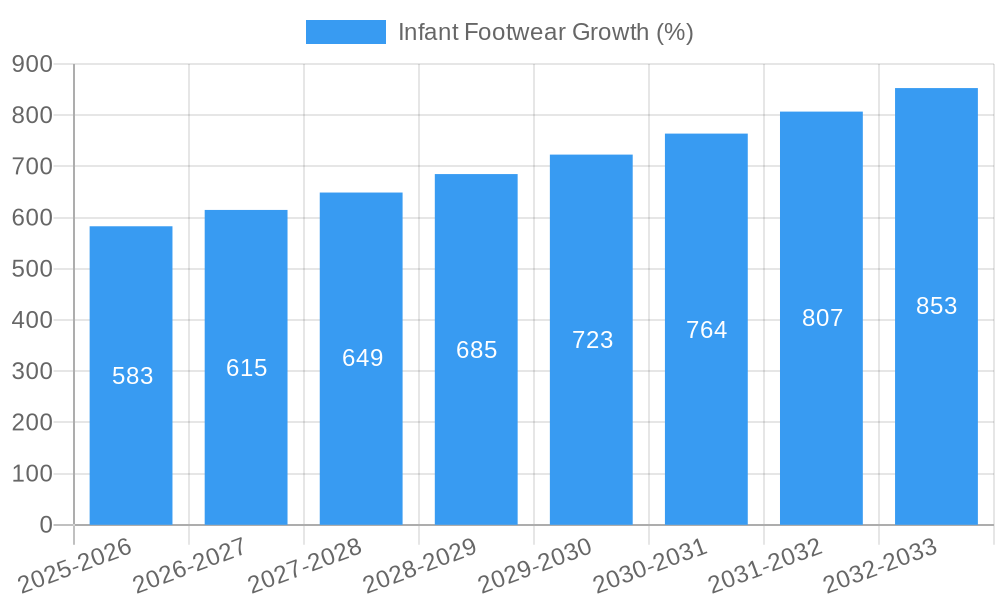
The global infant footwear market, valued at approximately $10.49 billion in 2025, is projected to experience robust growth, exhibiting a Compound Annual Growth Rate (CAGR) of 5.4% from 2025 to 2033. This expansion is fueled by several key factors. Firstly, rising disposable incomes in developing economies are increasing the purchasing power of parents, leading to higher spending on children's products, including footwear. Secondly, a growing awareness of the importance of proper foot development in early childhood is driving demand for comfortable, supportive, and high-quality infant shoes. Furthermore, the increasing prevalence of online retail channels provides convenient access to a wide variety of infant footwear options, boosting market reach and sales. The market also benefits from ongoing innovation in materials and designs, leading to improved comfort, durability, and aesthetic appeal. Competitive brands like Nike, Adidas, and Under Armour are increasingly focusing on this segment, introducing specialized lines that cater to the unique needs of infants.
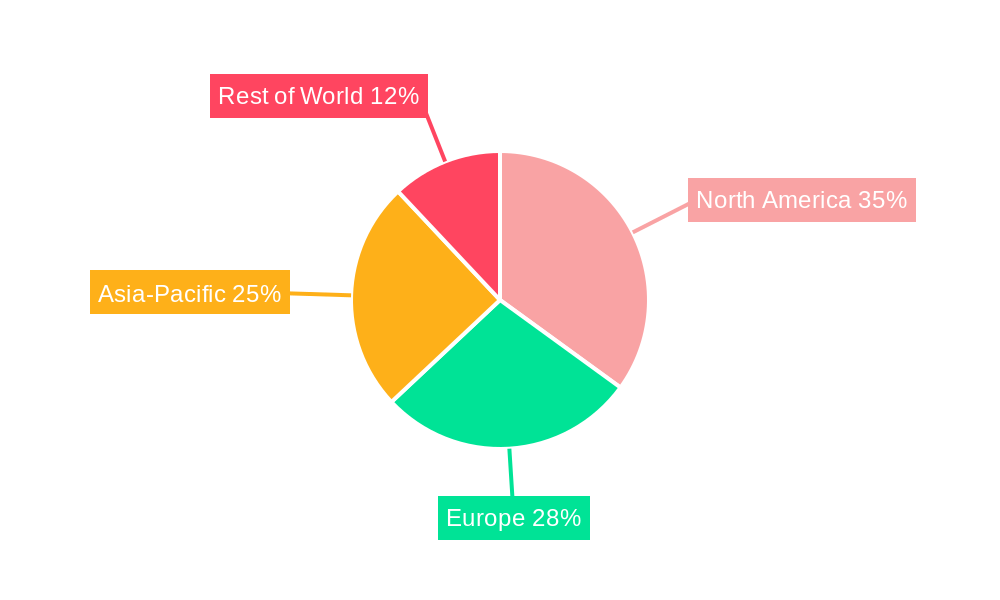
However, the market also faces certain challenges. Fluctuations in raw material prices, particularly for leather and synthetic materials, can impact production costs and profitability. Economic downturns or recessions can negatively influence consumer spending on non-essential items such as infant footwear. Additionally, the market is highly competitive, with established players and numerous smaller brands vying for market share. Successful players will need to prioritize product innovation, effective marketing strategies targeting parents, and efficient supply chain management to maintain a competitive edge. The increasing preference for eco-friendly and sustainable materials also presents an opportunity for brands to differentiate themselves and appeal to environmentally conscious consumers. Regionally, North America and Europe are expected to maintain significant market shares due to higher purchasing power and established brand presence, while emerging markets in Asia and Africa are anticipated to witness faster growth rates due to increasing urbanization and rising middle classes.
Infant Footwear Market Report: 2019-2033
This comprehensive report provides a detailed analysis of the global infant footwear market, offering invaluable insights for parents, industry professionals, and investors. Covering the period from 2019 to 2033, with a base year of 2025, this report examines market dynamics, growth trends, key players, and future opportunities within this dynamic sector. The report analyzes a market valued at xx million units in 2025, projecting significant growth to xx million units by 2033.
Infant Footwear Market Dynamics & Structure
The infant footwear market is a dynamic landscape shaped by several key factors. Market concentration is relatively high, with major players like Nike and Adidas holding significant shares. However, smaller brands and specialized retailers cater to niche segments, indicating a diverse competitive structure. Technological innovation, particularly in materials science (e.g., breathable fabrics, lightweight soles) and manufacturing processes, drives product differentiation and enhances comfort and safety. Regulatory frameworks concerning product safety and labeling vary across regions, impacting market access and compliance costs. While there are few direct substitutes for dedicated infant footwear, parents may opt for socks or booties as alternatives, particularly in lower price segments. End-user demographics, largely driven by birth rates and changing parental preferences, significantly influence market demand. M&A activity has been moderate in the recent past, with approximately xx deals recorded between 2019 and 2024, primarily focused on strengthening distribution networks and expanding product portfolios.
- Market Concentration: Highly concentrated with top 5 players holding xx% market share in 2025.
- Technological Innovation: Focus on lightweight, breathable materials, and ergonomic designs.
- Regulatory Landscape: Varied safety and labeling regulations across regions pose challenges.
- Substitutes: Limited direct substitutes, with socks and booties being primary alternatives.
- End-User Demographics: Birth rates and parental spending habits are key demographic drivers.
- M&A Activity: xx deals between 2019-2024, primarily for distribution expansion and product diversification.
Infant Footwear Growth Trends & Insights
The infant footwear market has demonstrated consistent growth throughout the historical period (2019-2024), with a CAGR of xx%. This growth is attributed to rising disposable incomes in emerging markets, increasing awareness of the importance of proper footwear for infant development, and the growing preference for specialized infant footwear over generic options. Technological advancements, including the introduction of innovative materials and designs, have further fueled market expansion. Consumer behavior shifts towards prioritizing comfort, safety, and style have driven demand for high-quality, durable, and aesthetically pleasing infant footwear. Market penetration remains relatively high in developed nations, leaving significant growth potential in emerging economies with increasing purchasing power. The adoption rate of premium infant footwear has witnessed a notable increase, reflecting parents' willingness to invest in quality products for their children’s well-being.
Dominant Regions, Countries, or Segments in Infant Footwear
The North American and European markets currently dominate the infant footwear market, driven by high consumer spending, established retail infrastructure, and strong brand presence. However, Asia-Pacific is exhibiting the fastest growth rate, fueled by a rapidly expanding middle class, increasing birth rates, and growing awareness of infant foot health. Within segments, premium infant footwear is experiencing accelerated growth, reflecting the increasing value placed on quality, safety, and unique features.
- Key Drivers (Asia-Pacific): Rapidly expanding middle class, rising birth rates, increasing disposable income, improving retail infrastructure.
- Dominance Factors (North America & Europe): High consumer spending, established retail networks, strong brand presence, high awareness of infant foot health.
- Growth Potential (Asia-Pacific): Untapped market potential in emerging economies and growing demand for premium products.
Infant Footwear Product Landscape
The infant footwear market offers a diverse range of products, encompassing crib shoes, soft-soled shoes, walking shoes, and sandals. Innovation focuses on breathable, lightweight materials, ergonomic designs that promote healthy foot development, and enhanced safety features. Unique selling propositions include features like adjustable closures, non-slip soles, and machine-washable fabrics. Technological advancements are reflected in the incorporation of antimicrobial treatments, advanced cushioning systems, and sustainable manufacturing practices.
Key Drivers, Barriers & Challenges in Infant Footwear
Key Drivers:
- Increasing disposable incomes in developing economies.
- Growing awareness of the importance of proper footwear for infant foot health.
- Technological innovations leading to more comfortable and safer products.
- Increasing preference for specialized infant footwear.
Challenges & Restraints:
- Fluctuations in raw material prices.
- Intense competition from both established brands and new entrants.
- Stringent regulatory requirements regarding product safety and labeling.
- Supply chain disruptions (e.g., material sourcing and logistics). These disruptions, estimated to have impacted xx million units of production in 2022, continue to pose a challenge.
Emerging Opportunities in Infant Footwear
- Expansion into untapped markets in developing countries.
- Development of sustainable and eco-friendly infant footwear.
- Growth of online retail channels and e-commerce platforms.
- Increasing demand for personalized and customized footwear.
Growth Accelerators in the Infant Footwear Industry
Technological breakthroughs in material science, leading to lighter, more durable, and more breathable materials, are key growth catalysts. Strategic partnerships between footwear brands and childcare experts can enhance product design and market appeal. Furthermore, the expansion into emerging markets and the utilization of effective marketing strategies targeting parents will significantly boost market growth.
Key Players Shaping the Infant Footwear Market
- Nike
- Adidas
- Skechers
- New Balance
- Asics
- Belle
- Nine West
- Puma
- Kering Group
- Wolverine Worldwide
- Clarks
- VF Corp
- ECCO
- Anta
- Under Armour
- Crocs Inc
- Geox
- Salvatore Ferragamo
- Daphne
- LI-NING
- Mizuno
- Red Dragonfly
- C.banner
- Peak
- K-Swiss
- KAPPA
- 361
Notable Milestones in Infant Footwear Sector
- 2020: Increased focus on sustainable and eco-friendly materials by several major players.
- 2021: Launch of several innovative footwear designs incorporating advanced cushioning and support technologies.
- 2022: Significant supply chain disruptions impacting production volumes across the industry.
- 2023: Growing adoption of online retail channels and e-commerce platforms by footwear brands.
In-Depth Infant Footwear Market Outlook
The infant footwear market is poised for sustained growth over the forecast period (2025-2033), driven by factors such as increasing birth rates in several regions, rising disposable incomes, and ongoing technological innovations. Strategic partnerships, market expansion into developing economies, and a focus on sustainable practices present significant opportunities for growth. The market's future potential is significant, with projected growth reaching xx million units by 2033, representing a substantial increase from the 2025 baseline.
Infant Footwear Segmentation
-
1. Application
- 1.1. Online
- 1.2. Offline
-
2. Types
- 2.1. Leather
- 2.2. Non Leather
Infant Footwear Segmentation By Geography
-
1. North America
- 1.1. United States
- 1.2. Canada
- 1.3. Mexico
-
2. South America
- 2.1. Brazil
- 2.2. Argentina
- 2.3. Rest of South America
-
3. Europe
- 3.1. United Kingdom
- 3.2. Germany
- 3.3. France
- 3.4. Italy
- 3.5. Spain
- 3.6. Russia
- 3.7. Benelux
- 3.8. Nordics
- 3.9. Rest of Europe
-
4. Middle East & Africa
- 4.1. Turkey
- 4.2. Israel
- 4.3. GCC
- 4.4. North Africa
- 4.5. South Africa
- 4.6. Rest of Middle East & Africa
-
5. Asia Pacific
- 5.1. China
- 5.2. India
- 5.3. Japan
- 5.4. South Korea
- 5.5. ASEAN
- 5.6. Oceania
- 5.7. Rest of Asia Pacific
Infant Footwear REPORT HIGHLIGHTS
| Aspects | Details |
|---|---|
| Study Period | 2019-2033 |
| Base Year | 2024 |
| Estimated Year | 2025 |
| Forecast Period | 2025-2033 |
| Historical Period | 2019-2024 |
| Growth Rate | CAGR of 5.4% from 2019-2033 |
| Segmentation |
|
Table of Contents
- 1. Introduction
- 1.1. Research Scope
- 1.2. Market Segmentation
- 1.3. Research Methodology
- 1.4. Definitions and Assumptions
- 2. Executive Summary
- 2.1. Introduction
- 3. Market Dynamics
- 3.1. Introduction
- 3.2. Market Drivers
- 3.3. Market Restrains
- 3.4. Market Trends
- 4. Market Factor Analysis
- 4.1. Porters Five Forces
- 4.2. Supply/Value Chain
- 4.3. PESTEL analysis
- 4.4. Market Entropy
- 4.5. Patent/Trademark Analysis
- 5. Global Infant Footwear Analysis, Insights and Forecast, 2019-2031
- 5.1. Market Analysis, Insights and Forecast - by Application
- 5.1.1. Online
- 5.1.2. Offline
- 5.2. Market Analysis, Insights and Forecast - by Types
- 5.2.1. Leather
- 5.2.2. Non Leather
- 5.3. Market Analysis, Insights and Forecast - by Region
- 5.3.1. North America
- 5.3.2. South America
- 5.3.3. Europe
- 5.3.4. Middle East & Africa
- 5.3.5. Asia Pacific
- 5.1. Market Analysis, Insights and Forecast - by Application
- 6. North America Infant Footwear Analysis, Insights and Forecast, 2019-2031
- 6.1. Market Analysis, Insights and Forecast - by Application
- 6.1.1. Online
- 6.1.2. Offline
- 6.2. Market Analysis, Insights and Forecast - by Types
- 6.2.1. Leather
- 6.2.2. Non Leather
- 6.1. Market Analysis, Insights and Forecast - by Application
- 7. South America Infant Footwear Analysis, Insights and Forecast, 2019-2031
- 7.1. Market Analysis, Insights and Forecast - by Application
- 7.1.1. Online
- 7.1.2. Offline
- 7.2. Market Analysis, Insights and Forecast - by Types
- 7.2.1. Leather
- 7.2.2. Non Leather
- 7.1. Market Analysis, Insights and Forecast - by Application
- 8. Europe Infant Footwear Analysis, Insights and Forecast, 2019-2031
- 8.1. Market Analysis, Insights and Forecast - by Application
- 8.1.1. Online
- 8.1.2. Offline
- 8.2. Market Analysis, Insights and Forecast - by Types
- 8.2.1. Leather
- 8.2.2. Non Leather
- 8.1. Market Analysis, Insights and Forecast - by Application
- 9. Middle East & Africa Infant Footwear Analysis, Insights and Forecast, 2019-2031
- 9.1. Market Analysis, Insights and Forecast - by Application
- 9.1.1. Online
- 9.1.2. Offline
- 9.2. Market Analysis, Insights and Forecast - by Types
- 9.2.1. Leather
- 9.2.2. Non Leather
- 9.1. Market Analysis, Insights and Forecast - by Application
- 10. Asia Pacific Infant Footwear Analysis, Insights and Forecast, 2019-2031
- 10.1. Market Analysis, Insights and Forecast - by Application
- 10.1.1. Online
- 10.1.2. Offline
- 10.2. Market Analysis, Insights and Forecast - by Types
- 10.2.1. Leather
- 10.2.2. Non Leather
- 10.1. Market Analysis, Insights and Forecast - by Application
- 11. Competitive Analysis
- 11.1. Global Market Share Analysis 2024
- 11.2. Company Profiles
- 11.2.1 Nike
- 11.2.1.1. Overview
- 11.2.1.2. Products
- 11.2.1.3. SWOT Analysis
- 11.2.1.4. Recent Developments
- 11.2.1.5. Financials (Based on Availability)
- 11.2.2 Adidas
- 11.2.2.1. Overview
- 11.2.2.2. Products
- 11.2.2.3. SWOT Analysis
- 11.2.2.4. Recent Developments
- 11.2.2.5. Financials (Based on Availability)
- 11.2.3 Skechers
- 11.2.3.1. Overview
- 11.2.3.2. Products
- 11.2.3.3. SWOT Analysis
- 11.2.3.4. Recent Developments
- 11.2.3.5. Financials (Based on Availability)
- 11.2.4 New Balance
- 11.2.4.1. Overview
- 11.2.4.2. Products
- 11.2.4.3. SWOT Analysis
- 11.2.4.4. Recent Developments
- 11.2.4.5. Financials (Based on Availability)
- 11.2.5 Asics
- 11.2.5.1. Overview
- 11.2.5.2. Products
- 11.2.5.3. SWOT Analysis
- 11.2.5.4. Recent Developments
- 11.2.5.5. Financials (Based on Availability)
- 11.2.6 Belle
- 11.2.6.1. Overview
- 11.2.6.2. Products
- 11.2.6.3. SWOT Analysis
- 11.2.6.4. Recent Developments
- 11.2.6.5. Financials (Based on Availability)
- 11.2.7 Nine West
- 11.2.7.1. Overview
- 11.2.7.2. Products
- 11.2.7.3. SWOT Analysis
- 11.2.7.4. Recent Developments
- 11.2.7.5. Financials (Based on Availability)
- 11.2.8 Puma
- 11.2.8.1. Overview
- 11.2.8.2. Products
- 11.2.8.3. SWOT Analysis
- 11.2.8.4. Recent Developments
- 11.2.8.5. Financials (Based on Availability)
- 11.2.9 Kering Group
- 11.2.9.1. Overview
- 11.2.9.2. Products
- 11.2.9.3. SWOT Analysis
- 11.2.9.4. Recent Developments
- 11.2.9.5. Financials (Based on Availability)
- 11.2.10 Wolverine Worldwide
- 11.2.10.1. Overview
- 11.2.10.2. Products
- 11.2.10.3. SWOT Analysis
- 11.2.10.4. Recent Developments
- 11.2.10.5. Financials (Based on Availability)
- 11.2.11 Clarks
- 11.2.11.1. Overview
- 11.2.11.2. Products
- 11.2.11.3. SWOT Analysis
- 11.2.11.4. Recent Developments
- 11.2.11.5. Financials (Based on Availability)
- 11.2.12 VF Corp
- 11.2.12.1. Overview
- 11.2.12.2. Products
- 11.2.12.3. SWOT Analysis
- 11.2.12.4. Recent Developments
- 11.2.12.5. Financials (Based on Availability)
- 11.2.13 ECCO
- 11.2.13.1. Overview
- 11.2.13.2. Products
- 11.2.13.3. SWOT Analysis
- 11.2.13.4. Recent Developments
- 11.2.13.5. Financials (Based on Availability)
- 11.2.14 Anta
- 11.2.14.1. Overview
- 11.2.14.2. Products
- 11.2.14.3. SWOT Analysis
- 11.2.14.4. Recent Developments
- 11.2.14.5. Financials (Based on Availability)
- 11.2.15 Under Armour
- 11.2.15.1. Overview
- 11.2.15.2. Products
- 11.2.15.3. SWOT Analysis
- 11.2.15.4. Recent Developments
- 11.2.15.5. Financials (Based on Availability)
- 11.2.16 Crocs Inc
- 11.2.16.1. Overview
- 11.2.16.2. Products
- 11.2.16.3. SWOT Analysis
- 11.2.16.4. Recent Developments
- 11.2.16.5. Financials (Based on Availability)
- 11.2.17 Geox
- 11.2.17.1. Overview
- 11.2.17.2. Products
- 11.2.17.3. SWOT Analysis
- 11.2.17.4. Recent Developments
- 11.2.17.5. Financials (Based on Availability)
- 11.2.18 Salvatore Ferragamo
- 11.2.18.1. Overview
- 11.2.18.2. Products
- 11.2.18.3. SWOT Analysis
- 11.2.18.4. Recent Developments
- 11.2.18.5. Financials (Based on Availability)
- 11.2.19 Daphne
- 11.2.19.1. Overview
- 11.2.19.2. Products
- 11.2.19.3. SWOT Analysis
- 11.2.19.4. Recent Developments
- 11.2.19.5. Financials (Based on Availability)
- 11.2.20 LI-NING
- 11.2.20.1. Overview
- 11.2.20.2. Products
- 11.2.20.3. SWOT Analysis
- 11.2.20.4. Recent Developments
- 11.2.20.5. Financials (Based on Availability)
- 11.2.21 Mizuno
- 11.2.21.1. Overview
- 11.2.21.2. Products
- 11.2.21.3. SWOT Analysis
- 11.2.21.4. Recent Developments
- 11.2.21.5. Financials (Based on Availability)
- 11.2.22 Red Dragonfly
- 11.2.22.1. Overview
- 11.2.22.2. Products
- 11.2.22.3. SWOT Analysis
- 11.2.22.4. Recent Developments
- 11.2.22.5. Financials (Based on Availability)
- 11.2.23 C.banner
- 11.2.23.1. Overview
- 11.2.23.2. Products
- 11.2.23.3. SWOT Analysis
- 11.2.23.4. Recent Developments
- 11.2.23.5. Financials (Based on Availability)
- 11.2.24 Peak
- 11.2.24.1. Overview
- 11.2.24.2. Products
- 11.2.24.3. SWOT Analysis
- 11.2.24.4. Recent Developments
- 11.2.24.5. Financials (Based on Availability)
- 11.2.25 K-Swiss
- 11.2.25.1. Overview
- 11.2.25.2. Products
- 11.2.25.3. SWOT Analysis
- 11.2.25.4. Recent Developments
- 11.2.25.5. Financials (Based on Availability)
- 11.2.26 KAPPA
- 11.2.26.1. Overview
- 11.2.26.2. Products
- 11.2.26.3. SWOT Analysis
- 11.2.26.4. Recent Developments
- 11.2.26.5. Financials (Based on Availability)
- 11.2.27 361
- 11.2.27.1. Overview
- 11.2.27.2. Products
- 11.2.27.3. SWOT Analysis
- 11.2.27.4. Recent Developments
- 11.2.27.5. Financials (Based on Availability)
- 11.2.1 Nike
List of Figures
- Figure 1: Global Infant Footwear Revenue Breakdown (million, %) by Region 2024 & 2032
- Figure 2: Global Infant Footwear Volume Breakdown (K, %) by Region 2024 & 2032
- Figure 3: North America Infant Footwear Revenue (million), by Application 2024 & 2032
- Figure 4: North America Infant Footwear Volume (K), by Application 2024 & 2032
- Figure 5: North America Infant Footwear Revenue Share (%), by Application 2024 & 2032
- Figure 6: North America Infant Footwear Volume Share (%), by Application 2024 & 2032
- Figure 7: North America Infant Footwear Revenue (million), by Types 2024 & 2032
- Figure 8: North America Infant Footwear Volume (K), by Types 2024 & 2032
- Figure 9: North America Infant Footwear Revenue Share (%), by Types 2024 & 2032
- Figure 10: North America Infant Footwear Volume Share (%), by Types 2024 & 2032
- Figure 11: North America Infant Footwear Revenue (million), by Country 2024 & 2032
- Figure 12: North America Infant Footwear Volume (K), by Country 2024 & 2032
- Figure 13: North America Infant Footwear Revenue Share (%), by Country 2024 & 2032
- Figure 14: North America Infant Footwear Volume Share (%), by Country 2024 & 2032
- Figure 15: South America Infant Footwear Revenue (million), by Application 2024 & 2032
- Figure 16: South America Infant Footwear Volume (K), by Application 2024 & 2032
- Figure 17: South America Infant Footwear Revenue Share (%), by Application 2024 & 2032
- Figure 18: South America Infant Footwear Volume Share (%), by Application 2024 & 2032
- Figure 19: South America Infant Footwear Revenue (million), by Types 2024 & 2032
- Figure 20: South America Infant Footwear Volume (K), by Types 2024 & 2032
- Figure 21: South America Infant Footwear Revenue Share (%), by Types 2024 & 2032
- Figure 22: South America Infant Footwear Volume Share (%), by Types 2024 & 2032
- Figure 23: South America Infant Footwear Revenue (million), by Country 2024 & 2032
- Figure 24: South America Infant Footwear Volume (K), by Country 2024 & 2032
- Figure 25: South America Infant Footwear Revenue Share (%), by Country 2024 & 2032
- Figure 26: South America Infant Footwear Volume Share (%), by Country 2024 & 2032
- Figure 27: Europe Infant Footwear Revenue (million), by Application 2024 & 2032
- Figure 28: Europe Infant Footwear Volume (K), by Application 2024 & 2032
- Figure 29: Europe Infant Footwear Revenue Share (%), by Application 2024 & 2032
- Figure 30: Europe Infant Footwear Volume Share (%), by Application 2024 & 2032
- Figure 31: Europe Infant Footwear Revenue (million), by Types 2024 & 2032
- Figure 32: Europe Infant Footwear Volume (K), by Types 2024 & 2032
- Figure 33: Europe Infant Footwear Revenue Share (%), by Types 2024 & 2032
- Figure 34: Europe Infant Footwear Volume Share (%), by Types 2024 & 2032
- Figure 35: Europe Infant Footwear Revenue (million), by Country 2024 & 2032
- Figure 36: Europe Infant Footwear Volume (K), by Country 2024 & 2032
- Figure 37: Europe Infant Footwear Revenue Share (%), by Country 2024 & 2032
- Figure 38: Europe Infant Footwear Volume Share (%), by Country 2024 & 2032
- Figure 39: Middle East & Africa Infant Footwear Revenue (million), by Application 2024 & 2032
- Figure 40: Middle East & Africa Infant Footwear Volume (K), by Application 2024 & 2032
- Figure 41: Middle East & Africa Infant Footwear Revenue Share (%), by Application 2024 & 2032
- Figure 42: Middle East & Africa Infant Footwear Volume Share (%), by Application 2024 & 2032
- Figure 43: Middle East & Africa Infant Footwear Revenue (million), by Types 2024 & 2032
- Figure 44: Middle East & Africa Infant Footwear Volume (K), by Types 2024 & 2032
- Figure 45: Middle East & Africa Infant Footwear Revenue Share (%), by Types 2024 & 2032
- Figure 46: Middle East & Africa Infant Footwear Volume Share (%), by Types 2024 & 2032
- Figure 47: Middle East & Africa Infant Footwear Revenue (million), by Country 2024 & 2032
- Figure 48: Middle East & Africa Infant Footwear Volume (K), by Country 2024 & 2032
- Figure 49: Middle East & Africa Infant Footwear Revenue Share (%), by Country 2024 & 2032
- Figure 50: Middle East & Africa Infant Footwear Volume Share (%), by Country 2024 & 2032
- Figure 51: Asia Pacific Infant Footwear Revenue (million), by Application 2024 & 2032
- Figure 52: Asia Pacific Infant Footwear Volume (K), by Application 2024 & 2032
- Figure 53: Asia Pacific Infant Footwear Revenue Share (%), by Application 2024 & 2032
- Figure 54: Asia Pacific Infant Footwear Volume Share (%), by Application 2024 & 2032
- Figure 55: Asia Pacific Infant Footwear Revenue (million), by Types 2024 & 2032
- Figure 56: Asia Pacific Infant Footwear Volume (K), by Types 2024 & 2032
- Figure 57: Asia Pacific Infant Footwear Revenue Share (%), by Types 2024 & 2032
- Figure 58: Asia Pacific Infant Footwear Volume Share (%), by Types 2024 & 2032
- Figure 59: Asia Pacific Infant Footwear Revenue (million), by Country 2024 & 2032
- Figure 60: Asia Pacific Infant Footwear Volume (K), by Country 2024 & 2032
- Figure 61: Asia Pacific Infant Footwear Revenue Share (%), by Country 2024 & 2032
- Figure 62: Asia Pacific Infant Footwear Volume Share (%), by Country 2024 & 2032
List of Tables
- Table 1: Global Infant Footwear Revenue million Forecast, by Region 2019 & 2032
- Table 2: Global Infant Footwear Volume K Forecast, by Region 2019 & 2032
- Table 3: Global Infant Footwear Revenue million Forecast, by Application 2019 & 2032
- Table 4: Global Infant Footwear Volume K Forecast, by Application 2019 & 2032
- Table 5: Global Infant Footwear Revenue million Forecast, by Types 2019 & 2032
- Table 6: Global Infant Footwear Volume K Forecast, by Types 2019 & 2032
- Table 7: Global Infant Footwear Revenue million Forecast, by Region 2019 & 2032
- Table 8: Global Infant Footwear Volume K Forecast, by Region 2019 & 2032
- Table 9: Global Infant Footwear Revenue million Forecast, by Application 2019 & 2032
- Table 10: Global Infant Footwear Volume K Forecast, by Application 2019 & 2032
- Table 11: Global Infant Footwear Revenue million Forecast, by Types 2019 & 2032
- Table 12: Global Infant Footwear Volume K Forecast, by Types 2019 & 2032
- Table 13: Global Infant Footwear Revenue million Forecast, by Country 2019 & 2032
- Table 14: Global Infant Footwear Volume K Forecast, by Country 2019 & 2032
- Table 15: United States Infant Footwear Revenue (million) Forecast, by Application 2019 & 2032
- Table 16: United States Infant Footwear Volume (K) Forecast, by Application 2019 & 2032
- Table 17: Canada Infant Footwear Revenue (million) Forecast, by Application 2019 & 2032
- Table 18: Canada Infant Footwear Volume (K) Forecast, by Application 2019 & 2032
- Table 19: Mexico Infant Footwear Revenue (million) Forecast, by Application 2019 & 2032
- Table 20: Mexico Infant Footwear Volume (K) Forecast, by Application 2019 & 2032
- Table 21: Global Infant Footwear Revenue million Forecast, by Application 2019 & 2032
- Table 22: Global Infant Footwear Volume K Forecast, by Application 2019 & 2032
- Table 23: Global Infant Footwear Revenue million Forecast, by Types 2019 & 2032
- Table 24: Global Infant Footwear Volume K Forecast, by Types 2019 & 2032
- Table 25: Global Infant Footwear Revenue million Forecast, by Country 2019 & 2032
- Table 26: Global Infant Footwear Volume K Forecast, by Country 2019 & 2032
- Table 27: Brazil Infant Footwear Revenue (million) Forecast, by Application 2019 & 2032
- Table 28: Brazil Infant Footwear Volume (K) Forecast, by Application 2019 & 2032
- Table 29: Argentina Infant Footwear Revenue (million) Forecast, by Application 2019 & 2032
- Table 30: Argentina Infant Footwear Volume (K) Forecast, by Application 2019 & 2032
- Table 31: Rest of South America Infant Footwear Revenue (million) Forecast, by Application 2019 & 2032
- Table 32: Rest of South America Infant Footwear Volume (K) Forecast, by Application 2019 & 2032
- Table 33: Global Infant Footwear Revenue million Forecast, by Application 2019 & 2032
- Table 34: Global Infant Footwear Volume K Forecast, by Application 2019 & 2032
- Table 35: Global Infant Footwear Revenue million Forecast, by Types 2019 & 2032
- Table 36: Global Infant Footwear Volume K Forecast, by Types 2019 & 2032
- Table 37: Global Infant Footwear Revenue million Forecast, by Country 2019 & 2032
- Table 38: Global Infant Footwear Volume K Forecast, by Country 2019 & 2032
- Table 39: United Kingdom Infant Footwear Revenue (million) Forecast, by Application 2019 & 2032
- Table 40: United Kingdom Infant Footwear Volume (K) Forecast, by Application 2019 & 2032
- Table 41: Germany Infant Footwear Revenue (million) Forecast, by Application 2019 & 2032
- Table 42: Germany Infant Footwear Volume (K) Forecast, by Application 2019 & 2032
- Table 43: France Infant Footwear Revenue (million) Forecast, by Application 2019 & 2032
- Table 44: France Infant Footwear Volume (K) Forecast, by Application 2019 & 2032
- Table 45: Italy Infant Footwear Revenue (million) Forecast, by Application 2019 & 2032
- Table 46: Italy Infant Footwear Volume (K) Forecast, by Application 2019 & 2032
- Table 47: Spain Infant Footwear Revenue (million) Forecast, by Application 2019 & 2032
- Table 48: Spain Infant Footwear Volume (K) Forecast, by Application 2019 & 2032
- Table 49: Russia Infant Footwear Revenue (million) Forecast, by Application 2019 & 2032
- Table 50: Russia Infant Footwear Volume (K) Forecast, by Application 2019 & 2032
- Table 51: Benelux Infant Footwear Revenue (million) Forecast, by Application 2019 & 2032
- Table 52: Benelux Infant Footwear Volume (K) Forecast, by Application 2019 & 2032
- Table 53: Nordics Infant Footwear Revenue (million) Forecast, by Application 2019 & 2032
- Table 54: Nordics Infant Footwear Volume (K) Forecast, by Application 2019 & 2032
- Table 55: Rest of Europe Infant Footwear Revenue (million) Forecast, by Application 2019 & 2032
- Table 56: Rest of Europe Infant Footwear Volume (K) Forecast, by Application 2019 & 2032
- Table 57: Global Infant Footwear Revenue million Forecast, by Application 2019 & 2032
- Table 58: Global Infant Footwear Volume K Forecast, by Application 2019 & 2032
- Table 59: Global Infant Footwear Revenue million Forecast, by Types 2019 & 2032
- Table 60: Global Infant Footwear Volume K Forecast, by Types 2019 & 2032
- Table 61: Global Infant Footwear Revenue million Forecast, by Country 2019 & 2032
- Table 62: Global Infant Footwear Volume K Forecast, by Country 2019 & 2032
- Table 63: Turkey Infant Footwear Revenue (million) Forecast, by Application 2019 & 2032
- Table 64: Turkey Infant Footwear Volume (K) Forecast, by Application 2019 & 2032
- Table 65: Israel Infant Footwear Revenue (million) Forecast, by Application 2019 & 2032
- Table 66: Israel Infant Footwear Volume (K) Forecast, by Application 2019 & 2032
- Table 67: GCC Infant Footwear Revenue (million) Forecast, by Application 2019 & 2032
- Table 68: GCC Infant Footwear Volume (K) Forecast, by Application 2019 & 2032
- Table 69: North Africa Infant Footwear Revenue (million) Forecast, by Application 2019 & 2032
- Table 70: North Africa Infant Footwear Volume (K) Forecast, by Application 2019 & 2032
- Table 71: South Africa Infant Footwear Revenue (million) Forecast, by Application 2019 & 2032
- Table 72: South Africa Infant Footwear Volume (K) Forecast, by Application 2019 & 2032
- Table 73: Rest of Middle East & Africa Infant Footwear Revenue (million) Forecast, by Application 2019 & 2032
- Table 74: Rest of Middle East & Africa Infant Footwear Volume (K) Forecast, by Application 2019 & 2032
- Table 75: Global Infant Footwear Revenue million Forecast, by Application 2019 & 2032
- Table 76: Global Infant Footwear Volume K Forecast, by Application 2019 & 2032
- Table 77: Global Infant Footwear Revenue million Forecast, by Types 2019 & 2032
- Table 78: Global Infant Footwear Volume K Forecast, by Types 2019 & 2032
- Table 79: Global Infant Footwear Revenue million Forecast, by Country 2019 & 2032
- Table 80: Global Infant Footwear Volume K Forecast, by Country 2019 & 2032
- Table 81: China Infant Footwear Revenue (million) Forecast, by Application 2019 & 2032
- Table 82: China Infant Footwear Volume (K) Forecast, by Application 2019 & 2032
- Table 83: India Infant Footwear Revenue (million) Forecast, by Application 2019 & 2032
- Table 84: India Infant Footwear Volume (K) Forecast, by Application 2019 & 2032
- Table 85: Japan Infant Footwear Revenue (million) Forecast, by Application 2019 & 2032
- Table 86: Japan Infant Footwear Volume (K) Forecast, by Application 2019 & 2032
- Table 87: South Korea Infant Footwear Revenue (million) Forecast, by Application 2019 & 2032
- Table 88: South Korea Infant Footwear Volume (K) Forecast, by Application 2019 & 2032
- Table 89: ASEAN Infant Footwear Revenue (million) Forecast, by Application 2019 & 2032
- Table 90: ASEAN Infant Footwear Volume (K) Forecast, by Application 2019 & 2032
- Table 91: Oceania Infant Footwear Revenue (million) Forecast, by Application 2019 & 2032
- Table 92: Oceania Infant Footwear Volume (K) Forecast, by Application 2019 & 2032
- Table 93: Rest of Asia Pacific Infant Footwear Revenue (million) Forecast, by Application 2019 & 2032
- Table 94: Rest of Asia Pacific Infant Footwear Volume (K) Forecast, by Application 2019 & 2032
Frequently Asked Questions
1. What is the projected Compound Annual Growth Rate (CAGR) of the Infant Footwear?
The projected CAGR is approximately 5.4%.
2. Which companies are prominent players in the Infant Footwear?
Key companies in the market include Nike, Adidas, Skechers, New Balance, Asics, Belle, Nine West, Puma, Kering Group, Wolverine Worldwide, Clarks, VF Corp, ECCO, Anta, Under Armour, Crocs Inc, Geox, Salvatore Ferragamo, Daphne, LI-NING, Mizuno, Red Dragonfly, C.banner, Peak, K-Swiss, KAPPA, 361.
3. What are the main segments of the Infant Footwear?
The market segments include Application, Types.
4. Can you provide details about the market size?
The market size is estimated to be USD 10490 million as of 2022.
5. What are some drivers contributing to market growth?
N/A
6. What are the notable trends driving market growth?
N/A
7. Are there any restraints impacting market growth?
N/A
8. Can you provide examples of recent developments in the market?
N/A
9. What pricing options are available for accessing the report?
Pricing options include single-user, multi-user, and enterprise licenses priced at USD 3350.00, USD 5025.00, and USD 6700.00 respectively.
10. Is the market size provided in terms of value or volume?
The market size is provided in terms of value, measured in million and volume, measured in K.
11. Are there any specific market keywords associated with the report?
Yes, the market keyword associated with the report is "Infant Footwear," which aids in identifying and referencing the specific market segment covered.
12. How do I determine which pricing option suits my needs best?
The pricing options vary based on user requirements and access needs. Individual users may opt for single-user licenses, while businesses requiring broader access may choose multi-user or enterprise licenses for cost-effective access to the report.
13. Are there any additional resources or data provided in the Infant Footwear report?
While the report offers comprehensive insights, it's advisable to review the specific contents or supplementary materials provided to ascertain if additional resources or data are available.
14. How can I stay updated on further developments or reports in the Infant Footwear?
To stay informed about further developments, trends, and reports in the Infant Footwear, consider subscribing to industry newsletters, following relevant companies and organizations, or regularly checking reputable industry news sources and publications.
Methodology
Step 1 - Identification of Relevant Samples Size from Population Database


Step 2 - Approaches for Defining Global Market Size (Value, Volume* & Price*)

Note*: In applicable scenarios
Step 3 - Data Sources
Primary Research
- Web Analytics
- Survey Reports
- Research Institute
- Latest Research Reports
- Opinion Leaders
Secondary Research
- Annual Reports
- White Paper
- Latest Press Release
- Industry Association
- Paid Database
- Investor Presentations

Step 4 - Data Triangulation
Involves using different sources of information in order to increase the validity of a study
These sources are likely to be stakeholders in a program - participants, other researchers, program staff, other community members, and so on.
Then we put all data in single framework & apply various statistical tools to find out the dynamic on the market.
During the analysis stage, feedback from the stakeholder groups would be compared to determine areas of agreement as well as areas of divergence
