

Key Insights
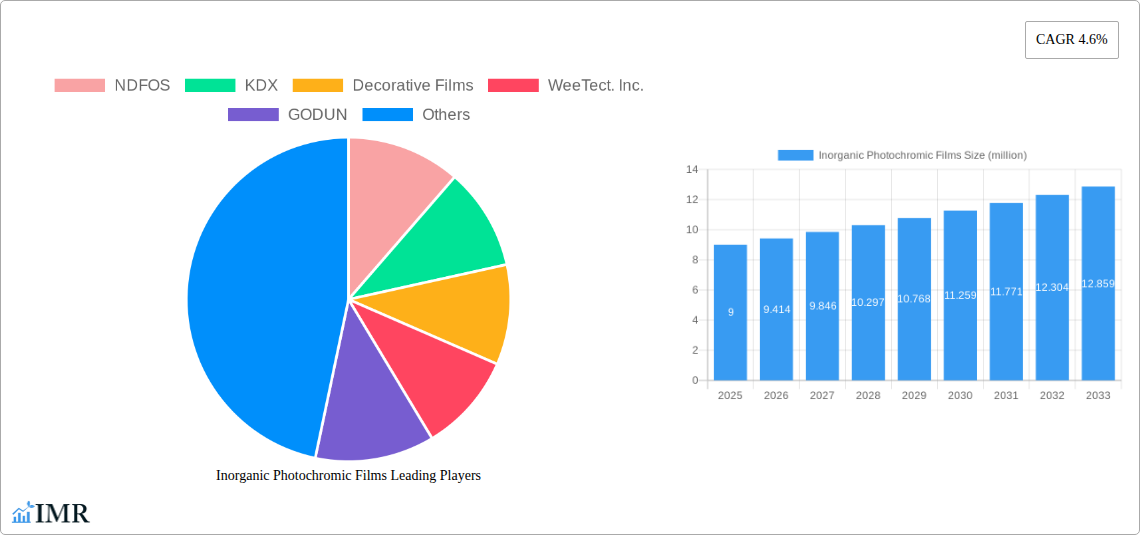
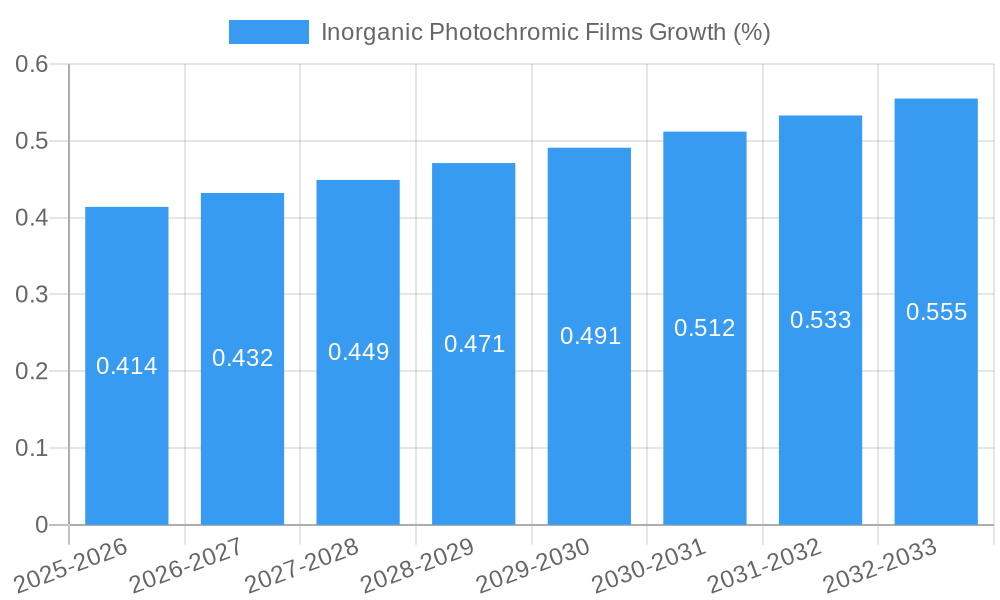
The inorganic photochromic films market, valued at approximately $9 million in 2025, is projected to experience robust growth, exhibiting a compound annual growth rate (CAGR) of 4.6% from 2025 to 2033. This expansion is driven by increasing demand across diverse applications, including architectural glazing, ophthalmic lenses, and automotive sunroofs. The rising adoption of smart windows and energy-efficient building technologies fuels market growth, as inorganic photochromic films offer superior light control and thermal management compared to conventional solutions. Furthermore, advancements in material science are leading to the development of films with enhanced performance characteristics, such as improved coloration efficiency, faster switching speeds, and enhanced durability. Key players like NDFOS, KDX, Decorative Films, WeeTect. Inc., GODUN, and ZEO Films are actively contributing to market expansion through innovations and strategic partnerships. The market is segmented by application (e.g., architectural, automotive, ophthalmic) and geography, with regional variations in adoption rates influenced by factors such as building codes, technological advancements, and consumer preferences.
Despite the positive outlook, market growth faces certain challenges. High manufacturing costs associated with specialized materials and processes can limit widespread adoption, especially in price-sensitive sectors. Moreover, the development of competing technologies, such as electrochromic and thermochromic films, presents a potential threat to market share. However, ongoing research and development efforts focused on cost reduction and performance enhancement are expected to mitigate these restraints. The forecast period of 2025-2033 anticipates a continued rise in market demand, driven by technological innovation and growing awareness of energy-efficient building solutions and enhanced visual comfort. This market presents lucrative opportunities for companies that can successfully address cost concerns while delivering high-performance, durable inorganic photochromic films.
Inorganic Photochromic Films Market Report: 2019-2033
This comprehensive report provides an in-depth analysis of the Inorganic Photochromic Films market, encompassing market dynamics, growth trends, regional dominance, product landscape, key players, and future outlook. The study period covers 2019-2033, with a base year of 2025 and a forecast period of 2025-2033. This report is essential for industry professionals, investors, and strategic decision-makers seeking to understand and capitalize on the opportunities within this dynamic sector. The parent market is smart films and the child market is photochromic films.
Inorganic Photochromic Films Market Dynamics & Structure
The inorganic photochromic films market is characterized by moderate concentration, with key players such as NDFOS, KDX, Decorative Films, WeeTect. Inc., GODUN, and ZEO Films vying for market share. Technological innovation, driven by advancements in material science and nanotechnology, is a significant growth driver. Regulatory frameworks concerning environmental impact and safety standards influence market dynamics. Competitive substitutes, including electrochromic films and liquid crystal films, present challenges. End-user demographics are diverse, encompassing automotive, architectural, and consumer electronics sectors. M&A activity has been relatively low in recent years, with an estimated xx million USD in deal volume during the historical period (2019-2024). This is expected to increase to xx million USD during the forecast period, driven by strategic consolidation and expansion.
- Market Concentration: Moderately concentrated, with top 5 players holding approximately xx% market share in 2025.
- Technological Innovation: Focus on enhancing light transmission, response speed, and durability.
- Regulatory Landscape: Stringent environmental regulations impact material selection and manufacturing processes.
- Competitive Substitutes: Electrochromic and liquid crystal films offer competing functionalities.
- End-User Demographics: Automotive, architectural, and consumer electronics are key segments.
- M&A Activity: Moderate activity observed; strategic acquisitions expected to increase during the forecast period.
Inorganic Photochromic Films Growth Trends & Insights
The inorganic photochromic films market experienced robust growth during the historical period (2019-2024), with a CAGR of xx%. This growth is attributed to increasing demand from the automotive and building & construction industries, driven by the need for energy-efficient and smart buildings and vehicles. The market size in 2025 is estimated at xx million USD, and is projected to reach xx million USD by 2033, exhibiting a CAGR of xx% during the forecast period (2025-2033). The adoption rate is increasing gradually, particularly in developed economies, with technological advancements contributing to improved performance and reduced costs. Consumer behavior shifts toward smart and sustainable products further bolster market growth.
Dominant Regions, Countries, or Segments in Inorganic Photochromic Films
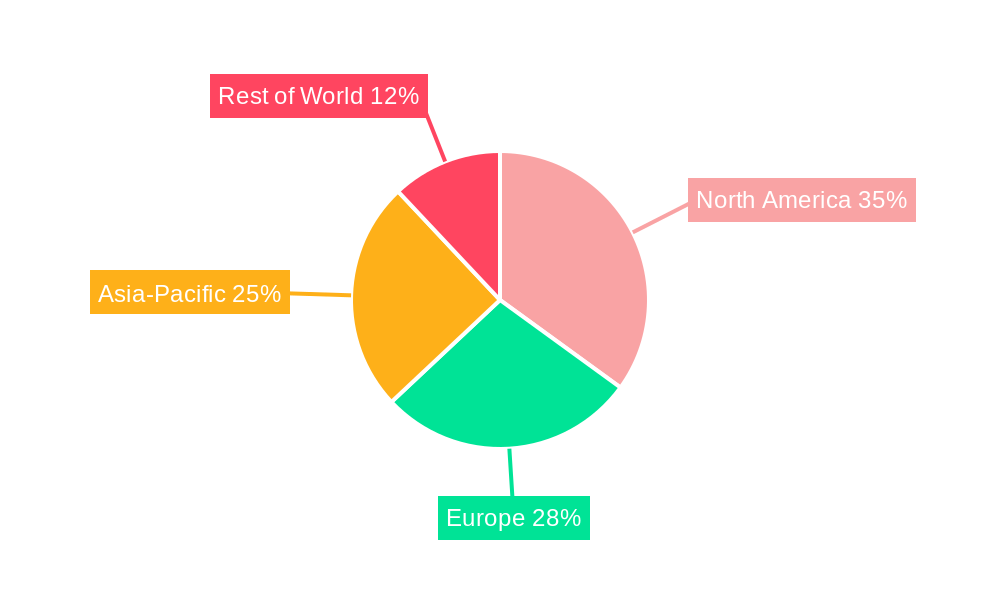
North America currently holds the largest market share, driven by strong demand from the automotive and architectural sectors. The region benefits from well-established infrastructure, supportive government policies, and a high level of technological adoption. Europe and Asia Pacific are also significant markets, with the latter expected to exhibit faster growth rates due to rapid industrialization and urbanization. Within the segments, the automotive segment is currently the largest contributor to revenue, followed by the architectural sector.
- Key Drivers in North America: Strong automotive industry, advanced infrastructure, high technological adoption.
- Key Drivers in Asia Pacific: Rapid urbanization, increasing disposable income, government initiatives for energy efficiency.
- Market Share: North America holds approximately xx% market share in 2025, followed by Europe with xx% and Asia Pacific with xx%.
- Growth Potential: Asia Pacific is expected to witness the highest growth during the forecast period.
Inorganic Photochromic Films Product Landscape
Inorganic photochromic films are offered in various configurations, including laminated films, coated films, and integrated smart glass systems. Product innovations focus on enhancing light transmission control, improving response times, and increasing durability. Key features include adjustable light transmission, UV protection, and energy efficiency. Advancements in nanomaterials and coating technologies are continuously improving performance and expanding application possibilities.
Key Drivers, Barriers & Challenges in Inorganic Photochromic Films
Key Drivers: Increasing demand for energy-efficient buildings and vehicles, technological advancements leading to improved performance and cost reduction, growing consumer preference for smart products.
Key Challenges: High initial investment costs, limited awareness among consumers, potential supply chain disruptions, and stringent regulatory compliance requirements. These factors currently limit wider market penetration, potentially impacting market growth by xx% by 2030.
Emerging Opportunities in Inorganic Photochromic Films
Emerging opportunities lie in expanding into untapped markets, such as the consumer electronics and wearable technology sectors. Innovative applications in smart windows for buildings and vehicles, coupled with evolving consumer preferences for customizable and personalized solutions, open up significant avenues for growth.
Growth Accelerators in the Inorganic Photochromic Films Industry
Technological breakthroughs, including advancements in nanomaterials and coating techniques, are key drivers of long-term growth. Strategic partnerships between material suppliers and end-product manufacturers facilitate market expansion. Moreover, increasing investments in R&D activities fuel innovation and product diversification, fueling market growth.
Key Players Shaping the Inorganic Photochromic Films Market
- NDFOS
- KDX
- Decorative Films
- WeeTect. Inc.
- GODUN
- ZEO Films
Notable Milestones in Inorganic Photochromic Films Sector
- 2021: NDFOS launched a new generation of high-performance inorganic photochromic films with enhanced durability.
- 2022: KDX secured a major contract to supply photochromic films for a large-scale architectural project.
- 2023: WeeTect Inc. developed a new manufacturing process that significantly reduced production costs.
In-Depth Inorganic Photochromic Films Market Outlook
The inorganic photochromic films market is poised for significant growth over the next decade. Continued technological advancements, coupled with rising demand from key sectors and increased consumer awareness, will drive market expansion. Strategic partnerships and investments in R&D will further enhance market dynamics, paving the way for substantial growth opportunities in the coming years.
Inorganic Photochromic Films Segmentation
-
1. Application
- 1.1. Automotive
- 1.2. Architectural
- 1.3. Others
-
2. Types
- 2.1. 2mil
- 2.2. 3mil
- 2.3. Other
Inorganic Photochromic Films Segmentation By Geography
-
1. North America
- 1.1. United States
- 1.2. Canada
- 1.3. Mexico
-
2. South America
- 2.1. Brazil
- 2.2. Argentina
- 2.3. Rest of South America
-
3. Europe
- 3.1. United Kingdom
- 3.2. Germany
- 3.3. France
- 3.4. Italy
- 3.5. Spain
- 3.6. Russia
- 3.7. Benelux
- 3.8. Nordics
- 3.9. Rest of Europe
-
4. Middle East & Africa
- 4.1. Turkey
- 4.2. Israel
- 4.3. GCC
- 4.4. North Africa
- 4.5. South Africa
- 4.6. Rest of Middle East & Africa
-
5. Asia Pacific
- 5.1. China
- 5.2. India
- 5.3. Japan
- 5.4. South Korea
- 5.5. ASEAN
- 5.6. Oceania
- 5.7. Rest of Asia Pacific
Inorganic Photochromic Films REPORT HIGHLIGHTS
| Aspects | Details |
|---|---|
| Study Period | 2019-2033 |
| Base Year | 2024 |
| Estimated Year | 2025 |
| Forecast Period | 2025-2033 |
| Historical Period | 2019-2024 |
| Growth Rate | CAGR of 4.6% from 2019-2033 |
| Segmentation |
|
Table of Contents
- 1. Introduction
- 1.1. Research Scope
- 1.2. Market Segmentation
- 1.3. Research Methodology
- 1.4. Definitions and Assumptions
- 2. Executive Summary
- 2.1. Introduction
- 3. Market Dynamics
- 3.1. Introduction
- 3.2. Market Drivers
- 3.3. Market Restrains
- 3.4. Market Trends
- 4. Market Factor Analysis
- 4.1. Porters Five Forces
- 4.2. Supply/Value Chain
- 4.3. PESTEL analysis
- 4.4. Market Entropy
- 4.5. Patent/Trademark Analysis
- 5. Global Inorganic Photochromic Films Analysis, Insights and Forecast, 2019-2031
- 5.1. Market Analysis, Insights and Forecast - by Application
- 5.1.1. Automotive
- 5.1.2. Architectural
- 5.1.3. Others
- 5.2. Market Analysis, Insights and Forecast - by Types
- 5.2.1. 2mil
- 5.2.2. 3mil
- 5.2.3. Other
- 5.3. Market Analysis, Insights and Forecast - by Region
- 5.3.1. North America
- 5.3.2. South America
- 5.3.3. Europe
- 5.3.4. Middle East & Africa
- 5.3.5. Asia Pacific
- 5.1. Market Analysis, Insights and Forecast - by Application
- 6. North America Inorganic Photochromic Films Analysis, Insights and Forecast, 2019-2031
- 6.1. Market Analysis, Insights and Forecast - by Application
- 6.1.1. Automotive
- 6.1.2. Architectural
- 6.1.3. Others
- 6.2. Market Analysis, Insights and Forecast - by Types
- 6.2.1. 2mil
- 6.2.2. 3mil
- 6.2.3. Other
- 6.1. Market Analysis, Insights and Forecast - by Application
- 7. South America Inorganic Photochromic Films Analysis, Insights and Forecast, 2019-2031
- 7.1. Market Analysis, Insights and Forecast - by Application
- 7.1.1. Automotive
- 7.1.2. Architectural
- 7.1.3. Others
- 7.2. Market Analysis, Insights and Forecast - by Types
- 7.2.1. 2mil
- 7.2.2. 3mil
- 7.2.3. Other
- 7.1. Market Analysis, Insights and Forecast - by Application
- 8. Europe Inorganic Photochromic Films Analysis, Insights and Forecast, 2019-2031
- 8.1. Market Analysis, Insights and Forecast - by Application
- 8.1.1. Automotive
- 8.1.2. Architectural
- 8.1.3. Others
- 8.2. Market Analysis, Insights and Forecast - by Types
- 8.2.1. 2mil
- 8.2.2. 3mil
- 8.2.3. Other
- 8.1. Market Analysis, Insights and Forecast - by Application
- 9. Middle East & Africa Inorganic Photochromic Films Analysis, Insights and Forecast, 2019-2031
- 9.1. Market Analysis, Insights and Forecast - by Application
- 9.1.1. Automotive
- 9.1.2. Architectural
- 9.1.3. Others
- 9.2. Market Analysis, Insights and Forecast - by Types
- 9.2.1. 2mil
- 9.2.2. 3mil
- 9.2.3. Other
- 9.1. Market Analysis, Insights and Forecast - by Application
- 10. Asia Pacific Inorganic Photochromic Films Analysis, Insights and Forecast, 2019-2031
- 10.1. Market Analysis, Insights and Forecast - by Application
- 10.1.1. Automotive
- 10.1.2. Architectural
- 10.1.3. Others
- 10.2. Market Analysis, Insights and Forecast - by Types
- 10.2.1. 2mil
- 10.2.2. 3mil
- 10.2.3. Other
- 10.1. Market Analysis, Insights and Forecast - by Application
- 11. Competitive Analysis
- 11.1. Global Market Share Analysis 2024
- 11.2. Company Profiles
- 11.2.1 NDFOS
- 11.2.1.1. Overview
- 11.2.1.2. Products
- 11.2.1.3. SWOT Analysis
- 11.2.1.4. Recent Developments
- 11.2.1.5. Financials (Based on Availability)
- 11.2.2 KDX
- 11.2.2.1. Overview
- 11.2.2.2. Products
- 11.2.2.3. SWOT Analysis
- 11.2.2.4. Recent Developments
- 11.2.2.5. Financials (Based on Availability)
- 11.2.3 Decorative Films
- 11.2.3.1. Overview
- 11.2.3.2. Products
- 11.2.3.3. SWOT Analysis
- 11.2.3.4. Recent Developments
- 11.2.3.5. Financials (Based on Availability)
- 11.2.4 WeeTect. Inc.
- 11.2.4.1. Overview
- 11.2.4.2. Products
- 11.2.4.3. SWOT Analysis
- 11.2.4.4. Recent Developments
- 11.2.4.5. Financials (Based on Availability)
- 11.2.5 GODUN
- 11.2.5.1. Overview
- 11.2.5.2. Products
- 11.2.5.3. SWOT Analysis
- 11.2.5.4. Recent Developments
- 11.2.5.5. Financials (Based on Availability)
- 11.2.6 ZEO Films
- 11.2.6.1. Overview
- 11.2.6.2. Products
- 11.2.6.3. SWOT Analysis
- 11.2.6.4. Recent Developments
- 11.2.6.5. Financials (Based on Availability)
- 11.2.1 NDFOS
List of Figures
- Figure 1: Global Inorganic Photochromic Films Revenue Breakdown (million, %) by Region 2024 & 2032
- Figure 2: North America Inorganic Photochromic Films Revenue (million), by Application 2024 & 2032
- Figure 3: North America Inorganic Photochromic Films Revenue Share (%), by Application 2024 & 2032
- Figure 4: North America Inorganic Photochromic Films Revenue (million), by Types 2024 & 2032
- Figure 5: North America Inorganic Photochromic Films Revenue Share (%), by Types 2024 & 2032
- Figure 6: North America Inorganic Photochromic Films Revenue (million), by Country 2024 & 2032
- Figure 7: North America Inorganic Photochromic Films Revenue Share (%), by Country 2024 & 2032
- Figure 8: South America Inorganic Photochromic Films Revenue (million), by Application 2024 & 2032
- Figure 9: South America Inorganic Photochromic Films Revenue Share (%), by Application 2024 & 2032
- Figure 10: South America Inorganic Photochromic Films Revenue (million), by Types 2024 & 2032
- Figure 11: South America Inorganic Photochromic Films Revenue Share (%), by Types 2024 & 2032
- Figure 12: South America Inorganic Photochromic Films Revenue (million), by Country 2024 & 2032
- Figure 13: South America Inorganic Photochromic Films Revenue Share (%), by Country 2024 & 2032
- Figure 14: Europe Inorganic Photochromic Films Revenue (million), by Application 2024 & 2032
- Figure 15: Europe Inorganic Photochromic Films Revenue Share (%), by Application 2024 & 2032
- Figure 16: Europe Inorganic Photochromic Films Revenue (million), by Types 2024 & 2032
- Figure 17: Europe Inorganic Photochromic Films Revenue Share (%), by Types 2024 & 2032
- Figure 18: Europe Inorganic Photochromic Films Revenue (million), by Country 2024 & 2032
- Figure 19: Europe Inorganic Photochromic Films Revenue Share (%), by Country 2024 & 2032
- Figure 20: Middle East & Africa Inorganic Photochromic Films Revenue (million), by Application 2024 & 2032
- Figure 21: Middle East & Africa Inorganic Photochromic Films Revenue Share (%), by Application 2024 & 2032
- Figure 22: Middle East & Africa Inorganic Photochromic Films Revenue (million), by Types 2024 & 2032
- Figure 23: Middle East & Africa Inorganic Photochromic Films Revenue Share (%), by Types 2024 & 2032
- Figure 24: Middle East & Africa Inorganic Photochromic Films Revenue (million), by Country 2024 & 2032
- Figure 25: Middle East & Africa Inorganic Photochromic Films Revenue Share (%), by Country 2024 & 2032
- Figure 26: Asia Pacific Inorganic Photochromic Films Revenue (million), by Application 2024 & 2032
- Figure 27: Asia Pacific Inorganic Photochromic Films Revenue Share (%), by Application 2024 & 2032
- Figure 28: Asia Pacific Inorganic Photochromic Films Revenue (million), by Types 2024 & 2032
- Figure 29: Asia Pacific Inorganic Photochromic Films Revenue Share (%), by Types 2024 & 2032
- Figure 30: Asia Pacific Inorganic Photochromic Films Revenue (million), by Country 2024 & 2032
- Figure 31: Asia Pacific Inorganic Photochromic Films Revenue Share (%), by Country 2024 & 2032
List of Tables
- Table 1: Global Inorganic Photochromic Films Revenue million Forecast, by Region 2019 & 2032
- Table 2: Global Inorganic Photochromic Films Revenue million Forecast, by Application 2019 & 2032
- Table 3: Global Inorganic Photochromic Films Revenue million Forecast, by Types 2019 & 2032
- Table 4: Global Inorganic Photochromic Films Revenue million Forecast, by Region 2019 & 2032
- Table 5: Global Inorganic Photochromic Films Revenue million Forecast, by Application 2019 & 2032
- Table 6: Global Inorganic Photochromic Films Revenue million Forecast, by Types 2019 & 2032
- Table 7: Global Inorganic Photochromic Films Revenue million Forecast, by Country 2019 & 2032
- Table 8: United States Inorganic Photochromic Films Revenue (million) Forecast, by Application 2019 & 2032
- Table 9: Canada Inorganic Photochromic Films Revenue (million) Forecast, by Application 2019 & 2032
- Table 10: Mexico Inorganic Photochromic Films Revenue (million) Forecast, by Application 2019 & 2032
- Table 11: Global Inorganic Photochromic Films Revenue million Forecast, by Application 2019 & 2032
- Table 12: Global Inorganic Photochromic Films Revenue million Forecast, by Types 2019 & 2032
- Table 13: Global Inorganic Photochromic Films Revenue million Forecast, by Country 2019 & 2032
- Table 14: Brazil Inorganic Photochromic Films Revenue (million) Forecast, by Application 2019 & 2032
- Table 15: Argentina Inorganic Photochromic Films Revenue (million) Forecast, by Application 2019 & 2032
- Table 16: Rest of South America Inorganic Photochromic Films Revenue (million) Forecast, by Application 2019 & 2032
- Table 17: Global Inorganic Photochromic Films Revenue million Forecast, by Application 2019 & 2032
- Table 18: Global Inorganic Photochromic Films Revenue million Forecast, by Types 2019 & 2032
- Table 19: Global Inorganic Photochromic Films Revenue million Forecast, by Country 2019 & 2032
- Table 20: United Kingdom Inorganic Photochromic Films Revenue (million) Forecast, by Application 2019 & 2032
- Table 21: Germany Inorganic Photochromic Films Revenue (million) Forecast, by Application 2019 & 2032
- Table 22: France Inorganic Photochromic Films Revenue (million) Forecast, by Application 2019 & 2032
- Table 23: Italy Inorganic Photochromic Films Revenue (million) Forecast, by Application 2019 & 2032
- Table 24: Spain Inorganic Photochromic Films Revenue (million) Forecast, by Application 2019 & 2032
- Table 25: Russia Inorganic Photochromic Films Revenue (million) Forecast, by Application 2019 & 2032
- Table 26: Benelux Inorganic Photochromic Films Revenue (million) Forecast, by Application 2019 & 2032
- Table 27: Nordics Inorganic Photochromic Films Revenue (million) Forecast, by Application 2019 & 2032
- Table 28: Rest of Europe Inorganic Photochromic Films Revenue (million) Forecast, by Application 2019 & 2032
- Table 29: Global Inorganic Photochromic Films Revenue million Forecast, by Application 2019 & 2032
- Table 30: Global Inorganic Photochromic Films Revenue million Forecast, by Types 2019 & 2032
- Table 31: Global Inorganic Photochromic Films Revenue million Forecast, by Country 2019 & 2032
- Table 32: Turkey Inorganic Photochromic Films Revenue (million) Forecast, by Application 2019 & 2032
- Table 33: Israel Inorganic Photochromic Films Revenue (million) Forecast, by Application 2019 & 2032
- Table 34: GCC Inorganic Photochromic Films Revenue (million) Forecast, by Application 2019 & 2032
- Table 35: North Africa Inorganic Photochromic Films Revenue (million) Forecast, by Application 2019 & 2032
- Table 36: South Africa Inorganic Photochromic Films Revenue (million) Forecast, by Application 2019 & 2032
- Table 37: Rest of Middle East & Africa Inorganic Photochromic Films Revenue (million) Forecast, by Application 2019 & 2032
- Table 38: Global Inorganic Photochromic Films Revenue million Forecast, by Application 2019 & 2032
- Table 39: Global Inorganic Photochromic Films Revenue million Forecast, by Types 2019 & 2032
- Table 40: Global Inorganic Photochromic Films Revenue million Forecast, by Country 2019 & 2032
- Table 41: China Inorganic Photochromic Films Revenue (million) Forecast, by Application 2019 & 2032
- Table 42: India Inorganic Photochromic Films Revenue (million) Forecast, by Application 2019 & 2032
- Table 43: Japan Inorganic Photochromic Films Revenue (million) Forecast, by Application 2019 & 2032
- Table 44: South Korea Inorganic Photochromic Films Revenue (million) Forecast, by Application 2019 & 2032
- Table 45: ASEAN Inorganic Photochromic Films Revenue (million) Forecast, by Application 2019 & 2032
- Table 46: Oceania Inorganic Photochromic Films Revenue (million) Forecast, by Application 2019 & 2032
- Table 47: Rest of Asia Pacific Inorganic Photochromic Films Revenue (million) Forecast, by Application 2019 & 2032
Frequently Asked Questions
1. What is the projected Compound Annual Growth Rate (CAGR) of the Inorganic Photochromic Films?
The projected CAGR is approximately 4.6%.
2. Which companies are prominent players in the Inorganic Photochromic Films?
Key companies in the market include NDFOS, KDX, Decorative Films, WeeTect. Inc., GODUN, ZEO Films.
3. What are the main segments of the Inorganic Photochromic Films?
The market segments include Application, Types.
4. Can you provide details about the market size?
The market size is estimated to be USD 9 million as of 2022.
5. What are some drivers contributing to market growth?
N/A
6. What are the notable trends driving market growth?
N/A
7. Are there any restraints impacting market growth?
N/A
8. Can you provide examples of recent developments in the market?
N/A
9. What pricing options are available for accessing the report?
Pricing options include single-user, multi-user, and enterprise licenses priced at USD 4900.00, USD 7350.00, and USD 9800.00 respectively.
10. Is the market size provided in terms of value or volume?
The market size is provided in terms of value, measured in million.
11. Are there any specific market keywords associated with the report?
Yes, the market keyword associated with the report is "Inorganic Photochromic Films," which aids in identifying and referencing the specific market segment covered.
12. How do I determine which pricing option suits my needs best?
The pricing options vary based on user requirements and access needs. Individual users may opt for single-user licenses, while businesses requiring broader access may choose multi-user or enterprise licenses for cost-effective access to the report.
13. Are there any additional resources or data provided in the Inorganic Photochromic Films report?
While the report offers comprehensive insights, it's advisable to review the specific contents or supplementary materials provided to ascertain if additional resources or data are available.
14. How can I stay updated on further developments or reports in the Inorganic Photochromic Films?
To stay informed about further developments, trends, and reports in the Inorganic Photochromic Films, consider subscribing to industry newsletters, following relevant companies and organizations, or regularly checking reputable industry news sources and publications.
Methodology
Step 1 - Identification of Relevant Samples Size from Population Database


Step 2 - Approaches for Defining Global Market Size (Value, Volume* & Price*)

Note*: In applicable scenarios
Step 3 - Data Sources
Primary Research
- Web Analytics
- Survey Reports
- Research Institute
- Latest Research Reports
- Opinion Leaders
Secondary Research
- Annual Reports
- White Paper
- Latest Press Release
- Industry Association
- Paid Database
- Investor Presentations

Step 4 - Data Triangulation
Involves using different sources of information in order to increase the validity of a study
These sources are likely to be stakeholders in a program - participants, other researchers, program staff, other community members, and so on.
Then we put all data in single framework & apply various statistical tools to find out the dynamic on the market.
During the analysis stage, feedback from the stakeholder groups would be compared to determine areas of agreement as well as areas of divergence
