

Key Insights
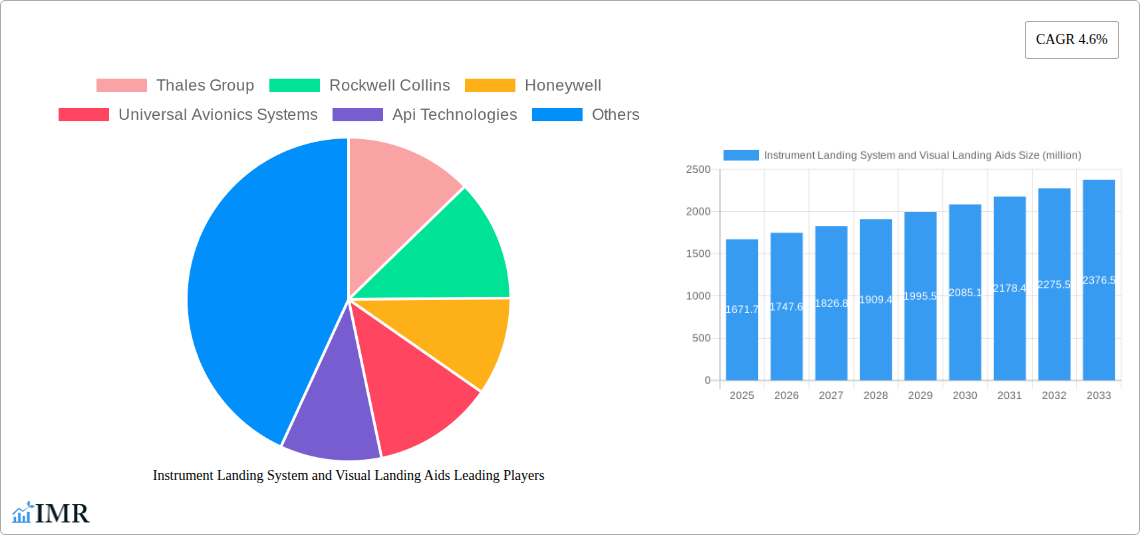
The Instrument Landing System (ILS) and Visual Landing Aids (VLA) market, valued at $1671.7 million in 2025, is projected to experience steady growth, driven by increasing air traffic, stringent safety regulations, and technological advancements. The Compound Annual Growth Rate (CAGR) of 4.6% from 2025 to 2033 indicates a robust market expansion, fueled by the continuous demand for improved landing precision and enhanced safety measures, especially at challenging airports with limited visibility. This growth is further supported by the rising adoption of advanced technologies such as GPS-based augmentation systems and improved VLA systems, offering better situational awareness to pilots. Key market players, including Thales Group, Rockwell Collins, and Honeywell, are actively contributing to innovation and market expansion through the development and deployment of next-generation landing systems and related services. The market is segmented by system type (ILS, VLA, and integrated systems), technology, application (civil and military), and region. While precise regional breakdowns are unavailable, a likely distribution sees North America and Europe holding significant market shares due to their established aviation infrastructure and strong regulatory frameworks.
The market's growth, however, is not without its challenges. High initial investment costs associated with ILS and VLA infrastructure development and upgrades can restrain growth, particularly in developing economies. Furthermore, the integration of new technologies into existing systems requires significant investment in training and maintenance. Competitive pressures from new entrants offering innovative solutions are also shaping the market landscape. Despite these restraints, the long-term outlook for the ILS and VLA market remains positive, driven by the ever-increasing need for safer and more efficient air travel, making it an attractive segment for technology providers and infrastructure developers alike. Continuous regulatory updates emphasizing safety standards will undoubtedly further stimulate market growth in the coming years.
Instrument Landing System and Visual Landing Aids Market Report: 2019-2033
This comprehensive report provides an in-depth analysis of the Instrument Landing System (ILS) and Visual Landing Aids market, encompassing market dynamics, growth trends, regional insights, product landscape, and key player strategies. The study period covers 2019-2033, with a base year of 2025 and a forecast period of 2025-2033. The report is crucial for industry professionals, investors, and stakeholders seeking a clear understanding of this vital sector of the aviation industry. The parent market is aviation technology, and the child market is airport infrastructure and navigation. The market size in 2025 is estimated at $XX million.
Instrument Landing System and Visual Landing Aids Market Dynamics & Structure
This section analyzes the competitive landscape, technological advancements, regulatory influences, and market trends within the ILS and Visual Landing Aids market. The global market is moderately concentrated, with key players such as Thales Group, Rockwell Collins, and Honeywell holding significant market share. The market is characterized by continuous technological innovation, driven by the need for enhanced safety, precision, and efficiency in aircraft landings.
- Market Concentration: Moderate, with top 5 players holding approximately 60% market share in 2025.
- Technological Innovation: Focus on R&D for improved GPS integration, enhanced precision approaches, and the adoption of more robust and reliable systems.
- Regulatory Frameworks: Stringent safety regulations and certifications from bodies like ICAO and FAA significantly influence market dynamics.
- Competitive Product Substitutes: The rise of satellite-based augmentation systems (SBAS) presents some level of competition, but ILS remains crucial for all-weather operations.
- End-User Demographics: Primarily airports (large and small), airlines, and air navigation service providers (ANSPs).
- M&A Trends: Moderate M&A activity observed in the historical period (2019-2024), with approximately xx deals, driven by consolidation and technological expansion strategies.
Instrument Landing System and Visual Landing Aids Growth Trends & Insights
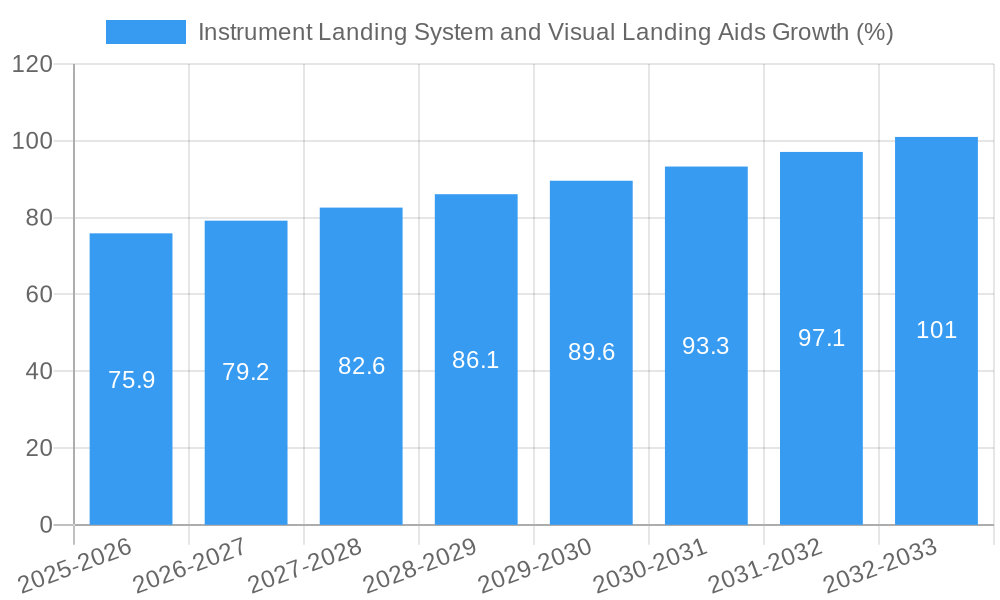
The ILS and Visual Landing Aids market witnessed significant growth during the historical period (2019-2024). The market is expected to continue its growth trajectory throughout the forecast period (2025-2033), driven by increasing air traffic, stringent safety regulations, and advancements in technology. The Compound Annual Growth Rate (CAGR) is projected to be xx% during the forecast period. Increased adoption of precision approaches, particularly in emerging economies, contributes significantly to market growth. The rising demand for enhanced safety features and the growing number of airports globally further fuels market expansion. Technological disruptions such as the integration of advanced sensors and artificial intelligence are expected to enhance the efficiency and capabilities of these systems. Shifts in consumer behavior, such as a preference for more precise and reliable landing systems, further accelerate market growth.
Dominant Regions, Countries, or Segments in Instrument Landing System and Visual Landing Aids
North America and Europe currently dominate the market, holding a combined market share of approximately 70% in 2025. This dominance is attributed to advanced infrastructure, stringent safety regulations, and high adoption rates of advanced technologies. However, the Asia-Pacific region exhibits significant growth potential driven by rapid infrastructure development and increasing air traffic.
- North America: High adoption rates, stringent safety regulations, and substantial investments in airport infrastructure.
- Europe: Established market with high technological advancements and a mature aviation industry.
- Asia-Pacific: Rapid economic growth, increasing air traffic, and substantial investments in airport modernization drive market expansion.
- Rest of the World: Moderate growth potential driven by improving airport infrastructure and rising demand for safer air travel.
Instrument Landing System and Visual Landing Aids Product Landscape
The market offers a wide range of ILS and Visual Landing Aids, including precision approach path indicators (PAPI), runway centerline lights (RCL), and various ILS configurations. Recent innovations focus on improved accuracy, reliability, and integration with other navigation systems. This includes the integration of GPS technology to enhance precision and the development of systems capable of operating in challenging weather conditions. Unique selling propositions center around ease of installation, maintenance, and cost-effectiveness alongside enhanced safety and reliability.
Key Drivers, Barriers & Challenges in Instrument Landing System and Visual Landing Aids
Key Drivers:
- Increasing air traffic globally.
- Stringent safety regulations mandating advanced landing systems.
- Technological advancements leading to improved accuracy and reliability.
- Investments in airport infrastructure development.
Challenges & Restraints:
- High initial investment costs for implementation and upgrade of systems.
- Dependence on stable power supply for optimal performance.
- Potential for interference from other electronic signals.
- The need for skilled personnel for installation and maintenance. This could lead to a xx% increase in maintenance costs by 2033.
Emerging Opportunities in Instrument Landing System and Visual Landing Aids
- Integration of ILS and Visual Landing Aids with other navigational aids.
- Development of more robust and reliable systems for operation in challenging weather conditions.
- Expansion into emerging markets with growing air travel demand.
- Development of cost-effective solutions for smaller airports.
Growth Accelerators in the Instrument Landing System and Visual Landing Aids Industry
Long-term growth will be fueled by continued technological innovation, strategic partnerships between manufacturers and airport operators, and the expansion into underserved markets. The integration of advanced technologies such as AI and machine learning promises to enhance system performance and optimize operational efficiency. Government initiatives promoting the modernization of airport infrastructure will also play a crucial role in driving market expansion.
Key Players Shaping the Instrument Landing System and Visual Landing Aids Market
- Thales Group
- Rockwell Collins (now part of Collins Aerospace)
- Honeywell
- Universal Avionics Systems
- Api Technologies
- Calzoni
- Adb Airfield Solutions
- Multi Electric Manufacturing
- Airport Lighting Specialists
- Airport Lighting Company
- Atg Airports
- Astronics Corporation
- Liberty Airport Systems
- Saab Sensis Corporation
- Advanced Navigation & Positioning
- Systems Interface
Notable Milestones in Instrument Landing System and Visual Landing Aids Sector
- 2020: Introduction of a new generation of ILS system by Thales Group, featuring improved GPS integration.
- 2021: Honeywell announces a strategic partnership with an airport operator in Asia to implement a new visual landing aid system.
- 2022: Merger between two smaller companies specializing in airport lighting systems.
- 2023: Several major airports in Europe upgrade their ILS systems to improve safety and efficiency.
In-Depth Instrument Landing System and Visual Landing Aids Market Outlook
The ILS and Visual Landing Aids market is poised for significant growth over the next decade, driven by technological advancements and increasing air traffic. Strategic opportunities exist for companies focused on innovation, partnerships, and expansion into emerging markets. The integration of advanced technologies and a focus on cost-effectiveness will be key to success in this dynamic market. The market is projected to reach $XX million by 2033.
Instrument Landing System and Visual Landing Aids Segmentation
-
1. Application
- 1.1. International Airport
- 1.2. Medium Airport
- 1.3. Small Airport
-
2. Types
- 2.1. Instrument Landing System
- 2.2. Visual Landing Aids
Instrument Landing System and Visual Landing Aids Segmentation By Geography
-
1. North America
- 1.1. United States
- 1.2. Canada
- 1.3. Mexico
-
2. South America
- 2.1. Brazil
- 2.2. Argentina
- 2.3. Rest of South America
-
3. Europe
- 3.1. United Kingdom
- 3.2. Germany
- 3.3. France
- 3.4. Italy
- 3.5. Spain
- 3.6. Russia
- 3.7. Benelux
- 3.8. Nordics
- 3.9. Rest of Europe
-
4. Middle East & Africa
- 4.1. Turkey
- 4.2. Israel
- 4.3. GCC
- 4.4. North Africa
- 4.5. South Africa
- 4.6. Rest of Middle East & Africa
-
5. Asia Pacific
- 5.1. China
- 5.2. India
- 5.3. Japan
- 5.4. South Korea
- 5.5. ASEAN
- 5.6. Oceania
- 5.7. Rest of Asia Pacific

Instrument Landing System and Visual Landing Aids REPORT HIGHLIGHTS
| Aspects | Details |
|---|---|
| Study Period | 2019-2033 |
| Base Year | 2024 |
| Estimated Year | 2025 |
| Forecast Period | 2025-2033 |
| Historical Period | 2019-2024 |
| Growth Rate | CAGR of 4.6% from 2019-2033 |
| Segmentation |
|
Table of Contents
- 1. Introduction
- 1.1. Research Scope
- 1.2. Market Segmentation
- 1.3. Research Methodology
- 1.4. Definitions and Assumptions
- 2. Executive Summary
- 2.1. Introduction
- 3. Market Dynamics
- 3.1. Introduction
- 3.2. Market Drivers
- 3.3. Market Restrains
- 3.4. Market Trends
- 4. Market Factor Analysis
- 4.1. Porters Five Forces
- 4.2. Supply/Value Chain
- 4.3. PESTEL analysis
- 4.4. Market Entropy
- 4.5. Patent/Trademark Analysis
- 5. Global Instrument Landing System and Visual Landing Aids Analysis, Insights and Forecast, 2019-2031
- 5.1. Market Analysis, Insights and Forecast - by Application
- 5.1.1. International Airport
- 5.1.2. Medium Airport
- 5.1.3. Small Airport
- 5.2. Market Analysis, Insights and Forecast - by Types
- 5.2.1. Instrument Landing System
- 5.2.2. Visual Landing Aids
- 5.3. Market Analysis, Insights and Forecast - by Region
- 5.3.1. North America
- 5.3.2. South America
- 5.3.3. Europe
- 5.3.4. Middle East & Africa
- 5.3.5. Asia Pacific
- 5.1. Market Analysis, Insights and Forecast - by Application
- 6. North America Instrument Landing System and Visual Landing Aids Analysis, Insights and Forecast, 2019-2031
- 6.1. Market Analysis, Insights and Forecast - by Application
- 6.1.1. International Airport
- 6.1.2. Medium Airport
- 6.1.3. Small Airport
- 6.2. Market Analysis, Insights and Forecast - by Types
- 6.2.1. Instrument Landing System
- 6.2.2. Visual Landing Aids
- 6.1. Market Analysis, Insights and Forecast - by Application
- 7. South America Instrument Landing System and Visual Landing Aids Analysis, Insights and Forecast, 2019-2031
- 7.1. Market Analysis, Insights and Forecast - by Application
- 7.1.1. International Airport
- 7.1.2. Medium Airport
- 7.1.3. Small Airport
- 7.2. Market Analysis, Insights and Forecast - by Types
- 7.2.1. Instrument Landing System
- 7.2.2. Visual Landing Aids
- 7.1. Market Analysis, Insights and Forecast - by Application
- 8. Europe Instrument Landing System and Visual Landing Aids Analysis, Insights and Forecast, 2019-2031
- 8.1. Market Analysis, Insights and Forecast - by Application
- 8.1.1. International Airport
- 8.1.2. Medium Airport
- 8.1.3. Small Airport
- 8.2. Market Analysis, Insights and Forecast - by Types
- 8.2.1. Instrument Landing System
- 8.2.2. Visual Landing Aids
- 8.1. Market Analysis, Insights and Forecast - by Application
- 9. Middle East & Africa Instrument Landing System and Visual Landing Aids Analysis, Insights and Forecast, 2019-2031
- 9.1. Market Analysis, Insights and Forecast - by Application
- 9.1.1. International Airport
- 9.1.2. Medium Airport
- 9.1.3. Small Airport
- 9.2. Market Analysis, Insights and Forecast - by Types
- 9.2.1. Instrument Landing System
- 9.2.2. Visual Landing Aids
- 9.1. Market Analysis, Insights and Forecast - by Application
- 10. Asia Pacific Instrument Landing System and Visual Landing Aids Analysis, Insights and Forecast, 2019-2031
- 10.1. Market Analysis, Insights and Forecast - by Application
- 10.1.1. International Airport
- 10.1.2. Medium Airport
- 10.1.3. Small Airport
- 10.2. Market Analysis, Insights and Forecast - by Types
- 10.2.1. Instrument Landing System
- 10.2.2. Visual Landing Aids
- 10.1. Market Analysis, Insights and Forecast - by Application
- 11. Competitive Analysis
- 11.1. Global Market Share Analysis 2024
- 11.2. Company Profiles
- 11.2.1 Thales Group
- 11.2.1.1. Overview
- 11.2.1.2. Products
- 11.2.1.3. SWOT Analysis
- 11.2.1.4. Recent Developments
- 11.2.1.5. Financials (Based on Availability)
- 11.2.2 Rockwell Collins
- 11.2.2.1. Overview
- 11.2.2.2. Products
- 11.2.2.3. SWOT Analysis
- 11.2.2.4. Recent Developments
- 11.2.2.5. Financials (Based on Availability)
- 11.2.3 Honeywell
- 11.2.3.1. Overview
- 11.2.3.2. Products
- 11.2.3.3. SWOT Analysis
- 11.2.3.4. Recent Developments
- 11.2.3.5. Financials (Based on Availability)
- 11.2.4 Universal Avionics Systems
- 11.2.4.1. Overview
- 11.2.4.2. Products
- 11.2.4.3. SWOT Analysis
- 11.2.4.4. Recent Developments
- 11.2.4.5. Financials (Based on Availability)
- 11.2.5 Api Technologies
- 11.2.5.1. Overview
- 11.2.5.2. Products
- 11.2.5.3. SWOT Analysis
- 11.2.5.4. Recent Developments
- 11.2.5.5. Financials (Based on Availability)
- 11.2.6 Calzoni
- 11.2.6.1. Overview
- 11.2.6.2. Products
- 11.2.6.3. SWOT Analysis
- 11.2.6.4. Recent Developments
- 11.2.6.5. Financials (Based on Availability)
- 11.2.7 Adb Airfield Solutions
- 11.2.7.1. Overview
- 11.2.7.2. Products
- 11.2.7.3. SWOT Analysis
- 11.2.7.4. Recent Developments
- 11.2.7.5. Financials (Based on Availability)
- 11.2.8 Multi Electric Manufacturing
- 11.2.8.1. Overview
- 11.2.8.2. Products
- 11.2.8.3. SWOT Analysis
- 11.2.8.4. Recent Developments
- 11.2.8.5. Financials (Based on Availability)
- 11.2.9 Airport Lighting Specialists
- 11.2.9.1. Overview
- 11.2.9.2. Products
- 11.2.9.3. SWOT Analysis
- 11.2.9.4. Recent Developments
- 11.2.9.5. Financials (Based on Availability)
- 11.2.10 Airport Lighting Company
- 11.2.10.1. Overview
- 11.2.10.2. Products
- 11.2.10.3. SWOT Analysis
- 11.2.10.4. Recent Developments
- 11.2.10.5. Financials (Based on Availability)
- 11.2.11 Atg Airports
- 11.2.11.1. Overview
- 11.2.11.2. Products
- 11.2.11.3. SWOT Analysis
- 11.2.11.4. Recent Developments
- 11.2.11.5. Financials (Based on Availability)
- 11.2.12 Astronics Corporation
- 11.2.12.1. Overview
- 11.2.12.2. Products
- 11.2.12.3. SWOT Analysis
- 11.2.12.4. Recent Developments
- 11.2.12.5. Financials (Based on Availability)
- 11.2.13 Liberty Airport Systems
- 11.2.13.1. Overview
- 11.2.13.2. Products
- 11.2.13.3. SWOT Analysis
- 11.2.13.4. Recent Developments
- 11.2.13.5. Financials (Based on Availability)
- 11.2.14 Saab Sensis Corporation
- 11.2.14.1. Overview
- 11.2.14.2. Products
- 11.2.14.3. SWOT Analysis
- 11.2.14.4. Recent Developments
- 11.2.14.5. Financials (Based on Availability)
- 11.2.15 Advanced Navigation & Positioning
- 11.2.15.1. Overview
- 11.2.15.2. Products
- 11.2.15.3. SWOT Analysis
- 11.2.15.4. Recent Developments
- 11.2.15.5. Financials (Based on Availability)
- 11.2.16 Systems Interface
- 11.2.16.1. Overview
- 11.2.16.2. Products
- 11.2.16.3. SWOT Analysis
- 11.2.16.4. Recent Developments
- 11.2.16.5. Financials (Based on Availability)
- 11.2.1 Thales Group
List of Figures
- Figure 1: Global Instrument Landing System and Visual Landing Aids Revenue Breakdown (million, %) by Region 2024 & 2032
- Figure 2: North America Instrument Landing System and Visual Landing Aids Revenue (million), by Application 2024 & 2032
- Figure 3: North America Instrument Landing System and Visual Landing Aids Revenue Share (%), by Application 2024 & 2032
- Figure 4: North America Instrument Landing System and Visual Landing Aids Revenue (million), by Types 2024 & 2032
- Figure 5: North America Instrument Landing System and Visual Landing Aids Revenue Share (%), by Types 2024 & 2032
- Figure 6: North America Instrument Landing System and Visual Landing Aids Revenue (million), by Country 2024 & 2032
- Figure 7: North America Instrument Landing System and Visual Landing Aids Revenue Share (%), by Country 2024 & 2032
- Figure 8: South America Instrument Landing System and Visual Landing Aids Revenue (million), by Application 2024 & 2032
- Figure 9: South America Instrument Landing System and Visual Landing Aids Revenue Share (%), by Application 2024 & 2032
- Figure 10: South America Instrument Landing System and Visual Landing Aids Revenue (million), by Types 2024 & 2032
- Figure 11: South America Instrument Landing System and Visual Landing Aids Revenue Share (%), by Types 2024 & 2032
- Figure 12: South America Instrument Landing System and Visual Landing Aids Revenue (million), by Country 2024 & 2032
- Figure 13: South America Instrument Landing System and Visual Landing Aids Revenue Share (%), by Country 2024 & 2032
- Figure 14: Europe Instrument Landing System and Visual Landing Aids Revenue (million), by Application 2024 & 2032
- Figure 15: Europe Instrument Landing System and Visual Landing Aids Revenue Share (%), by Application 2024 & 2032
- Figure 16: Europe Instrument Landing System and Visual Landing Aids Revenue (million), by Types 2024 & 2032
- Figure 17: Europe Instrument Landing System and Visual Landing Aids Revenue Share (%), by Types 2024 & 2032
- Figure 18: Europe Instrument Landing System and Visual Landing Aids Revenue (million), by Country 2024 & 2032
- Figure 19: Europe Instrument Landing System and Visual Landing Aids Revenue Share (%), by Country 2024 & 2032
- Figure 20: Middle East & Africa Instrument Landing System and Visual Landing Aids Revenue (million), by Application 2024 & 2032
- Figure 21: Middle East & Africa Instrument Landing System and Visual Landing Aids Revenue Share (%), by Application 2024 & 2032
- Figure 22: Middle East & Africa Instrument Landing System and Visual Landing Aids Revenue (million), by Types 2024 & 2032
- Figure 23: Middle East & Africa Instrument Landing System and Visual Landing Aids Revenue Share (%), by Types 2024 & 2032
- Figure 24: Middle East & Africa Instrument Landing System and Visual Landing Aids Revenue (million), by Country 2024 & 2032
- Figure 25: Middle East & Africa Instrument Landing System and Visual Landing Aids Revenue Share (%), by Country 2024 & 2032
- Figure 26: Asia Pacific Instrument Landing System and Visual Landing Aids Revenue (million), by Application 2024 & 2032
- Figure 27: Asia Pacific Instrument Landing System and Visual Landing Aids Revenue Share (%), by Application 2024 & 2032
- Figure 28: Asia Pacific Instrument Landing System and Visual Landing Aids Revenue (million), by Types 2024 & 2032
- Figure 29: Asia Pacific Instrument Landing System and Visual Landing Aids Revenue Share (%), by Types 2024 & 2032
- Figure 30: Asia Pacific Instrument Landing System and Visual Landing Aids Revenue (million), by Country 2024 & 2032
- Figure 31: Asia Pacific Instrument Landing System and Visual Landing Aids Revenue Share (%), by Country 2024 & 2032
List of Tables
- Table 1: Global Instrument Landing System and Visual Landing Aids Revenue million Forecast, by Region 2019 & 2032
- Table 2: Global Instrument Landing System and Visual Landing Aids Revenue million Forecast, by Application 2019 & 2032
- Table 3: Global Instrument Landing System and Visual Landing Aids Revenue million Forecast, by Types 2019 & 2032
- Table 4: Global Instrument Landing System and Visual Landing Aids Revenue million Forecast, by Region 2019 & 2032
- Table 5: Global Instrument Landing System and Visual Landing Aids Revenue million Forecast, by Application 2019 & 2032
- Table 6: Global Instrument Landing System and Visual Landing Aids Revenue million Forecast, by Types 2019 & 2032
- Table 7: Global Instrument Landing System and Visual Landing Aids Revenue million Forecast, by Country 2019 & 2032
- Table 8: United States Instrument Landing System and Visual Landing Aids Revenue (million) Forecast, by Application 2019 & 2032
- Table 9: Canada Instrument Landing System and Visual Landing Aids Revenue (million) Forecast, by Application 2019 & 2032
- Table 10: Mexico Instrument Landing System and Visual Landing Aids Revenue (million) Forecast, by Application 2019 & 2032
- Table 11: Global Instrument Landing System and Visual Landing Aids Revenue million Forecast, by Application 2019 & 2032
- Table 12: Global Instrument Landing System and Visual Landing Aids Revenue million Forecast, by Types 2019 & 2032
- Table 13: Global Instrument Landing System and Visual Landing Aids Revenue million Forecast, by Country 2019 & 2032
- Table 14: Brazil Instrument Landing System and Visual Landing Aids Revenue (million) Forecast, by Application 2019 & 2032
- Table 15: Argentina Instrument Landing System and Visual Landing Aids Revenue (million) Forecast, by Application 2019 & 2032
- Table 16: Rest of South America Instrument Landing System and Visual Landing Aids Revenue (million) Forecast, by Application 2019 & 2032
- Table 17: Global Instrument Landing System and Visual Landing Aids Revenue million Forecast, by Application 2019 & 2032
- Table 18: Global Instrument Landing System and Visual Landing Aids Revenue million Forecast, by Types 2019 & 2032
- Table 19: Global Instrument Landing System and Visual Landing Aids Revenue million Forecast, by Country 2019 & 2032
- Table 20: United Kingdom Instrument Landing System and Visual Landing Aids Revenue (million) Forecast, by Application 2019 & 2032
- Table 21: Germany Instrument Landing System and Visual Landing Aids Revenue (million) Forecast, by Application 2019 & 2032
- Table 22: France Instrument Landing System and Visual Landing Aids Revenue (million) Forecast, by Application 2019 & 2032
- Table 23: Italy Instrument Landing System and Visual Landing Aids Revenue (million) Forecast, by Application 2019 & 2032
- Table 24: Spain Instrument Landing System and Visual Landing Aids Revenue (million) Forecast, by Application 2019 & 2032
- Table 25: Russia Instrument Landing System and Visual Landing Aids Revenue (million) Forecast, by Application 2019 & 2032
- Table 26: Benelux Instrument Landing System and Visual Landing Aids Revenue (million) Forecast, by Application 2019 & 2032
- Table 27: Nordics Instrument Landing System and Visual Landing Aids Revenue (million) Forecast, by Application 2019 & 2032
- Table 28: Rest of Europe Instrument Landing System and Visual Landing Aids Revenue (million) Forecast, by Application 2019 & 2032
- Table 29: Global Instrument Landing System and Visual Landing Aids Revenue million Forecast, by Application 2019 & 2032
- Table 30: Global Instrument Landing System and Visual Landing Aids Revenue million Forecast, by Types 2019 & 2032
- Table 31: Global Instrument Landing System and Visual Landing Aids Revenue million Forecast, by Country 2019 & 2032
- Table 32: Turkey Instrument Landing System and Visual Landing Aids Revenue (million) Forecast, by Application 2019 & 2032
- Table 33: Israel Instrument Landing System and Visual Landing Aids Revenue (million) Forecast, by Application 2019 & 2032
- Table 34: GCC Instrument Landing System and Visual Landing Aids Revenue (million) Forecast, by Application 2019 & 2032
- Table 35: North Africa Instrument Landing System and Visual Landing Aids Revenue (million) Forecast, by Application 2019 & 2032
- Table 36: South Africa Instrument Landing System and Visual Landing Aids Revenue (million) Forecast, by Application 2019 & 2032
- Table 37: Rest of Middle East & Africa Instrument Landing System and Visual Landing Aids Revenue (million) Forecast, by Application 2019 & 2032
- Table 38: Global Instrument Landing System and Visual Landing Aids Revenue million Forecast, by Application 2019 & 2032
- Table 39: Global Instrument Landing System and Visual Landing Aids Revenue million Forecast, by Types 2019 & 2032
- Table 40: Global Instrument Landing System and Visual Landing Aids Revenue million Forecast, by Country 2019 & 2032
- Table 41: China Instrument Landing System and Visual Landing Aids Revenue (million) Forecast, by Application 2019 & 2032
- Table 42: India Instrument Landing System and Visual Landing Aids Revenue (million) Forecast, by Application 2019 & 2032
- Table 43: Japan Instrument Landing System and Visual Landing Aids Revenue (million) Forecast, by Application 2019 & 2032
- Table 44: South Korea Instrument Landing System and Visual Landing Aids Revenue (million) Forecast, by Application 2019 & 2032
- Table 45: ASEAN Instrument Landing System and Visual Landing Aids Revenue (million) Forecast, by Application 2019 & 2032
- Table 46: Oceania Instrument Landing System and Visual Landing Aids Revenue (million) Forecast, by Application 2019 & 2032
- Table 47: Rest of Asia Pacific Instrument Landing System and Visual Landing Aids Revenue (million) Forecast, by Application 2019 & 2032
Frequently Asked Questions
1. What is the projected Compound Annual Growth Rate (CAGR) of the Instrument Landing System and Visual Landing Aids?
The projected CAGR is approximately 4.6%.
2. Which companies are prominent players in the Instrument Landing System and Visual Landing Aids?
Key companies in the market include Thales Group, Rockwell Collins, Honeywell, Universal Avionics Systems, Api Technologies, Calzoni, Adb Airfield Solutions, Multi Electric Manufacturing, Airport Lighting Specialists, Airport Lighting Company, Atg Airports, Astronics Corporation, Liberty Airport Systems, Saab Sensis Corporation, Advanced Navigation & Positioning, Systems Interface.
3. What are the main segments of the Instrument Landing System and Visual Landing Aids?
The market segments include Application, Types.
4. Can you provide details about the market size?
The market size is estimated to be USD 1671.7 million as of 2022.
5. What are some drivers contributing to market growth?
N/A
6. What are the notable trends driving market growth?
N/A
7. Are there any restraints impacting market growth?
N/A
8. Can you provide examples of recent developments in the market?
N/A
9. What pricing options are available for accessing the report?
Pricing options include single-user, multi-user, and enterprise licenses priced at USD 4900.00, USD 7350.00, and USD 9800.00 respectively.
10. Is the market size provided in terms of value or volume?
The market size is provided in terms of value, measured in million.
11. Are there any specific market keywords associated with the report?
Yes, the market keyword associated with the report is "Instrument Landing System and Visual Landing Aids," which aids in identifying and referencing the specific market segment covered.
12. How do I determine which pricing option suits my needs best?
The pricing options vary based on user requirements and access needs. Individual users may opt for single-user licenses, while businesses requiring broader access may choose multi-user or enterprise licenses for cost-effective access to the report.
13. Are there any additional resources or data provided in the Instrument Landing System and Visual Landing Aids report?
While the report offers comprehensive insights, it's advisable to review the specific contents or supplementary materials provided to ascertain if additional resources or data are available.
14. How can I stay updated on further developments or reports in the Instrument Landing System and Visual Landing Aids?
To stay informed about further developments, trends, and reports in the Instrument Landing System and Visual Landing Aids, consider subscribing to industry newsletters, following relevant companies and organizations, or regularly checking reputable industry news sources and publications.
Methodology
Step 1 - Identification of Relevant Samples Size from Population Database


Step 2 - Approaches for Defining Global Market Size (Value, Volume* & Price*)

Note*: In applicable scenarios
Step 3 - Data Sources
Primary Research
- Web Analytics
- Survey Reports
- Research Institute
- Latest Research Reports
- Opinion Leaders
Secondary Research
- Annual Reports
- White Paper
- Latest Press Release
- Industry Association
- Paid Database
- Investor Presentations

Step 4 - Data Triangulation
Involves using different sources of information in order to increase the validity of a study
These sources are likely to be stakeholders in a program - participants, other researchers, program staff, other community members, and so on.
Then we put all data in single framework & apply various statistical tools to find out the dynamic on the market.
During the analysis stage, feedback from the stakeholder groups would be compared to determine areas of agreement as well as areas of divergence
