

Key Insights
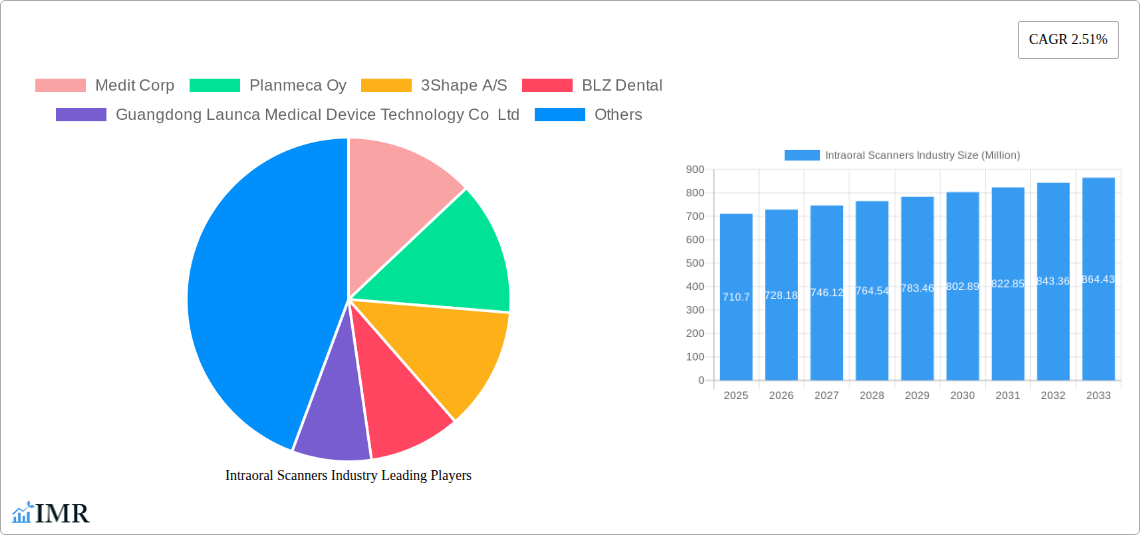
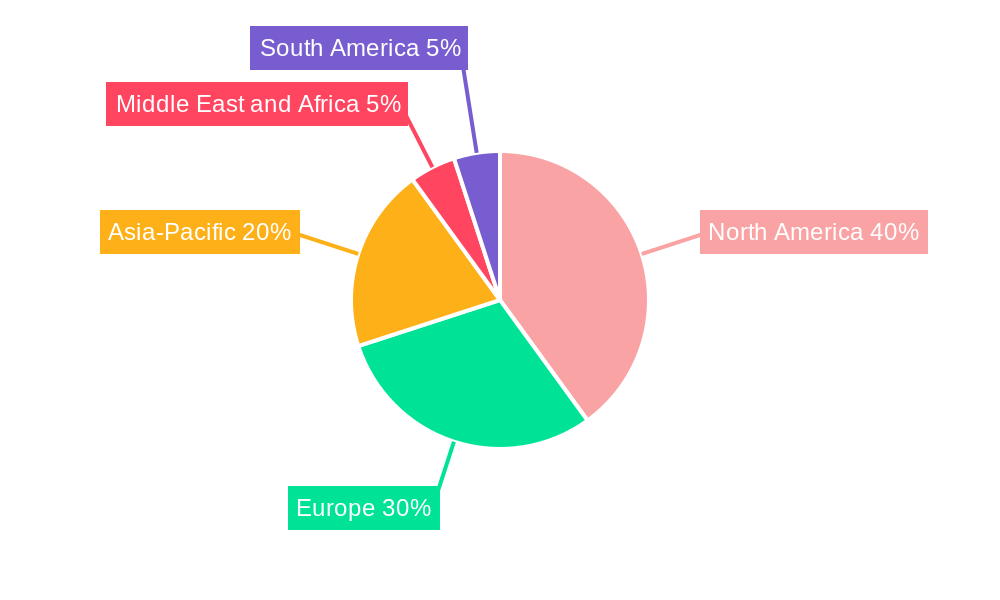
The global intraoral scanner market, valued at $710.70 million in 2025, is projected to experience steady growth, driven by several key factors. Technological advancements leading to improved image quality, faster scanning speeds, and enhanced software integration are significantly boosting adoption. The increasing demand for minimally invasive dental procedures and the rising prevalence of dental diseases are further fueling market expansion. Furthermore, the integration of intraoral scanners into digital workflows, streamlining dental practices and improving patient care, is a major catalyst. The market is segmented by modality (standalone and portable) and end-user (dental clinics, hospitals, and other end-users), with dental clinics currently dominating the market share due to the high volume of procedures. Portable scanners are gaining traction due to their convenience and portability, leading to growth in remote areas and smaller practices. While the initial high investment cost of intraoral scanners might present a restraint, the long-term cost savings and improved efficiency they offer are gradually overcoming this barrier. The North American market currently holds a significant share, driven by advanced healthcare infrastructure and high adoption rates. However, developing economies in regions like Asia-Pacific are demonstrating rapid growth potential due to increasing dental awareness and improving healthcare spending.
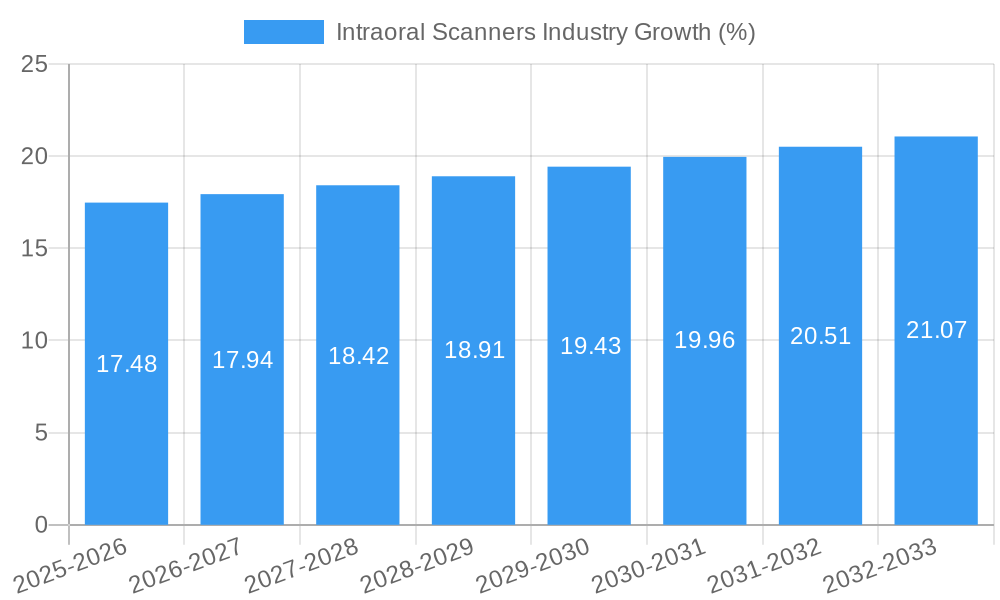
Looking ahead to 2033, a conservative estimate, based on the provided CAGR of 2.51%, suggests a continued, albeit moderate, expansion of the market. This growth will likely be fueled by factors like the increasing availability of affordable intraoral scanners, the continuous development of more sophisticated and user-friendly technologies, and the expansion of dental insurance coverage globally. Competition among established players and the emergence of new entrants is likely to intensify, driving innovation and potentially impacting pricing strategies. The long-term outlook remains positive, with the intraoral scanner market poised for sustained growth driven by the continuous evolution of dental technology and the growing emphasis on digital dentistry.
Intraoral Scanners Industry Market Report: 2019-2033
This comprehensive report provides an in-depth analysis of the Intraoral Scanners market, encompassing market dynamics, growth trends, regional analysis, product landscape, key players, and future outlook. The study period covers 2019-2033, with a base year of 2025 and a forecast period of 2025-2033. The report segments the market by modality (standalone, portable) and end-user (dental clinics, hospitals, other end users), providing granular insights for informed strategic decision-making. The market is estimated at xx Million units in 2025.
Intraoral Scanners Industry Market Dynamics & Structure
The intraoral scanners market is characterized by moderate concentration, with key players like Medit Corp, 3Shape A/S, and Dentsply Sirona Inc holding significant market share. Technological advancements, particularly in image processing and AI-driven diagnostics, are primary drivers. Stringent regulatory approvals for medical devices influence market entry and product development. The market faces competition from traditional impression-taking methods but enjoys increasing adoption due to enhanced accuracy and efficiency. Mergers and acquisitions (M&A) activity has been relatively steady, with xx M&A deals recorded between 2019 and 2024.
- Market Concentration: Moderately concentrated, with top 5 players holding approximately xx% market share in 2025.
- Technological Innovation: Focus on improved accuracy, speed, and integration with CAD/CAM workflows.
- Regulatory Framework: Stringent regulatory approvals (e.g., FDA, CE mark) impacting market entry.
- Competitive Substitutes: Traditional impression-taking methods.
- End-User Demographics: Primarily driven by the growth of dental clinics and increasing adoption in hospitals.
- M&A Trends: xx M&A deals between 2019 and 2024, indicating consolidation and expansion.
Intraoral Scanners Industry Growth Trends & Insights
The global intraoral scanners market witnessed robust growth during the historical period (2019-2024), driven by technological advancements and rising demand from dental professionals. The market size expanded from xx Million units in 2019 to xx Million units in 2024, exhibiting a CAGR of xx%. This growth is expected to continue during the forecast period (2025-2033), albeit at a slightly moderated pace, reaching xx Million units by 2033 with a projected CAGR of xx%. This moderation reflects market maturity but also considers continued adoption in emerging markets and technological advancements. Market penetration is currently at xx% in developed markets and is expected to significantly increase in developing regions. Technological disruptions such as AI integration for improved diagnostics and seamless CAD/CAM integration are accelerating market adoption.
Dominant Regions, Countries, or Segments in Intraoral Scanners Industry
North America currently holds the largest market share in the intraoral scanners industry, followed by Europe. This dominance is primarily attributed to high dental care expenditure, advanced healthcare infrastructure, and early adoption of digital dentistry technologies. Within modalities, the standalone segment dominates due to its higher accuracy and features, while the portable segment is witnessing faster growth driven by portability and affordability. Dental clinics represent the largest end-user segment, but hospitals are showing promising growth potential due to increased integration into digital workflows.
- North America: High dental care expenditure, established healthcare infrastructure, and early adoption of digital dentistry.
- Europe: Significant dental care market, growing awareness of digital dentistry benefits.
- Asia-Pacific: Rapidly expanding dental care market, increasing adoption driven by cost-effectiveness.
- Standalone Modality: Higher accuracy and comprehensive features.
- Dental Clinics: Largest end-user segment.
Intraoral Scanners Industry Product Landscape
Intraoral scanners are evolving rapidly, incorporating features like improved image processing algorithms, faster scanning speeds, and enhanced color accuracy. Products are designed for seamless integration with existing CAD/CAM workflows and offer a range of features, including different scanning modes and intuitive software interfaces. Key innovations include the use of AI for automated data processing and improved diagnostics. The unique selling propositions often include ease of use, improved accuracy, and fast scanning times.
Key Drivers, Barriers & Challenges in Intraoral Scanners Industry
Key Drivers:
- Rising demand for efficient and accurate dental procedures.
- Technological advancements leading to enhanced features and performance.
- Growing adoption of digital dentistry worldwide.
- Favorable regulatory environment in developed markets.
Challenges:
- High initial investment costs limiting adoption in some regions.
- Competition from established impression-taking techniques.
- Regulatory hurdles and compliance requirements.
- Supply chain disruptions affecting component availability and production costs.
Emerging Opportunities in Intraoral Scanners Industry
Untapped markets in developing economies present significant opportunities. The integration of AI and machine learning for improved diagnostics and automated workflows offers further expansion potential. The development of more compact and affordable portable scanners could drive wider adoption in remote areas. The emergence of new applications, such as orthodontics and implantology, is driving demand.
Growth Accelerators in the Intraoral Scanners Industry Industry
Technological breakthroughs in imaging and AI are key growth drivers. Strategic partnerships between scanner manufacturers and dental software providers are creating integrated solutions. Expanding into untapped markets and focusing on cost-effective solutions can accelerate market growth. Moreover, the growing adoption of digital workflows in dental practices is a major driver.
Key Players Shaping the Intraoral Scanners Industry Market
- Medit Corp
- Planmeca Oy
- 3Shape A/S
- BLZ Dental
- Guangdong Launca Medical Device Technology Co Ltd
- Densys Ltd
- Condor Technologies NV
- Dentsply Sirona Inc
- Align Technology Inc
- Institut Straumann AG
Notable Milestones in Intraoral Scanners Industry Sector
- March 2023: Freqty Technology launched the PANDA Smart intra-oral scanner at IDS Germany.
- March 2023: GC launched the Aadva IOS 200 intra-oral scanner with 4DR technology at IDS Cologne.
In-Depth Intraoral Scanners Industry Market Outlook
The future of the intraoral scanners market is bright, driven by continuous technological innovation and growing adoption in dental practices globally. Strategic partnerships, market expansion into emerging regions, and the development of integrated solutions will further propel market growth. The focus on AI-powered diagnostics and improved user experience will contribute to increased market penetration and value creation. The market is poised for sustained growth throughout the forecast period, driven by the evolving landscape of digital dentistry.
Intraoral Scanners Industry Segmentation
-
1. Modality
- 1.1. Standalone
- 1.2. Portable
-
2. End User
- 2.1. Dental Clinics
- 2.2. Hospitals
- 2.3. Other End Users
Intraoral Scanners Industry Segmentation By Geography
-
1. North America
- 1.1. United States
- 1.2. Canada
- 1.3. Mexico
-
2. Europe
- 2.1. Germany
- 2.2. United Kingdom
- 2.3. France
- 2.4. Italy
- 2.5. Spain
- 2.6. Rest of Europe
-
3. Asia Pacific
- 3.1. China
- 3.2. Japan
- 3.3. India
- 3.4. Australia
- 3.5. South Korea
- 3.6. Rest of Asia Pacific
-
4. Middle East and Africa
- 4.1. GCC
- 4.2. South Africa
- 4.3. Rest of Middle East and Africa
-
5. South America
- 5.1. Brazil
- 5.2. Argentina
- 5.3. Rest of South America
Intraoral Scanners Industry REPORT HIGHLIGHTS
| Aspects | Details |
|---|---|
| Study Period | 2019-2033 |
| Base Year | 2024 |
| Estimated Year | 2025 |
| Forecast Period | 2025-2033 |
| Historical Period | 2019-2024 |
| Growth Rate | CAGR of 2.51% from 2019-2033 |
| Segmentation |
|
Table of Contents
- 1. Introduction
- 1.1. Research Scope
- 1.2. Market Segmentation
- 1.3. Research Methodology
- 1.4. Definitions and Assumptions
- 2. Executive Summary
- 2.1. Introduction
- 3. Market Dynamics
- 3.1. Introduction
- 3.2. Market Drivers
- 3.2.1. Rapid Technological Advancements; Increase in Geriatric Population; Rise in Dental Disorders
- 3.3. Market Restrains
- 3.3.1. Lack of Skilled Professionals; High Cost of Intraoral Scanners
- 3.4. Market Trends
- 3.4.1. Standalone Devices Segment is Expected to Witness Strong Growth in The Coming Years
- 4. Market Factor Analysis
- 4.1. Porters Five Forces
- 4.2. Supply/Value Chain
- 4.3. PESTEL analysis
- 4.4. Market Entropy
- 4.5. Patent/Trademark Analysis
- 5. Global Intraoral Scanners Industry Analysis, Insights and Forecast, 2019-2031
- 5.1. Market Analysis, Insights and Forecast - by Modality
- 5.1.1. Standalone
- 5.1.2. Portable
- 5.2. Market Analysis, Insights and Forecast - by End User
- 5.2.1. Dental Clinics
- 5.2.2. Hospitals
- 5.2.3. Other End Users
- 5.3. Market Analysis, Insights and Forecast - by Region
- 5.3.1. North America
- 5.3.2. Europe
- 5.3.3. Asia Pacific
- 5.3.4. Middle East and Africa
- 5.3.5. South America
- 5.1. Market Analysis, Insights and Forecast - by Modality
- 6. North America Intraoral Scanners Industry Analysis, Insights and Forecast, 2019-2031
- 6.1. Market Analysis, Insights and Forecast - by Modality
- 6.1.1. Standalone
- 6.1.2. Portable
- 6.2. Market Analysis, Insights and Forecast - by End User
- 6.2.1. Dental Clinics
- 6.2.2. Hospitals
- 6.2.3. Other End Users
- 6.1. Market Analysis, Insights and Forecast - by Modality
- 7. Europe Intraoral Scanners Industry Analysis, Insights and Forecast, 2019-2031
- 7.1. Market Analysis, Insights and Forecast - by Modality
- 7.1.1. Standalone
- 7.1.2. Portable
- 7.2. Market Analysis, Insights and Forecast - by End User
- 7.2.1. Dental Clinics
- 7.2.2. Hospitals
- 7.2.3. Other End Users
- 7.1. Market Analysis, Insights and Forecast - by Modality
- 8. Asia Pacific Intraoral Scanners Industry Analysis, Insights and Forecast, 2019-2031
- 8.1. Market Analysis, Insights and Forecast - by Modality
- 8.1.1. Standalone
- 8.1.2. Portable
- 8.2. Market Analysis, Insights and Forecast - by End User
- 8.2.1. Dental Clinics
- 8.2.2. Hospitals
- 8.2.3. Other End Users
- 8.1. Market Analysis, Insights and Forecast - by Modality
- 9. Middle East and Africa Intraoral Scanners Industry Analysis, Insights and Forecast, 2019-2031
- 9.1. Market Analysis, Insights and Forecast - by Modality
- 9.1.1. Standalone
- 9.1.2. Portable
- 9.2. Market Analysis, Insights and Forecast - by End User
- 9.2.1. Dental Clinics
- 9.2.2. Hospitals
- 9.2.3. Other End Users
- 9.1. Market Analysis, Insights and Forecast - by Modality
- 10. South America Intraoral Scanners Industry Analysis, Insights and Forecast, 2019-2031
- 10.1. Market Analysis, Insights and Forecast - by Modality
- 10.1.1. Standalone
- 10.1.2. Portable
- 10.2. Market Analysis, Insights and Forecast - by End User
- 10.2.1. Dental Clinics
- 10.2.2. Hospitals
- 10.2.3. Other End Users
- 10.1. Market Analysis, Insights and Forecast - by Modality
- 11. North America Intraoral Scanners Industry Analysis, Insights and Forecast, 2019-2031
- 11.1. Market Analysis, Insights and Forecast - By Country/Sub-region
- 11.1.1. undefined
- 12. Europe Intraoral Scanners Industry Analysis, Insights and Forecast, 2019-2031
- 12.1. Market Analysis, Insights and Forecast - By Country/Sub-region
- 12.1.1. undefined
- 13. Middle East and Africa Intraoral Scanners Industry Analysis, Insights and Forecast, 2019-2031
- 13.1. Market Analysis, Insights and Forecast - By Country/Sub-region
- 13.1.1. undefined
- 14. South America Intraoral Scanners Industry Analysis, Insights and Forecast, 2019-2031
- 14.1. Market Analysis, Insights and Forecast - By Country/Sub-region
- 14.1.1. undefined
- 15. Competitive Analysis
- 15.1. Global Market Share Analysis 2024
- 15.2. Company Profiles
- 15.2.1 Medit Corp
- 15.2.1.1. Overview
- 15.2.1.2. Products
- 15.2.1.3. SWOT Analysis
- 15.2.1.4. Recent Developments
- 15.2.1.5. Financials (Based on Availability)
- 15.2.2 Planmeca Oy
- 15.2.2.1. Overview
- 15.2.2.2. Products
- 15.2.2.3. SWOT Analysis
- 15.2.2.4. Recent Developments
- 15.2.2.5. Financials (Based on Availability)
- 15.2.3 3Shape A/S
- 15.2.3.1. Overview
- 15.2.3.2. Products
- 15.2.3.3. SWOT Analysis
- 15.2.3.4. Recent Developments
- 15.2.3.5. Financials (Based on Availability)
- 15.2.4 BLZ Dental
- 15.2.4.1. Overview
- 15.2.4.2. Products
- 15.2.4.3. SWOT Analysis
- 15.2.4.4. Recent Developments
- 15.2.4.5. Financials (Based on Availability)
- 15.2.5 Guangdong Launca Medical Device Technology Co Ltd
- 15.2.5.1. Overview
- 15.2.5.2. Products
- 15.2.5.3. SWOT Analysis
- 15.2.5.4. Recent Developments
- 15.2.5.5. Financials (Based on Availability)
- 15.2.6 Densys Ltd
- 15.2.6.1. Overview
- 15.2.6.2. Products
- 15.2.6.3. SWOT Analysis
- 15.2.6.4. Recent Developments
- 15.2.6.5. Financials (Based on Availability)
- 15.2.7 Condor Technologies NV
- 15.2.7.1. Overview
- 15.2.7.2. Products
- 15.2.7.3. SWOT Analysis
- 15.2.7.4. Recent Developments
- 15.2.7.5. Financials (Based on Availability)
- 15.2.8 Dentsply Sirona Inc
- 15.2.8.1. Overview
- 15.2.8.2. Products
- 15.2.8.3. SWOT Analysis
- 15.2.8.4. Recent Developments
- 15.2.8.5. Financials (Based on Availability)
- 15.2.9 Align Technology Inc
- 15.2.9.1. Overview
- 15.2.9.2. Products
- 15.2.9.3. SWOT Analysis
- 15.2.9.4. Recent Developments
- 15.2.9.5. Financials (Based on Availability)
- 15.2.10 Institut Straumann AG
- 15.2.10.1. Overview
- 15.2.10.2. Products
- 15.2.10.3. SWOT Analysis
- 15.2.10.4. Recent Developments
- 15.2.10.5. Financials (Based on Availability)
- 15.2.1 Medit Corp
List of Figures
- Figure 1: Global Intraoral Scanners Industry Revenue Breakdown (Million, %) by Region 2024 & 2032
- Figure 2: Global Intraoral Scanners Industry Volume Breakdown (K Unit, %) by Region 2024 & 2032
- Figure 3: North America Intraoral Scanners Industry Revenue (Million), by Country 2024 & 2032
- Figure 4: North America Intraoral Scanners Industry Volume (K Unit), by Country 2024 & 2032
- Figure 5: North America Intraoral Scanners Industry Revenue Share (%), by Country 2024 & 2032
- Figure 6: North America Intraoral Scanners Industry Volume Share (%), by Country 2024 & 2032
- Figure 7: Europe Intraoral Scanners Industry Revenue (Million), by Country 2024 & 2032
- Figure 8: Europe Intraoral Scanners Industry Volume (K Unit), by Country 2024 & 2032
- Figure 9: Europe Intraoral Scanners Industry Revenue Share (%), by Country 2024 & 2032
- Figure 10: Europe Intraoral Scanners Industry Volume Share (%), by Country 2024 & 2032
- Figure 11: Middle East and Africa Intraoral Scanners Industry Revenue (Million), by Country 2024 & 2032
- Figure 12: Middle East and Africa Intraoral Scanners Industry Volume (K Unit), by Country 2024 & 2032
- Figure 13: Middle East and Africa Intraoral Scanners Industry Revenue Share (%), by Country 2024 & 2032
- Figure 14: Middle East and Africa Intraoral Scanners Industry Volume Share (%), by Country 2024 & 2032
- Figure 15: South America Intraoral Scanners Industry Revenue (Million), by Country 2024 & 2032
- Figure 16: South America Intraoral Scanners Industry Volume (K Unit), by Country 2024 & 2032
- Figure 17: South America Intraoral Scanners Industry Revenue Share (%), by Country 2024 & 2032
- Figure 18: South America Intraoral Scanners Industry Volume Share (%), by Country 2024 & 2032
- Figure 19: North America Intraoral Scanners Industry Revenue (Million), by Modality 2024 & 2032
- Figure 20: North America Intraoral Scanners Industry Volume (K Unit), by Modality 2024 & 2032
- Figure 21: North America Intraoral Scanners Industry Revenue Share (%), by Modality 2024 & 2032
- Figure 22: North America Intraoral Scanners Industry Volume Share (%), by Modality 2024 & 2032
- Figure 23: North America Intraoral Scanners Industry Revenue (Million), by End User 2024 & 2032
- Figure 24: North America Intraoral Scanners Industry Volume (K Unit), by End User 2024 & 2032
- Figure 25: North America Intraoral Scanners Industry Revenue Share (%), by End User 2024 & 2032
- Figure 26: North America Intraoral Scanners Industry Volume Share (%), by End User 2024 & 2032
- Figure 27: North America Intraoral Scanners Industry Revenue (Million), by Country 2024 & 2032
- Figure 28: North America Intraoral Scanners Industry Volume (K Unit), by Country 2024 & 2032
- Figure 29: North America Intraoral Scanners Industry Revenue Share (%), by Country 2024 & 2032
- Figure 30: North America Intraoral Scanners Industry Volume Share (%), by Country 2024 & 2032
- Figure 31: Europe Intraoral Scanners Industry Revenue (Million), by Modality 2024 & 2032
- Figure 32: Europe Intraoral Scanners Industry Volume (K Unit), by Modality 2024 & 2032
- Figure 33: Europe Intraoral Scanners Industry Revenue Share (%), by Modality 2024 & 2032
- Figure 34: Europe Intraoral Scanners Industry Volume Share (%), by Modality 2024 & 2032
- Figure 35: Europe Intraoral Scanners Industry Revenue (Million), by End User 2024 & 2032
- Figure 36: Europe Intraoral Scanners Industry Volume (K Unit), by End User 2024 & 2032
- Figure 37: Europe Intraoral Scanners Industry Revenue Share (%), by End User 2024 & 2032
- Figure 38: Europe Intraoral Scanners Industry Volume Share (%), by End User 2024 & 2032
- Figure 39: Europe Intraoral Scanners Industry Revenue (Million), by Country 2024 & 2032
- Figure 40: Europe Intraoral Scanners Industry Volume (K Unit), by Country 2024 & 2032
- Figure 41: Europe Intraoral Scanners Industry Revenue Share (%), by Country 2024 & 2032
- Figure 42: Europe Intraoral Scanners Industry Volume Share (%), by Country 2024 & 2032
- Figure 43: Asia Pacific Intraoral Scanners Industry Revenue (Million), by Modality 2024 & 2032
- Figure 44: Asia Pacific Intraoral Scanners Industry Volume (K Unit), by Modality 2024 & 2032
- Figure 45: Asia Pacific Intraoral Scanners Industry Revenue Share (%), by Modality 2024 & 2032
- Figure 46: Asia Pacific Intraoral Scanners Industry Volume Share (%), by Modality 2024 & 2032
- Figure 47: Asia Pacific Intraoral Scanners Industry Revenue (Million), by End User 2024 & 2032
- Figure 48: Asia Pacific Intraoral Scanners Industry Volume (K Unit), by End User 2024 & 2032
- Figure 49: Asia Pacific Intraoral Scanners Industry Revenue Share (%), by End User 2024 & 2032
- Figure 50: Asia Pacific Intraoral Scanners Industry Volume Share (%), by End User 2024 & 2032
- Figure 51: Asia Pacific Intraoral Scanners Industry Revenue (Million), by Country 2024 & 2032
- Figure 52: Asia Pacific Intraoral Scanners Industry Volume (K Unit), by Country 2024 & 2032
- Figure 53: Asia Pacific Intraoral Scanners Industry Revenue Share (%), by Country 2024 & 2032
- Figure 54: Asia Pacific Intraoral Scanners Industry Volume Share (%), by Country 2024 & 2032
- Figure 55: Middle East and Africa Intraoral Scanners Industry Revenue (Million), by Modality 2024 & 2032
- Figure 56: Middle East and Africa Intraoral Scanners Industry Volume (K Unit), by Modality 2024 & 2032
- Figure 57: Middle East and Africa Intraoral Scanners Industry Revenue Share (%), by Modality 2024 & 2032
- Figure 58: Middle East and Africa Intraoral Scanners Industry Volume Share (%), by Modality 2024 & 2032
- Figure 59: Middle East and Africa Intraoral Scanners Industry Revenue (Million), by End User 2024 & 2032
- Figure 60: Middle East and Africa Intraoral Scanners Industry Volume (K Unit), by End User 2024 & 2032
- Figure 61: Middle East and Africa Intraoral Scanners Industry Revenue Share (%), by End User 2024 & 2032
- Figure 62: Middle East and Africa Intraoral Scanners Industry Volume Share (%), by End User 2024 & 2032
- Figure 63: Middle East and Africa Intraoral Scanners Industry Revenue (Million), by Country 2024 & 2032
- Figure 64: Middle East and Africa Intraoral Scanners Industry Volume (K Unit), by Country 2024 & 2032
- Figure 65: Middle East and Africa Intraoral Scanners Industry Revenue Share (%), by Country 2024 & 2032
- Figure 66: Middle East and Africa Intraoral Scanners Industry Volume Share (%), by Country 2024 & 2032
- Figure 67: South America Intraoral Scanners Industry Revenue (Million), by Modality 2024 & 2032
- Figure 68: South America Intraoral Scanners Industry Volume (K Unit), by Modality 2024 & 2032
- Figure 69: South America Intraoral Scanners Industry Revenue Share (%), by Modality 2024 & 2032
- Figure 70: South America Intraoral Scanners Industry Volume Share (%), by Modality 2024 & 2032
- Figure 71: South America Intraoral Scanners Industry Revenue (Million), by End User 2024 & 2032
- Figure 72: South America Intraoral Scanners Industry Volume (K Unit), by End User 2024 & 2032
- Figure 73: South America Intraoral Scanners Industry Revenue Share (%), by End User 2024 & 2032
- Figure 74: South America Intraoral Scanners Industry Volume Share (%), by End User 2024 & 2032
- Figure 75: South America Intraoral Scanners Industry Revenue (Million), by Country 2024 & 2032
- Figure 76: South America Intraoral Scanners Industry Volume (K Unit), by Country 2024 & 2032
- Figure 77: South America Intraoral Scanners Industry Revenue Share (%), by Country 2024 & 2032
- Figure 78: South America Intraoral Scanners Industry Volume Share (%), by Country 2024 & 2032
List of Tables
- Table 1: Global Intraoral Scanners Industry Revenue Million Forecast, by Region 2019 & 2032
- Table 2: Global Intraoral Scanners Industry Volume K Unit Forecast, by Region 2019 & 2032
- Table 3: Global Intraoral Scanners Industry Revenue Million Forecast, by Modality 2019 & 2032
- Table 4: Global Intraoral Scanners Industry Volume K Unit Forecast, by Modality 2019 & 2032
- Table 5: Global Intraoral Scanners Industry Revenue Million Forecast, by End User 2019 & 2032
- Table 6: Global Intraoral Scanners Industry Volume K Unit Forecast, by End User 2019 & 2032
- Table 7: Global Intraoral Scanners Industry Revenue Million Forecast, by Region 2019 & 2032
- Table 8: Global Intraoral Scanners Industry Volume K Unit Forecast, by Region 2019 & 2032
- Table 9: Global Intraoral Scanners Industry Revenue Million Forecast, by Country 2019 & 2032
- Table 10: Global Intraoral Scanners Industry Volume K Unit Forecast, by Country 2019 & 2032
- Table 11: Global Intraoral Scanners Industry Revenue Million Forecast, by Country 2019 & 2032
- Table 12: Global Intraoral Scanners Industry Volume K Unit Forecast, by Country 2019 & 2032
- Table 13: Global Intraoral Scanners Industry Revenue Million Forecast, by Country 2019 & 2032
- Table 14: Global Intraoral Scanners Industry Volume K Unit Forecast, by Country 2019 & 2032
- Table 15: Global Intraoral Scanners Industry Revenue Million Forecast, by Country 2019 & 2032
- Table 16: Global Intraoral Scanners Industry Volume K Unit Forecast, by Country 2019 & 2032
- Table 17: Global Intraoral Scanners Industry Revenue Million Forecast, by Modality 2019 & 2032
- Table 18: Global Intraoral Scanners Industry Volume K Unit Forecast, by Modality 2019 & 2032
- Table 19: Global Intraoral Scanners Industry Revenue Million Forecast, by End User 2019 & 2032
- Table 20: Global Intraoral Scanners Industry Volume K Unit Forecast, by End User 2019 & 2032
- Table 21: Global Intraoral Scanners Industry Revenue Million Forecast, by Country 2019 & 2032
- Table 22: Global Intraoral Scanners Industry Volume K Unit Forecast, by Country 2019 & 2032
- Table 23: United States Intraoral Scanners Industry Revenue (Million) Forecast, by Application 2019 & 2032
- Table 24: United States Intraoral Scanners Industry Volume (K Unit) Forecast, by Application 2019 & 2032
- Table 25: Canada Intraoral Scanners Industry Revenue (Million) Forecast, by Application 2019 & 2032
- Table 26: Canada Intraoral Scanners Industry Volume (K Unit) Forecast, by Application 2019 & 2032
- Table 27: Mexico Intraoral Scanners Industry Revenue (Million) Forecast, by Application 2019 & 2032
- Table 28: Mexico Intraoral Scanners Industry Volume (K Unit) Forecast, by Application 2019 & 2032
- Table 29: Global Intraoral Scanners Industry Revenue Million Forecast, by Modality 2019 & 2032
- Table 30: Global Intraoral Scanners Industry Volume K Unit Forecast, by Modality 2019 & 2032
- Table 31: Global Intraoral Scanners Industry Revenue Million Forecast, by End User 2019 & 2032
- Table 32: Global Intraoral Scanners Industry Volume K Unit Forecast, by End User 2019 & 2032
- Table 33: Global Intraoral Scanners Industry Revenue Million Forecast, by Country 2019 & 2032
- Table 34: Global Intraoral Scanners Industry Volume K Unit Forecast, by Country 2019 & 2032
- Table 35: Germany Intraoral Scanners Industry Revenue (Million) Forecast, by Application 2019 & 2032
- Table 36: Germany Intraoral Scanners Industry Volume (K Unit) Forecast, by Application 2019 & 2032
- Table 37: United Kingdom Intraoral Scanners Industry Revenue (Million) Forecast, by Application 2019 & 2032
- Table 38: United Kingdom Intraoral Scanners Industry Volume (K Unit) Forecast, by Application 2019 & 2032
- Table 39: France Intraoral Scanners Industry Revenue (Million) Forecast, by Application 2019 & 2032
- Table 40: France Intraoral Scanners Industry Volume (K Unit) Forecast, by Application 2019 & 2032
- Table 41: Italy Intraoral Scanners Industry Revenue (Million) Forecast, by Application 2019 & 2032
- Table 42: Italy Intraoral Scanners Industry Volume (K Unit) Forecast, by Application 2019 & 2032
- Table 43: Spain Intraoral Scanners Industry Revenue (Million) Forecast, by Application 2019 & 2032
- Table 44: Spain Intraoral Scanners Industry Volume (K Unit) Forecast, by Application 2019 & 2032
- Table 45: Rest of Europe Intraoral Scanners Industry Revenue (Million) Forecast, by Application 2019 & 2032
- Table 46: Rest of Europe Intraoral Scanners Industry Volume (K Unit) Forecast, by Application 2019 & 2032
- Table 47: Global Intraoral Scanners Industry Revenue Million Forecast, by Modality 2019 & 2032
- Table 48: Global Intraoral Scanners Industry Volume K Unit Forecast, by Modality 2019 & 2032
- Table 49: Global Intraoral Scanners Industry Revenue Million Forecast, by End User 2019 & 2032
- Table 50: Global Intraoral Scanners Industry Volume K Unit Forecast, by End User 2019 & 2032
- Table 51: Global Intraoral Scanners Industry Revenue Million Forecast, by Country 2019 & 2032
- Table 52: Global Intraoral Scanners Industry Volume K Unit Forecast, by Country 2019 & 2032
- Table 53: China Intraoral Scanners Industry Revenue (Million) Forecast, by Application 2019 & 2032
- Table 54: China Intraoral Scanners Industry Volume (K Unit) Forecast, by Application 2019 & 2032
- Table 55: Japan Intraoral Scanners Industry Revenue (Million) Forecast, by Application 2019 & 2032
- Table 56: Japan Intraoral Scanners Industry Volume (K Unit) Forecast, by Application 2019 & 2032
- Table 57: India Intraoral Scanners Industry Revenue (Million) Forecast, by Application 2019 & 2032
- Table 58: India Intraoral Scanners Industry Volume (K Unit) Forecast, by Application 2019 & 2032
- Table 59: Australia Intraoral Scanners Industry Revenue (Million) Forecast, by Application 2019 & 2032
- Table 60: Australia Intraoral Scanners Industry Volume (K Unit) Forecast, by Application 2019 & 2032
- Table 61: South Korea Intraoral Scanners Industry Revenue (Million) Forecast, by Application 2019 & 2032
- Table 62: South Korea Intraoral Scanners Industry Volume (K Unit) Forecast, by Application 2019 & 2032
- Table 63: Rest of Asia Pacific Intraoral Scanners Industry Revenue (Million) Forecast, by Application 2019 & 2032
- Table 64: Rest of Asia Pacific Intraoral Scanners Industry Volume (K Unit) Forecast, by Application 2019 & 2032
- Table 65: Global Intraoral Scanners Industry Revenue Million Forecast, by Modality 2019 & 2032
- Table 66: Global Intraoral Scanners Industry Volume K Unit Forecast, by Modality 2019 & 2032
- Table 67: Global Intraoral Scanners Industry Revenue Million Forecast, by End User 2019 & 2032
- Table 68: Global Intraoral Scanners Industry Volume K Unit Forecast, by End User 2019 & 2032
- Table 69: Global Intraoral Scanners Industry Revenue Million Forecast, by Country 2019 & 2032
- Table 70: Global Intraoral Scanners Industry Volume K Unit Forecast, by Country 2019 & 2032
- Table 71: GCC Intraoral Scanners Industry Revenue (Million) Forecast, by Application 2019 & 2032
- Table 72: GCC Intraoral Scanners Industry Volume (K Unit) Forecast, by Application 2019 & 2032
- Table 73: South Africa Intraoral Scanners Industry Revenue (Million) Forecast, by Application 2019 & 2032
- Table 74: South Africa Intraoral Scanners Industry Volume (K Unit) Forecast, by Application 2019 & 2032
- Table 75: Rest of Middle East and Africa Intraoral Scanners Industry Revenue (Million) Forecast, by Application 2019 & 2032
- Table 76: Rest of Middle East and Africa Intraoral Scanners Industry Volume (K Unit) Forecast, by Application 2019 & 2032
- Table 77: Global Intraoral Scanners Industry Revenue Million Forecast, by Modality 2019 & 2032
- Table 78: Global Intraoral Scanners Industry Volume K Unit Forecast, by Modality 2019 & 2032
- Table 79: Global Intraoral Scanners Industry Revenue Million Forecast, by End User 2019 & 2032
- Table 80: Global Intraoral Scanners Industry Volume K Unit Forecast, by End User 2019 & 2032
- Table 81: Global Intraoral Scanners Industry Revenue Million Forecast, by Country 2019 & 2032
- Table 82: Global Intraoral Scanners Industry Volume K Unit Forecast, by Country 2019 & 2032
- Table 83: Brazil Intraoral Scanners Industry Revenue (Million) Forecast, by Application 2019 & 2032
- Table 84: Brazil Intraoral Scanners Industry Volume (K Unit) Forecast, by Application 2019 & 2032
- Table 85: Argentina Intraoral Scanners Industry Revenue (Million) Forecast, by Application 2019 & 2032
- Table 86: Argentina Intraoral Scanners Industry Volume (K Unit) Forecast, by Application 2019 & 2032
- Table 87: Rest of South America Intraoral Scanners Industry Revenue (Million) Forecast, by Application 2019 & 2032
- Table 88: Rest of South America Intraoral Scanners Industry Volume (K Unit) Forecast, by Application 2019 & 2032
Frequently Asked Questions
1. What is the projected Compound Annual Growth Rate (CAGR) of the Intraoral Scanners Industry?
The projected CAGR is approximately 2.51%.
2. Which companies are prominent players in the Intraoral Scanners Industry?
Key companies in the market include Medit Corp, Planmeca Oy, 3Shape A/S, BLZ Dental, Guangdong Launca Medical Device Technology Co Ltd, Densys Ltd, Condor Technologies NV, Dentsply Sirona Inc, Align Technology Inc, Institut Straumann AG.
3. What are the main segments of the Intraoral Scanners Industry?
The market segments include Modality, End User.
4. Can you provide details about the market size?
The market size is estimated to be USD 710.70 Million as of 2022.
5. What are some drivers contributing to market growth?
Rapid Technological Advancements; Increase in Geriatric Population; Rise in Dental Disorders.
6. What are the notable trends driving market growth?
Standalone Devices Segment is Expected to Witness Strong Growth in The Coming Years.
7. Are there any restraints impacting market growth?
Lack of Skilled Professionals; High Cost of Intraoral Scanners.
8. Can you provide examples of recent developments in the market?
March 2023: Freqty Technology, a Chinese high-tech enterprise in the field of digital dentistry, launched the latest and smallest PANDA intra-oral scanner, the PANDA Smart, at the International Dental Show (IDS) in Germany in 2023.
9. What pricing options are available for accessing the report?
Pricing options include single-user, multi-user, and enterprise licenses priced at USD 4750, USD 5250, and USD 8750 respectively.
10. Is the market size provided in terms of value or volume?
The market size is provided in terms of value, measured in Million and volume, measured in K Unit.
11. Are there any specific market keywords associated with the report?
Yes, the market keyword associated with the report is "Intraoral Scanners Industry," which aids in identifying and referencing the specific market segment covered.
12. How do I determine which pricing option suits my needs best?
The pricing options vary based on user requirements and access needs. Individual users may opt for single-user licenses, while businesses requiring broader access may choose multi-user or enterprise licenses for cost-effective access to the report.
13. Are there any additional resources or data provided in the Intraoral Scanners Industry report?
While the report offers comprehensive insights, it's advisable to review the specific contents or supplementary materials provided to ascertain if additional resources or data are available.
14. How can I stay updated on further developments or reports in the Intraoral Scanners Industry?
To stay informed about further developments, trends, and reports in the Intraoral Scanners Industry, consider subscribing to industry newsletters, following relevant companies and organizations, or regularly checking reputable industry news sources and publications.
Methodology
Step 1 - Identification of Relevant Samples Size from Population Database


Step 2 - Approaches for Defining Global Market Size (Value, Volume* & Price*)

Note*: In applicable scenarios
Step 3 - Data Sources
Primary Research
- Web Analytics
- Survey Reports
- Research Institute
- Latest Research Reports
- Opinion Leaders
Secondary Research
- Annual Reports
- White Paper
- Latest Press Release
- Industry Association
- Paid Database
- Investor Presentations

Step 4 - Data Triangulation
Involves using different sources of information in order to increase the validity of a study
These sources are likely to be stakeholders in a program - participants, other researchers, program staff, other community members, and so on.
Then we put all data in single framework & apply various statistical tools to find out the dynamic on the market.
During the analysis stage, feedback from the stakeholder groups would be compared to determine areas of agreement as well as areas of divergence
