

Key Insights
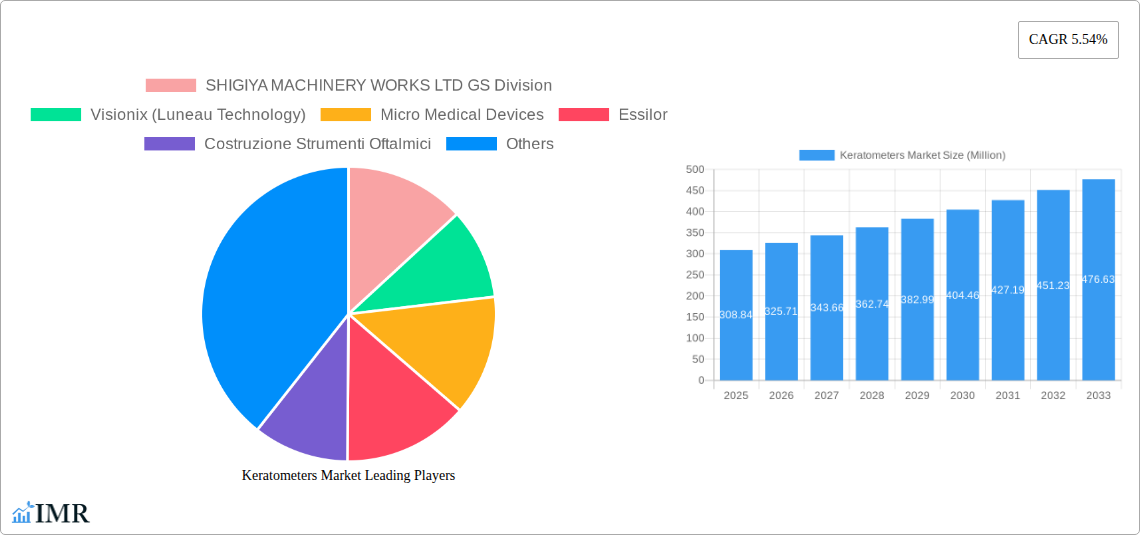
The global keratometers market, valued at $308.84 million in 2025, is projected to experience robust growth, driven by several key factors. Technological advancements leading to the development of more precise and portable keratometers are significantly impacting market expansion. The increasing prevalence of refractive errors globally, coupled with rising awareness about eye health and the growing demand for advanced diagnostic tools in ophthalmology, fuel market expansion. Furthermore, the increasing number of eye clinics and hospitals, particularly in developing economies, contributes to market growth. The market is segmented by type (stationary and portable) and end-user (hospitals, eye clinics, and others), with the portable segment witnessing faster growth due to its convenience and portability, particularly suitable for mobile eye care units and remote areas. Hospitals currently dominate the end-user segment due to their comprehensive diagnostic capabilities and high patient volume.
However, factors such as the high cost of advanced keratometers and the availability of alternative diagnostic techniques can restrain market growth to some extent. The competitive landscape is characterized by a mix of established players like Topcon, Canon, and Zeiss, alongside smaller, specialized manufacturers. These companies are continuously investing in research and development to introduce innovative features like automated measurements, improved accuracy, and integrated data management systems. Geographic expansion, particularly in Asia Pacific and Middle East & Africa regions experiencing rapid economic development and improving healthcare infrastructure, will present lucrative opportunities for market players. The forecast period (2025-2033) anticipates a sustained growth trajectory, fueled by ongoing technological advancements and increasing accessibility to quality eye care services.
This comprehensive report provides a detailed analysis of the Keratometers Market, encompassing market dynamics, growth trends, regional segmentation, product landscape, key players, and future outlook. The study covers the historical period (2019-2024), base year (2025), and forecast period (2025-2033), offering valuable insights for industry professionals, investors, and strategic decision-makers. The market is segmented by type (Stationary Type Keratometers, Portable Type Keratometers) and end-user (Hospitals, Eye Clinics, Others). The total market size is projected to reach xx Million by 2033.
Keratometers Market Dynamics & Structure
The Keratometers Market is characterized by a moderately concentrated landscape with several key players vying for market share. Technological innovation, particularly in areas like automated measurements and improved image processing, is a primary growth driver. Regulatory frameworks, varying across different regions, impact market access and adoption rates. Competitive substitutes, such as advanced imaging technologies, pose a challenge, while the increasing prevalence of refractive errors fuels market demand. The market has witnessed a moderate number of M&A activities in recent years, with xx deals recorded between 2019 and 2024.
- Market Concentration: Moderately concentrated, with top 5 players holding approximately xx% market share (2024).
- Technological Innovation: Focus on improved accuracy, automation, and integration with other ophthalmic devices.
- Regulatory Landscape: Varying regulations across regions impacting market entry and product approvals.
- Competitive Substitutes: Advanced imaging technologies and other diagnostic tools.
- End-User Demographics: Growing aging population and rising prevalence of refractive errors drive demand.
- M&A Activity: xx M&A deals recorded between 2019 and 2024, primarily focused on expansion and technological integration.
Keratometers Market Growth Trends & Insights
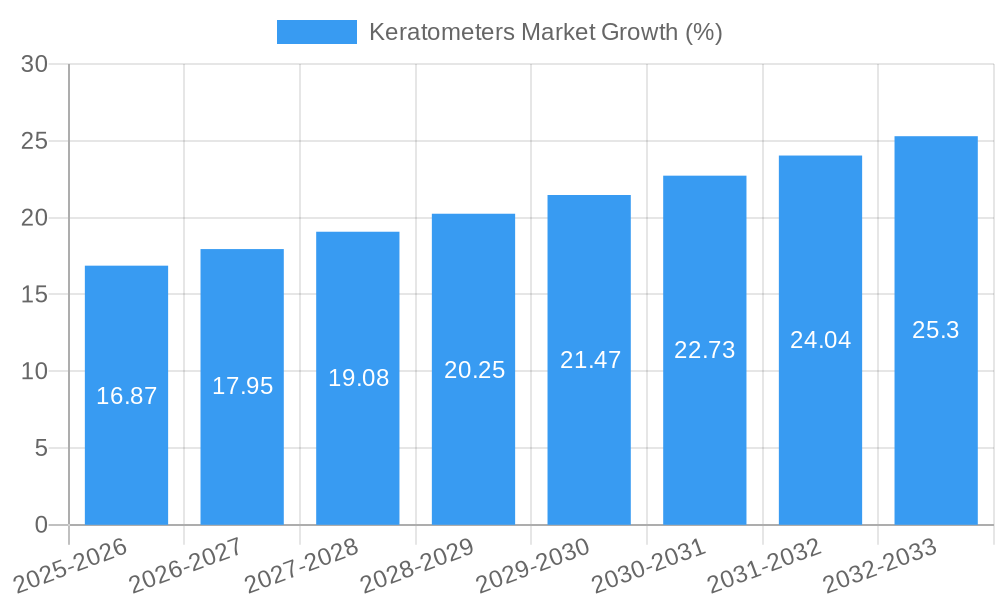
The Keratometers Market exhibits robust growth, driven by factors such as increasing prevalence of refractive errors globally, technological advancements leading to improved accuracy and efficiency of keratometers, and rising healthcare expenditure. The market size is projected to experience a CAGR of xx% during the forecast period (2025-2033), reaching xx Million by 2033. Increased adoption in emerging markets and the integration of keratometry into comprehensive eye examinations contribute significantly to growth. Market penetration is expected to increase from xx% in 2025 to xx% by 2033. Technological disruptions, such as the introduction of Wavefront-guided keratometry systems, are reshaping the market landscape and driving adoption rates.
Dominant Regions, Countries, or Segments in Keratometers Market
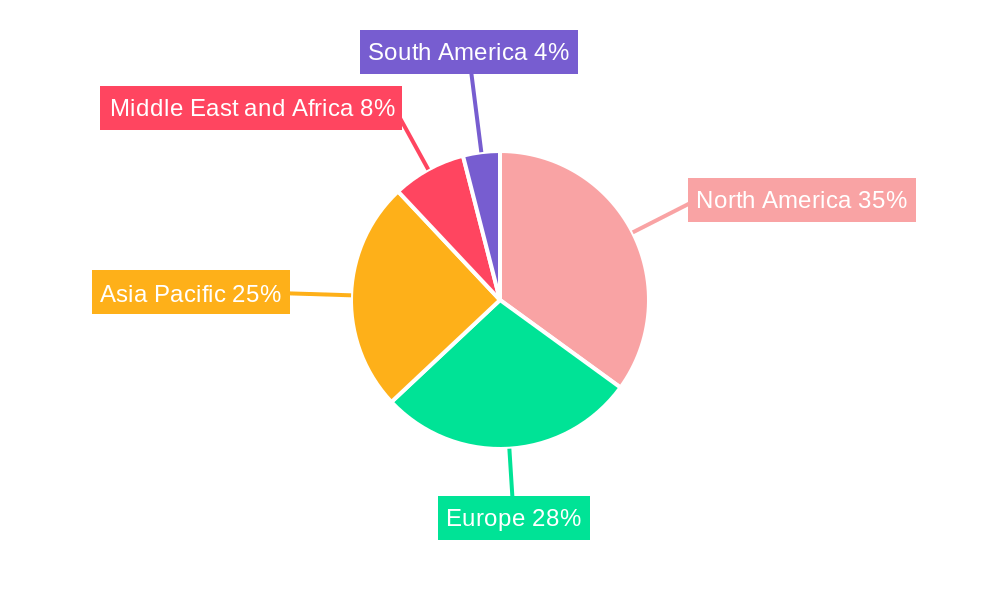
North America currently holds the largest market share, driven by high healthcare expenditure, advanced infrastructure, and a high prevalence of refractive disorders. Within the segments, the Stationary Type Keratometers segment commands a larger share due to its precision and reliability for detailed measurements. However, the Portable Type Keratometers segment is expected to witness faster growth due to its portability and convenience for use in various settings. Hospitals remain the largest end-user segment, though Eye Clinics are demonstrating significant growth potential.
- North America: High healthcare expenditure, advanced infrastructure, and high prevalence of refractive errors contribute to market dominance.
- Europe: Stable market growth driven by increasing healthcare awareness and technological advancements.
- Asia-Pacific: High growth potential due to increasing prevalence of refractive errors and rising healthcare expenditure.
- Stationary Type Keratometers: Largest market segment driven by accuracy and detailed measurements.
- Portable Type Keratometers: Fastest-growing segment due to portability and convenience.
- Hospitals: Largest end-user segment, offering high volumes and consistent demand.
- Eye Clinics: Rapidly growing segment benefiting from increasing patient demand and convenient access.
Keratometers Market Product Landscape
Modern keratometers offer significant improvements in accuracy and speed of measurement, often incorporating advanced features such as automated data analysis and digital image capture. They are crucial for diagnosing refractive errors and guiding treatment decisions, particularly in refractive surgery and contact lens fitting. Unique selling propositions include enhanced accuracy, improved user-friendliness, and integration with other ophthalmic devices. Recent advancements emphasize non-contact measurement techniques to minimize patient discomfort.
Key Drivers, Barriers & Challenges in Keratometers Market
Key Drivers:
- Rising prevalence of myopia and other refractive errors globally.
- Technological advancements leading to increased accuracy and speed of measurement.
- Growing adoption of comprehensive eye examinations incorporating keratometry.
Key Challenges:
- High cost of advanced keratometry systems, limiting market penetration in certain regions.
- Stringent regulatory approvals and compliance requirements can delay product launches.
- Intense competition from established players and emerging market entrants.
Emerging Opportunities in Keratometers Market
- Expansion into underserved markets in developing countries with high refractive error prevalence.
- Development of portable and cost-effective keratometry systems for point-of-care diagnostics.
- Integration with telemedicine platforms for remote eye care and improved accessibility.
Growth Accelerators in the Keratometers Market Industry
Technological advancements in imaging and data analysis are key growth catalysts. Strategic partnerships between device manufacturers and healthcare providers enhance market reach and adoption. Furthermore, expanding market access in developing economies presents significant growth opportunities.
Key Players Shaping the Keratometers Market Market
- SHIGIYA MACHINERY WORKS LTD GS Division
- Visionix (Luneau Technology)
- Micro Medical Devices
- Essilor
- Costruzione Strumenti Oftalmici
- Reichert Inc
- Carl Zeiss AG
- Naugra Medical
- Topcon Corporation
- Canon Medical Systems Corporation
- NIDEK CO LTD
- TOMEY GmbH
Notable Milestones in Keratometers Market Sector
- June 2023: EssilorLuxottica and the World Society of Paediatric Ophthalmology and Strabismus collaborate to advance myopia management education globally. This boosts the demand for accurate keratometry for myopia management.
- March 2023: WaveFront Dynamics Inc. launches the WaveDyn Vision Analyzer, a dynamic aberrometry system with keratometry capabilities, expanding the applications of keratometry.
In-Depth Keratometers Market Market Outlook
The Keratometers Market is poised for continued growth, driven by technological innovation, expanding applications, and increasing awareness of refractive errors. Strategic partnerships and expansion into new markets will further fuel this growth, presenting attractive opportunities for both established players and new entrants. The future holds promise for more compact, integrated, and user-friendly keratometry systems that will enhance accessibility and affordability.
Keratometers Market Segmentation
-
1. Type
- 1.1. Stationary Type Keratometers
- 1.2. Portable Type Keratometers
-
2. End User
- 2.1. Hospitals
- 2.2. Eye Clinics
- 2.3. Others
Keratometers Market Segmentation By Geography
-
1. North America
- 1.1. United States
- 1.2. Canada
- 1.3. Mexico
-
2. Europe
- 2.1. Germany
- 2.2. United Kingdom
- 2.3. France
- 2.4. Italy
- 2.5. Spain
- 2.6. Rest of Europe
-
3. Asia Pacific
- 3.1. China
- 3.2. Japan
- 3.3. India
- 3.4. Australia
- 3.5. South Korea
- 3.6. Rest of Asia Pacific
-
4. Middle East and Africa
- 4.1. GCC
- 4.2. South Africa
- 4.3. Rest of Middle East and Africa
-
5. South America
- 5.1. Brazil
- 5.2. Argentina
- 5.3. Rest of South America
Keratometers Market REPORT HIGHLIGHTS
| Aspects | Details |
|---|---|
| Study Period | 2019-2033 |
| Base Year | 2024 |
| Estimated Year | 2025 |
| Forecast Period | 2025-2033 |
| Historical Period | 2019-2024 |
| Growth Rate | CAGR of 5.54% from 2019-2033 |
| Segmentation |
|
Table of Contents
- 1. Introduction
- 1.1. Research Scope
- 1.2. Market Segmentation
- 1.3. Research Methodology
- 1.4. Definitions and Assumptions
- 2. Executive Summary
- 2.1. Introduction
- 3. Market Dynamics
- 3.1. Introduction
- 3.2. Market Drivers
- 3.2.1 Increasing Burden of Eye Disorders; Growing Investments
- 3.2.2 Funds
- 3.2.3 and Grants on Eye Care Devices
- 3.3. Market Restrains
- 3.3.1. Lack of Primary Infrastructure For Eye Related Diseases in Underdeveloped and Developing Countries
- 3.4. Market Trends
- 3.4.1. Hospitals are Expected to Hold a Significant Market Share Over the Forecast Period
- 4. Market Factor Analysis
- 4.1. Porters Five Forces
- 4.2. Supply/Value Chain
- 4.3. PESTEL analysis
- 4.4. Market Entropy
- 4.5. Patent/Trademark Analysis
- 5. Global Keratometers Market Analysis, Insights and Forecast, 2019-2031
- 5.1. Market Analysis, Insights and Forecast - by Type
- 5.1.1. Stationary Type Keratometers
- 5.1.2. Portable Type Keratometers
- 5.2. Market Analysis, Insights and Forecast - by End User
- 5.2.1. Hospitals
- 5.2.2. Eye Clinics
- 5.2.3. Others
- 5.3. Market Analysis, Insights and Forecast - by Region
- 5.3.1. North America
- 5.3.2. Europe
- 5.3.3. Asia Pacific
- 5.3.4. Middle East and Africa
- 5.3.5. South America
- 5.1. Market Analysis, Insights and Forecast - by Type
- 6. North America Keratometers Market Analysis, Insights and Forecast, 2019-2031
- 6.1. Market Analysis, Insights and Forecast - by Type
- 6.1.1. Stationary Type Keratometers
- 6.1.2. Portable Type Keratometers
- 6.2. Market Analysis, Insights and Forecast - by End User
- 6.2.1. Hospitals
- 6.2.2. Eye Clinics
- 6.2.3. Others
- 6.1. Market Analysis, Insights and Forecast - by Type
- 7. Europe Keratometers Market Analysis, Insights and Forecast, 2019-2031
- 7.1. Market Analysis, Insights and Forecast - by Type
- 7.1.1. Stationary Type Keratometers
- 7.1.2. Portable Type Keratometers
- 7.2. Market Analysis, Insights and Forecast - by End User
- 7.2.1. Hospitals
- 7.2.2. Eye Clinics
- 7.2.3. Others
- 7.1. Market Analysis, Insights and Forecast - by Type
- 8. Asia Pacific Keratometers Market Analysis, Insights and Forecast, 2019-2031
- 8.1. Market Analysis, Insights and Forecast - by Type
- 8.1.1. Stationary Type Keratometers
- 8.1.2. Portable Type Keratometers
- 8.2. Market Analysis, Insights and Forecast - by End User
- 8.2.1. Hospitals
- 8.2.2. Eye Clinics
- 8.2.3. Others
- 8.1. Market Analysis, Insights and Forecast - by Type
- 9. Middle East and Africa Keratometers Market Analysis, Insights and Forecast, 2019-2031
- 9.1. Market Analysis, Insights and Forecast - by Type
- 9.1.1. Stationary Type Keratometers
- 9.1.2. Portable Type Keratometers
- 9.2. Market Analysis, Insights and Forecast - by End User
- 9.2.1. Hospitals
- 9.2.2. Eye Clinics
- 9.2.3. Others
- 9.1. Market Analysis, Insights and Forecast - by Type
- 10. South America Keratometers Market Analysis, Insights and Forecast, 2019-2031
- 10.1. Market Analysis, Insights and Forecast - by Type
- 10.1.1. Stationary Type Keratometers
- 10.1.2. Portable Type Keratometers
- 10.2. Market Analysis, Insights and Forecast - by End User
- 10.2.1. Hospitals
- 10.2.2. Eye Clinics
- 10.2.3. Others
- 10.1. Market Analysis, Insights and Forecast - by Type
- 11. North America Keratometers Market Analysis, Insights and Forecast, 2019-2031
- 11.1. Market Analysis, Insights and Forecast - By Country/Sub-region
- 11.1.1 United States
- 11.1.2 Canada
- 11.1.3 Mexico
- 12. Europe Keratometers Market Analysis, Insights and Forecast, 2019-2031
- 12.1. Market Analysis, Insights and Forecast - By Country/Sub-region
- 12.1.1 Germany
- 12.1.2 United Kingdom
- 12.1.3 France
- 12.1.4 Italy
- 12.1.5 Spain
- 12.1.6 Rest of Europe
- 13. Asia Pacific Keratometers Market Analysis, Insights and Forecast, 2019-2031
- 13.1. Market Analysis, Insights and Forecast - By Country/Sub-region
- 13.1.1 China
- 13.1.2 Japan
- 13.1.3 India
- 13.1.4 Australia
- 13.1.5 South Korea
- 13.1.6 Rest of Asia Pacific
- 14. Middle East and Africa Keratometers Market Analysis, Insights and Forecast, 2019-2031
- 14.1. Market Analysis, Insights and Forecast - By Country/Sub-region
- 14.1.1 GCC
- 14.1.2 South Africa
- 14.1.3 Rest of Middle East and Africa
- 15. South America Keratometers Market Analysis, Insights and Forecast, 2019-2031
- 15.1. Market Analysis, Insights and Forecast - By Country/Sub-region
- 15.1.1 Brazil
- 15.1.2 Argentina
- 15.1.3 Rest of South America
- 16. Competitive Analysis
- 16.1. Global Market Share Analysis 2024
- 16.2. Company Profiles
- 16.2.1 SHIGIYA MACHINERY WORKS LTD GS Division
- 16.2.1.1. Overview
- 16.2.1.2. Products
- 16.2.1.3. SWOT Analysis
- 16.2.1.4. Recent Developments
- 16.2.1.5. Financials (Based on Availability)
- 16.2.2 Visionix (Luneau Technology)
- 16.2.2.1. Overview
- 16.2.2.2. Products
- 16.2.2.3. SWOT Analysis
- 16.2.2.4. Recent Developments
- 16.2.2.5. Financials (Based on Availability)
- 16.2.3 Micro Medical Devices
- 16.2.3.1. Overview
- 16.2.3.2. Products
- 16.2.3.3. SWOT Analysis
- 16.2.3.4. Recent Developments
- 16.2.3.5. Financials (Based on Availability)
- 16.2.4 Essilor
- 16.2.4.1. Overview
- 16.2.4.2. Products
- 16.2.4.3. SWOT Analysis
- 16.2.4.4. Recent Developments
- 16.2.4.5. Financials (Based on Availability)
- 16.2.5 Costruzione Strumenti Oftalmici
- 16.2.5.1. Overview
- 16.2.5.2. Products
- 16.2.5.3. SWOT Analysis
- 16.2.5.4. Recent Developments
- 16.2.5.5. Financials (Based on Availability)
- 16.2.6 Reichert Inc
- 16.2.6.1. Overview
- 16.2.6.2. Products
- 16.2.6.3. SWOT Analysis
- 16.2.6.4. Recent Developments
- 16.2.6.5. Financials (Based on Availability)
- 16.2.7 Carl Zeiss AG
- 16.2.7.1. Overview
- 16.2.7.2. Products
- 16.2.7.3. SWOT Analysis
- 16.2.7.4. Recent Developments
- 16.2.7.5. Financials (Based on Availability)
- 16.2.8 Naugra Medical
- 16.2.8.1. Overview
- 16.2.8.2. Products
- 16.2.8.3. SWOT Analysis
- 16.2.8.4. Recent Developments
- 16.2.8.5. Financials (Based on Availability)
- 16.2.9 Topcon Corporation
- 16.2.9.1. Overview
- 16.2.9.2. Products
- 16.2.9.3. SWOT Analysis
- 16.2.9.4. Recent Developments
- 16.2.9.5. Financials (Based on Availability)
- 16.2.10 Canon Medical Systems Corporation*List Not Exhaustive
- 16.2.10.1. Overview
- 16.2.10.2. Products
- 16.2.10.3. SWOT Analysis
- 16.2.10.4. Recent Developments
- 16.2.10.5. Financials (Based on Availability)
- 16.2.11 NIDEK CO LTD
- 16.2.11.1. Overview
- 16.2.11.2. Products
- 16.2.11.3. SWOT Analysis
- 16.2.11.4. Recent Developments
- 16.2.11.5. Financials (Based on Availability)
- 16.2.12 TOMEY GmbH
- 16.2.12.1. Overview
- 16.2.12.2. Products
- 16.2.12.3. SWOT Analysis
- 16.2.12.4. Recent Developments
- 16.2.12.5. Financials (Based on Availability)
- 16.2.1 SHIGIYA MACHINERY WORKS LTD GS Division
List of Figures
- Figure 1: Global Keratometers Market Revenue Breakdown (Million, %) by Region 2024 & 2032
- Figure 2: North America Keratometers Market Revenue (Million), by Country 2024 & 2032
- Figure 3: North America Keratometers Market Revenue Share (%), by Country 2024 & 2032
- Figure 4: Europe Keratometers Market Revenue (Million), by Country 2024 & 2032
- Figure 5: Europe Keratometers Market Revenue Share (%), by Country 2024 & 2032
- Figure 6: Asia Pacific Keratometers Market Revenue (Million), by Country 2024 & 2032
- Figure 7: Asia Pacific Keratometers Market Revenue Share (%), by Country 2024 & 2032
- Figure 8: Middle East and Africa Keratometers Market Revenue (Million), by Country 2024 & 2032
- Figure 9: Middle East and Africa Keratometers Market Revenue Share (%), by Country 2024 & 2032
- Figure 10: South America Keratometers Market Revenue (Million), by Country 2024 & 2032
- Figure 11: South America Keratometers Market Revenue Share (%), by Country 2024 & 2032
- Figure 12: North America Keratometers Market Revenue (Million), by Type 2024 & 2032
- Figure 13: North America Keratometers Market Revenue Share (%), by Type 2024 & 2032
- Figure 14: North America Keratometers Market Revenue (Million), by End User 2024 & 2032
- Figure 15: North America Keratometers Market Revenue Share (%), by End User 2024 & 2032
- Figure 16: North America Keratometers Market Revenue (Million), by Country 2024 & 2032
- Figure 17: North America Keratometers Market Revenue Share (%), by Country 2024 & 2032
- Figure 18: Europe Keratometers Market Revenue (Million), by Type 2024 & 2032
- Figure 19: Europe Keratometers Market Revenue Share (%), by Type 2024 & 2032
- Figure 20: Europe Keratometers Market Revenue (Million), by End User 2024 & 2032
- Figure 21: Europe Keratometers Market Revenue Share (%), by End User 2024 & 2032
- Figure 22: Europe Keratometers Market Revenue (Million), by Country 2024 & 2032
- Figure 23: Europe Keratometers Market Revenue Share (%), by Country 2024 & 2032
- Figure 24: Asia Pacific Keratometers Market Revenue (Million), by Type 2024 & 2032
- Figure 25: Asia Pacific Keratometers Market Revenue Share (%), by Type 2024 & 2032
- Figure 26: Asia Pacific Keratometers Market Revenue (Million), by End User 2024 & 2032
- Figure 27: Asia Pacific Keratometers Market Revenue Share (%), by End User 2024 & 2032
- Figure 28: Asia Pacific Keratometers Market Revenue (Million), by Country 2024 & 2032
- Figure 29: Asia Pacific Keratometers Market Revenue Share (%), by Country 2024 & 2032
- Figure 30: Middle East and Africa Keratometers Market Revenue (Million), by Type 2024 & 2032
- Figure 31: Middle East and Africa Keratometers Market Revenue Share (%), by Type 2024 & 2032
- Figure 32: Middle East and Africa Keratometers Market Revenue (Million), by End User 2024 & 2032
- Figure 33: Middle East and Africa Keratometers Market Revenue Share (%), by End User 2024 & 2032
- Figure 34: Middle East and Africa Keratometers Market Revenue (Million), by Country 2024 & 2032
- Figure 35: Middle East and Africa Keratometers Market Revenue Share (%), by Country 2024 & 2032
- Figure 36: South America Keratometers Market Revenue (Million), by Type 2024 & 2032
- Figure 37: South America Keratometers Market Revenue Share (%), by Type 2024 & 2032
- Figure 38: South America Keratometers Market Revenue (Million), by End User 2024 & 2032
- Figure 39: South America Keratometers Market Revenue Share (%), by End User 2024 & 2032
- Figure 40: South America Keratometers Market Revenue (Million), by Country 2024 & 2032
- Figure 41: South America Keratometers Market Revenue Share (%), by Country 2024 & 2032
List of Tables
- Table 1: Global Keratometers Market Revenue Million Forecast, by Region 2019 & 2032
- Table 2: Global Keratometers Market Revenue Million Forecast, by Type 2019 & 2032
- Table 3: Global Keratometers Market Revenue Million Forecast, by End User 2019 & 2032
- Table 4: Global Keratometers Market Revenue Million Forecast, by Region 2019 & 2032
- Table 5: Global Keratometers Market Revenue Million Forecast, by Country 2019 & 2032
- Table 6: United States Keratometers Market Revenue (Million) Forecast, by Application 2019 & 2032
- Table 7: Canada Keratometers Market Revenue (Million) Forecast, by Application 2019 & 2032
- Table 8: Mexico Keratometers Market Revenue (Million) Forecast, by Application 2019 & 2032
- Table 9: Global Keratometers Market Revenue Million Forecast, by Country 2019 & 2032
- Table 10: Germany Keratometers Market Revenue (Million) Forecast, by Application 2019 & 2032
- Table 11: United Kingdom Keratometers Market Revenue (Million) Forecast, by Application 2019 & 2032
- Table 12: France Keratometers Market Revenue (Million) Forecast, by Application 2019 & 2032
- Table 13: Italy Keratometers Market Revenue (Million) Forecast, by Application 2019 & 2032
- Table 14: Spain Keratometers Market Revenue (Million) Forecast, by Application 2019 & 2032
- Table 15: Rest of Europe Keratometers Market Revenue (Million) Forecast, by Application 2019 & 2032
- Table 16: Global Keratometers Market Revenue Million Forecast, by Country 2019 & 2032
- Table 17: China Keratometers Market Revenue (Million) Forecast, by Application 2019 & 2032
- Table 18: Japan Keratometers Market Revenue (Million) Forecast, by Application 2019 & 2032
- Table 19: India Keratometers Market Revenue (Million) Forecast, by Application 2019 & 2032
- Table 20: Australia Keratometers Market Revenue (Million) Forecast, by Application 2019 & 2032
- Table 21: South Korea Keratometers Market Revenue (Million) Forecast, by Application 2019 & 2032
- Table 22: Rest of Asia Pacific Keratometers Market Revenue (Million) Forecast, by Application 2019 & 2032
- Table 23: Global Keratometers Market Revenue Million Forecast, by Country 2019 & 2032
- Table 24: GCC Keratometers Market Revenue (Million) Forecast, by Application 2019 & 2032
- Table 25: South Africa Keratometers Market Revenue (Million) Forecast, by Application 2019 & 2032
- Table 26: Rest of Middle East and Africa Keratometers Market Revenue (Million) Forecast, by Application 2019 & 2032
- Table 27: Global Keratometers Market Revenue Million Forecast, by Country 2019 & 2032
- Table 28: Brazil Keratometers Market Revenue (Million) Forecast, by Application 2019 & 2032
- Table 29: Argentina Keratometers Market Revenue (Million) Forecast, by Application 2019 & 2032
- Table 30: Rest of South America Keratometers Market Revenue (Million) Forecast, by Application 2019 & 2032
- Table 31: Global Keratometers Market Revenue Million Forecast, by Type 2019 & 2032
- Table 32: Global Keratometers Market Revenue Million Forecast, by End User 2019 & 2032
- Table 33: Global Keratometers Market Revenue Million Forecast, by Country 2019 & 2032
- Table 34: United States Keratometers Market Revenue (Million) Forecast, by Application 2019 & 2032
- Table 35: Canada Keratometers Market Revenue (Million) Forecast, by Application 2019 & 2032
- Table 36: Mexico Keratometers Market Revenue (Million) Forecast, by Application 2019 & 2032
- Table 37: Global Keratometers Market Revenue Million Forecast, by Type 2019 & 2032
- Table 38: Global Keratometers Market Revenue Million Forecast, by End User 2019 & 2032
- Table 39: Global Keratometers Market Revenue Million Forecast, by Country 2019 & 2032
- Table 40: Germany Keratometers Market Revenue (Million) Forecast, by Application 2019 & 2032
- Table 41: United Kingdom Keratometers Market Revenue (Million) Forecast, by Application 2019 & 2032
- Table 42: France Keratometers Market Revenue (Million) Forecast, by Application 2019 & 2032
- Table 43: Italy Keratometers Market Revenue (Million) Forecast, by Application 2019 & 2032
- Table 44: Spain Keratometers Market Revenue (Million) Forecast, by Application 2019 & 2032
- Table 45: Rest of Europe Keratometers Market Revenue (Million) Forecast, by Application 2019 & 2032
- Table 46: Global Keratometers Market Revenue Million Forecast, by Type 2019 & 2032
- Table 47: Global Keratometers Market Revenue Million Forecast, by End User 2019 & 2032
- Table 48: Global Keratometers Market Revenue Million Forecast, by Country 2019 & 2032
- Table 49: China Keratometers Market Revenue (Million) Forecast, by Application 2019 & 2032
- Table 50: Japan Keratometers Market Revenue (Million) Forecast, by Application 2019 & 2032
- Table 51: India Keratometers Market Revenue (Million) Forecast, by Application 2019 & 2032
- Table 52: Australia Keratometers Market Revenue (Million) Forecast, by Application 2019 & 2032
- Table 53: South Korea Keratometers Market Revenue (Million) Forecast, by Application 2019 & 2032
- Table 54: Rest of Asia Pacific Keratometers Market Revenue (Million) Forecast, by Application 2019 & 2032
- Table 55: Global Keratometers Market Revenue Million Forecast, by Type 2019 & 2032
- Table 56: Global Keratometers Market Revenue Million Forecast, by End User 2019 & 2032
- Table 57: Global Keratometers Market Revenue Million Forecast, by Country 2019 & 2032
- Table 58: GCC Keratometers Market Revenue (Million) Forecast, by Application 2019 & 2032
- Table 59: South Africa Keratometers Market Revenue (Million) Forecast, by Application 2019 & 2032
- Table 60: Rest of Middle East and Africa Keratometers Market Revenue (Million) Forecast, by Application 2019 & 2032
- Table 61: Global Keratometers Market Revenue Million Forecast, by Type 2019 & 2032
- Table 62: Global Keratometers Market Revenue Million Forecast, by End User 2019 & 2032
- Table 63: Global Keratometers Market Revenue Million Forecast, by Country 2019 & 2032
- Table 64: Brazil Keratometers Market Revenue (Million) Forecast, by Application 2019 & 2032
- Table 65: Argentina Keratometers Market Revenue (Million) Forecast, by Application 2019 & 2032
- Table 66: Rest of South America Keratometers Market Revenue (Million) Forecast, by Application 2019 & 2032
Frequently Asked Questions
1. What is the projected Compound Annual Growth Rate (CAGR) of the Keratometers Market?
The projected CAGR is approximately 5.54%.
2. Which companies are prominent players in the Keratometers Market?
Key companies in the market include SHIGIYA MACHINERY WORKS LTD GS Division, Visionix (Luneau Technology), Micro Medical Devices, Essilor, Costruzione Strumenti Oftalmici, Reichert Inc, Carl Zeiss AG, Naugra Medical, Topcon Corporation, Canon Medical Systems Corporation*List Not Exhaustive, NIDEK CO LTD, TOMEY GmbH.
3. What are the main segments of the Keratometers Market?
The market segments include Type, End User.
4. Can you provide details about the market size?
The market size is estimated to be USD 308.84 Million as of 2022.
5. What are some drivers contributing to market growth?
Increasing Burden of Eye Disorders; Growing Investments. Funds. and Grants on Eye Care Devices.
6. What are the notable trends driving market growth?
Hospitals are Expected to Hold a Significant Market Share Over the Forecast Period.
7. Are there any restraints impacting market growth?
Lack of Primary Infrastructure For Eye Related Diseases in Underdeveloped and Developing Countries.
8. Can you provide examples of recent developments in the market?
June 2023: EssilorLuxottica and the World Society of Paediatric Ophthalmology and Strabismus collaborated to advance knowledge and education of myopia management globally. This collaboration is expected to contribute to educating further and help eye care professionals successfully integrate myopia management in practice and guide their patients on how to manage their myopia.
9. What pricing options are available for accessing the report?
Pricing options include single-user, multi-user, and enterprise licenses priced at USD 4750, USD 5250, and USD 8750 respectively.
10. Is the market size provided in terms of value or volume?
The market size is provided in terms of value, measured in Million.
11. Are there any specific market keywords associated with the report?
Yes, the market keyword associated with the report is "Keratometers Market," which aids in identifying and referencing the specific market segment covered.
12. How do I determine which pricing option suits my needs best?
The pricing options vary based on user requirements and access needs. Individual users may opt for single-user licenses, while businesses requiring broader access may choose multi-user or enterprise licenses for cost-effective access to the report.
13. Are there any additional resources or data provided in the Keratometers Market report?
While the report offers comprehensive insights, it's advisable to review the specific contents or supplementary materials provided to ascertain if additional resources or data are available.
14. How can I stay updated on further developments or reports in the Keratometers Market?
To stay informed about further developments, trends, and reports in the Keratometers Market, consider subscribing to industry newsletters, following relevant companies and organizations, or regularly checking reputable industry news sources and publications.
Methodology
Step 1 - Identification of Relevant Samples Size from Population Database


Step 2 - Approaches for Defining Global Market Size (Value, Volume* & Price*)

Note*: In applicable scenarios
Step 3 - Data Sources
Primary Research
- Web Analytics
- Survey Reports
- Research Institute
- Latest Research Reports
- Opinion Leaders
Secondary Research
- Annual Reports
- White Paper
- Latest Press Release
- Industry Association
- Paid Database
- Investor Presentations

Step 4 - Data Triangulation
Involves using different sources of information in order to increase the validity of a study
These sources are likely to be stakeholders in a program - participants, other researchers, program staff, other community members, and so on.
Then we put all data in single framework & apply various statistical tools to find out the dynamic on the market.
During the analysis stage, feedback from the stakeholder groups would be compared to determine areas of agreement as well as areas of divergence
