

Key Insights
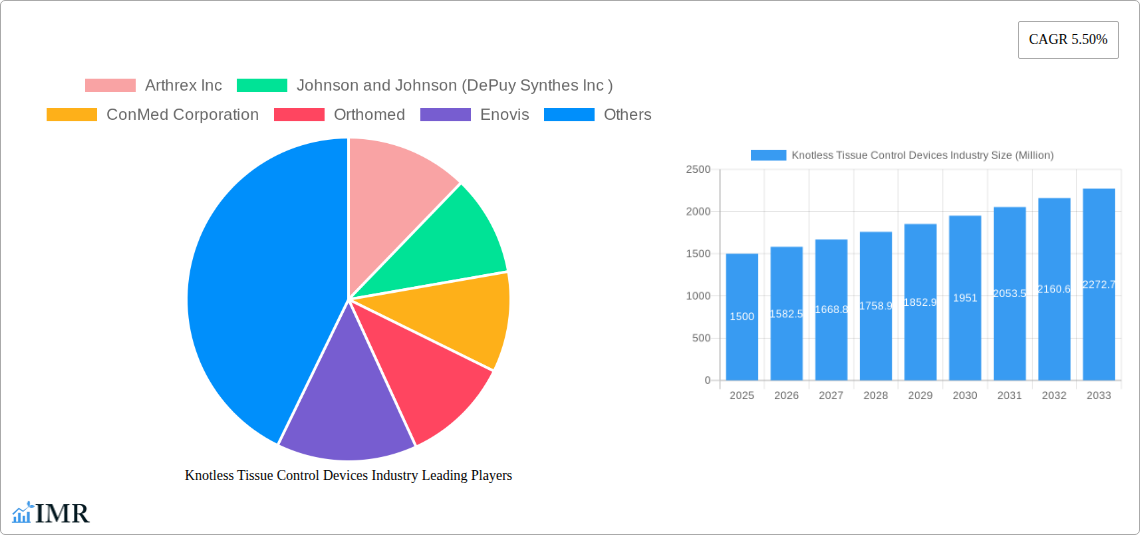
The global knotless tissue control devices market, currently experiencing robust growth, is projected to maintain a steady Compound Annual Growth Rate (CAGR) of 5.50% from 2025 to 2033. This expansion is driven primarily by the increasing prevalence of minimally invasive surgical procedures, a growing elderly population requiring more surgical interventions, and the rising demand for faster recovery times and reduced post-operative complications. The shift towards knotless techniques offers significant advantages including reduced surgical time, improved precision, and decreased risk of complications associated with knot tying, thereby fueling market growth. Further contributing to market expansion are technological advancements in biocompatible materials and improved device designs, resulting in enhanced efficacy and patient outcomes. Key segments within the market, including absorbable and non-absorbable suture anchors, metallic and bio-absorbable materials, and knotted and knotless tying mechanisms, present diverse opportunities for manufacturers to cater to specific surgical needs.
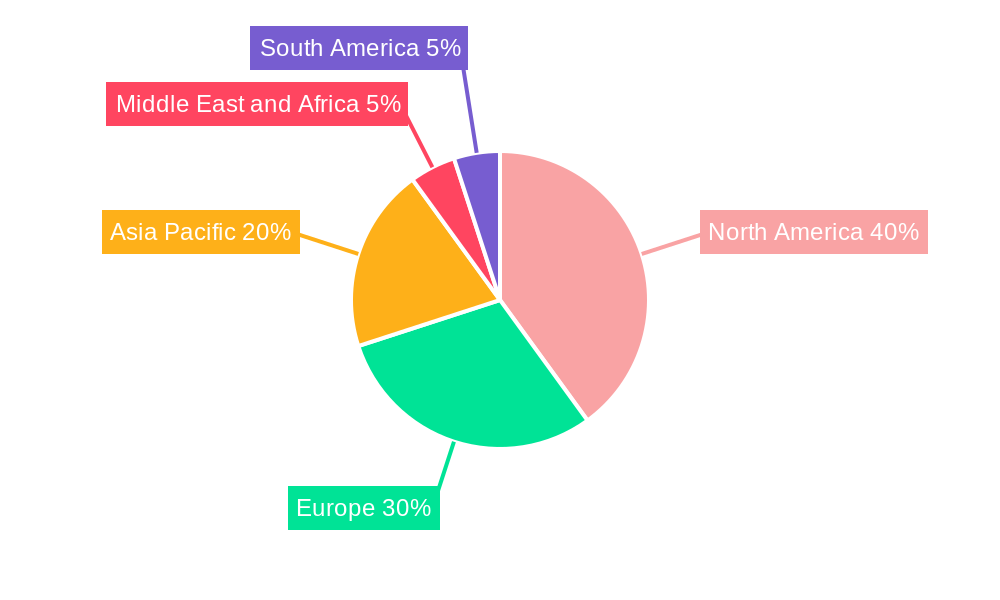
While the market exhibits considerable promise, certain restraints exist. The relatively high cost of advanced knotless devices compared to traditional knotted techniques may limit adoption in resource-constrained settings. Furthermore, the market's growth is somewhat dependent on ongoing research and development to address potential limitations and improve the long-term efficacy of these devices. Despite these challenges, the continuing trend toward minimally invasive surgery and the benefits of improved patient outcomes are expected to overcome these limitations, leading to sustained market growth throughout the forecast period. Competitive landscape analysis reveals a mix of established players like Johnson & Johnson, Arthrex, and Stryker alongside emerging companies vying for market share, suggesting a dynamic and competitive environment in the foreseeable future. The geographic distribution of market share reflects strong growth in North America and Europe, with Asia-Pacific emerging as a significant growth region due to increasing healthcare infrastructure development and rising surgical volumes.
Knotless Tissue Control Devices Market Report: 2019-2033
This comprehensive report provides a detailed analysis of the global Knotless Tissue Control Devices market, encompassing its dynamics, growth trends, regional segmentation, product landscape, and key players. The study period covers 2019-2033, with 2025 as the base and estimated year. The report offers invaluable insights for industry professionals, investors, and strategic decision-makers seeking to navigate this rapidly evolving market. The parent market is Surgical Devices and the child market is Tissue Control Devices.
Knotless Tissue Control Devices Industry Market Dynamics & Structure
This section analyzes the market's competitive landscape, technological advancements, regulatory influences, and market trends. The Knotless Tissue Control Devices market, valued at xx Million units in 2025, is characterized by moderate concentration, with key players holding significant market share. Technological innovation, particularly in bio-absorbable materials and minimally invasive surgical techniques, is a major driver. Stringent regulatory approvals and increasing healthcare expenditure are further influencing market growth. The competitive landscape includes both established players and emerging companies developing innovative products. Substitutes include traditional knotted sutures, but the growing preference for minimally invasive procedures fuels demand for knotless devices.
- Market Concentration: Moderately concentrated, with top 5 players holding approximately xx% market share in 2025.
- Technological Innovation: Focus on biocompatible materials, improved device design for ease of use, and enhanced tissue fixation.
- Regulatory Framework: Stringent regulatory approvals (e.g., FDA clearance for new devices) impacting market entry and growth.
- Competitive Substitutes: Traditional knotted sutures, but their limitations drive a shift towards knotless alternatives.
- End-User Demographics: Primarily hospitals and surgical centers, with increasing adoption in ambulatory surgical centers.
- M&A Trends: Moderate M&A activity observed in the historical period (2019-2024), with xx deals recorded, driven by the desire to expand product portfolios and market reach.
Knotless Tissue Control Devices Industry Growth Trends & Insights
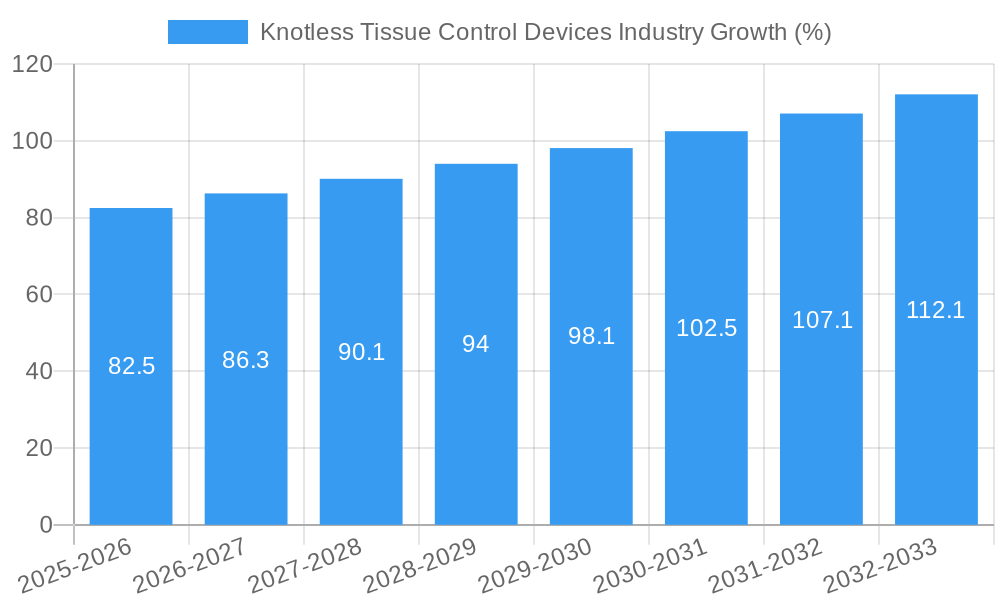
The global Knotless Tissue Control Devices market exhibits robust growth, driven by the increasing adoption of minimally invasive surgical procedures, a growing geriatric population requiring more surgeries, and technological advancements. The market size expanded from xx Million units in 2019 to xx Million units in 2024, exhibiting a CAGR of xx%. The forecast period (2025-2033) projects continued growth, reaching xx Million units by 2033, with a projected CAGR of xx%. This growth is fueled by the increasing preference for knotless devices due to their reduced procedural time, improved precision, and lower complication rates. Consumer behavior trends indicate a preference for minimally invasive procedures and faster recovery times, driving the demand for technologically advanced knotless tissue control devices. Technological disruptions, such as the development of smart sutures with integrated sensors, are anticipated to further accelerate market expansion.
Dominant Regions, Countries, or Segments in Knotless Tissue Control Devices Industry
North America currently dominates the Knotless Tissue Control Devices market, accounting for approximately xx% of the global market share in 2025, followed by Europe and Asia Pacific. This dominance is attributed to higher healthcare expenditure, advanced medical infrastructure, and a high prevalence of orthopedic and surgical procedures. Within product types, the non-absorbable segment holds the largest market share due to its durability and reliability. The metallic suture anchor segment dominates the material type category, offering superior strength and fixation. The knotless tying type is experiencing significant growth, surpassing the knotted segment in terms of market share and growth rate due to its advantages in ease of use and reduced surgical time.
- Key Drivers for North America: High healthcare expenditure, advanced medical infrastructure, and high adoption of minimally invasive surgical techniques.
- Key Drivers for Europe: Growing geriatric population, increasing prevalence of chronic diseases, and supportive healthcare policies.
- Key Drivers for Asia Pacific: Rising disposable incomes, improving healthcare infrastructure, and increasing awareness about advanced surgical techniques.
- Dominant Segment (Product Type): Non-Absorbable, driven by the need for long-term tissue fixation.
- Dominant Segment (Material Type): Metallic Suture Anchor, due to its strength and reliability.
- Dominant Segment (Tying Type): Knotless, owing to its advantages in ease of use, reduced surgical time, and improved precision.
Knotless Tissue Control Devices Industry Product Landscape
The Knotless Tissue Control Devices market offers a range of products varying in material, design, and application. Innovations focus on bio-absorbable materials, enhanced grip strength, and improved ease of deployment during surgery. Product advancements include the incorporation of radiopaque markers for improved visualization during procedures and the development of devices designed for specific anatomical locations. Key selling propositions include reduced surgical time, improved precision, and enhanced tissue fixation, leading to faster patient recovery and improved clinical outcomes. Technological advancements continue to drive improvements in material science, device design, and surgical techniques.
Key Drivers, Barriers & Challenges in Knotless Tissue Control Devices Industry
Key Drivers: The increasing prevalence of minimally invasive surgeries, the growing geriatric population, technological advancements in material science and device design, and rising healthcare expenditure are key drivers of market growth. Government initiatives promoting advanced surgical techniques and the adoption of improved medical devices also contribute significantly.
Key Barriers & Challenges: Stringent regulatory approvals create hurdles for new market entrants. High manufacturing costs and the complexity of device design can limit market penetration. Competition from established players with extensive product portfolios and brand recognition poses a significant challenge. Supply chain disruptions, especially in the sourcing of raw materials, can impact device production and market availability.
Emerging Opportunities in Knotless Tissue Control Devices Industry
Untapped markets in emerging economies, particularly in Asia Pacific and Latin America, present significant growth opportunities. The development of bio-absorbable devices with enhanced biocompatibility and improved degradation profiles offers promising avenues for market expansion. The integration of smart technologies, such as sensors and data analytics, into knotless devices can unlock new functionalities and enhance surgical precision. Furthermore, exploring new applications beyond traditional orthopedic and soft tissue surgeries could significantly expand the market reach of these devices.
Growth Accelerators in the Knotless Tissue Control Devices Industry
Technological breakthroughs in materials science, particularly the development of advanced bio-absorbable polymers, will continue to propel market growth. Strategic collaborations and partnerships between device manufacturers and research institutions can accelerate innovation and facilitate faster product development cycles. Expansion into new geographical markets, especially in developing economies, and the strategic development of specialized devices for niche applications are anticipated to drive long-term growth.
Key Players Shaping the Knotless Tissue Control Devices Market
- Arthrex Inc
- Johnson and Johnson (DePuy Synthes Inc)
- ConMed Corporation
- Orthomed
- Enovis
- Parcus Medical LLC
- Zimmer Biomet Holdings
- Stryker Corporation
- Teknimed
- Smith & Nephew plc
- Wright Medical
- Medtronic plc
Notable Milestones in Knotless Tissue Control Devices Industry Sector
- 2020: Introduction of a new bio-absorbable knotless suture anchor by Arthrex Inc.
- 2021: Strategic partnership between Zimmer Biomet and a leading research institution for the development of innovative knotless devices.
- 2022: FDA clearance for a novel knotless device by Stryker Corporation.
- 2023: Acquisition of a smaller knotless device manufacturer by Johnson & Johnson.
- 2024: Launch of a new line of knotless devices with improved ergonomics by ConMed Corporation.
In-Depth Knotless Tissue Control Devices Industry Market Outlook
The future of the Knotless Tissue Control Devices market looks promising, driven by sustained technological innovation, expansion into new markets, and the increasing adoption of minimally invasive surgical procedures. Strategic partnerships and collaborations within the industry will further accelerate product development and market penetration. Companies focusing on delivering high-quality, innovative devices tailored to specific surgical needs are poised for significant growth. The market's long-term potential is substantial, with significant opportunities for expansion in emerging markets and the development of sophisticated, technologically advanced devices.
Knotless Tissue Control Devices Industry Segmentation
-
1. Product Type
- 1.1. Absorbable
- 1.2. Non-Absorbable
-
2. Material Type
- 2.1. Metallic Suture Anchor
- 2.2. Bio-absorbable Suture Anchor
- 2.3. Others
-
3. Tying Type
- 3.1. Knotted
- 3.2. Knotless
- 3.3. Others
Knotless Tissue Control Devices Industry Segmentation By Geography
-
1. North America
- 1.1. United States
- 1.2. Canada
- 1.3. Mexico
-
2. Europe
- 2.1. Germany
- 2.2. United Kingdom
- 2.3. France
- 2.4. Italy
- 2.5. Spain
- 2.6. Rest of Europe
-
3. Asia Pacific
- 3.1. China
- 3.2. Japan
- 3.3. India
- 3.4. Australia
- 3.5. South Korea
- 3.6. Rest of Asia Pacific
-
4. Middle East and Africa
- 4.1. GCC
- 4.2. South Africa
- 4.3. Rest of Middle East and Africa
-
5. South America
- 5.1. Brazil
- 5.2. Argentina
- 5.3. Rest of South America
Knotless Tissue Control Devices Industry REPORT HIGHLIGHTS
| Aspects | Details |
|---|---|
| Study Period | 2019-2033 |
| Base Year | 2024 |
| Estimated Year | 2025 |
| Forecast Period | 2025-2033 |
| Historical Period | 2019-2024 |
| Growth Rate | CAGR of 5.50% from 2019-2033 |
| Segmentation |
|
Table of Contents
- 1. Introduction
- 1.1. Research Scope
- 1.2. Market Segmentation
- 1.3. Research Methodology
- 1.4. Definitions and Assumptions
- 2. Executive Summary
- 2.1. Introduction
- 3. Market Dynamics
- 3.1. Introduction
- 3.2. Market Drivers
- 3.2.1. Increasing Orthopedic injuries in geriatric population; Demand for minimally-invasive surgeries; Rising Number of Sports Accidents
- 3.3. Market Restrains
- 3.3.1. Varying degree of tissue reaction
- 3.4. Market Trends
- 3.4.1. Knotless Segment is Expected to Hold a Major Market Share in the Suture Anchor Devices Market
- 4. Market Factor Analysis
- 4.1. Porters Five Forces
- 4.2. Supply/Value Chain
- 4.3. PESTEL analysis
- 4.4. Market Entropy
- 4.5. Patent/Trademark Analysis
- 5. Global Knotless Tissue Control Devices Industry Analysis, Insights and Forecast, 2019-2031
- 5.1. Market Analysis, Insights and Forecast - by Product Type
- 5.1.1. Absorbable
- 5.1.2. Non-Absorbable
- 5.2. Market Analysis, Insights and Forecast - by Material Type
- 5.2.1. Metallic Suture Anchor
- 5.2.2. Bio-absorbable Suture Anchor
- 5.2.3. Others
- 5.3. Market Analysis, Insights and Forecast - by Tying Type
- 5.3.1. Knotted
- 5.3.2. Knotless
- 5.3.3. Others
- 5.4. Market Analysis, Insights and Forecast - by Region
- 5.4.1. North America
- 5.4.2. Europe
- 5.4.3. Asia Pacific
- 5.4.4. Middle East and Africa
- 5.4.5. South America
- 5.1. Market Analysis, Insights and Forecast - by Product Type
- 6. North America Knotless Tissue Control Devices Industry Analysis, Insights and Forecast, 2019-2031
- 6.1. Market Analysis, Insights and Forecast - by Product Type
- 6.1.1. Absorbable
- 6.1.2. Non-Absorbable
- 6.2. Market Analysis, Insights and Forecast - by Material Type
- 6.2.1. Metallic Suture Anchor
- 6.2.2. Bio-absorbable Suture Anchor
- 6.2.3. Others
- 6.3. Market Analysis, Insights and Forecast - by Tying Type
- 6.3.1. Knotted
- 6.3.2. Knotless
- 6.3.3. Others
- 6.1. Market Analysis, Insights and Forecast - by Product Type
- 7. Europe Knotless Tissue Control Devices Industry Analysis, Insights and Forecast, 2019-2031
- 7.1. Market Analysis, Insights and Forecast - by Product Type
- 7.1.1. Absorbable
- 7.1.2. Non-Absorbable
- 7.2. Market Analysis, Insights and Forecast - by Material Type
- 7.2.1. Metallic Suture Anchor
- 7.2.2. Bio-absorbable Suture Anchor
- 7.2.3. Others
- 7.3. Market Analysis, Insights and Forecast - by Tying Type
- 7.3.1. Knotted
- 7.3.2. Knotless
- 7.3.3. Others
- 7.1. Market Analysis, Insights and Forecast - by Product Type
- 8. Asia Pacific Knotless Tissue Control Devices Industry Analysis, Insights and Forecast, 2019-2031
- 8.1. Market Analysis, Insights and Forecast - by Product Type
- 8.1.1. Absorbable
- 8.1.2. Non-Absorbable
- 8.2. Market Analysis, Insights and Forecast - by Material Type
- 8.2.1. Metallic Suture Anchor
- 8.2.2. Bio-absorbable Suture Anchor
- 8.2.3. Others
- 8.3. Market Analysis, Insights and Forecast - by Tying Type
- 8.3.1. Knotted
- 8.3.2. Knotless
- 8.3.3. Others
- 8.1. Market Analysis, Insights and Forecast - by Product Type
- 9. Middle East and Africa Knotless Tissue Control Devices Industry Analysis, Insights and Forecast, 2019-2031
- 9.1. Market Analysis, Insights and Forecast - by Product Type
- 9.1.1. Absorbable
- 9.1.2. Non-Absorbable
- 9.2. Market Analysis, Insights and Forecast - by Material Type
- 9.2.1. Metallic Suture Anchor
- 9.2.2. Bio-absorbable Suture Anchor
- 9.2.3. Others
- 9.3. Market Analysis, Insights and Forecast - by Tying Type
- 9.3.1. Knotted
- 9.3.2. Knotless
- 9.3.3. Others
- 9.1. Market Analysis, Insights and Forecast - by Product Type
- 10. South America Knotless Tissue Control Devices Industry Analysis, Insights and Forecast, 2019-2031
- 10.1. Market Analysis, Insights and Forecast - by Product Type
- 10.1.1. Absorbable
- 10.1.2. Non-Absorbable
- 10.2. Market Analysis, Insights and Forecast - by Material Type
- 10.2.1. Metallic Suture Anchor
- 10.2.2. Bio-absorbable Suture Anchor
- 10.2.3. Others
- 10.3. Market Analysis, Insights and Forecast - by Tying Type
- 10.3.1. Knotted
- 10.3.2. Knotless
- 10.3.3. Others
- 10.1. Market Analysis, Insights and Forecast - by Product Type
- 11. North America Knotless Tissue Control Devices Industry Analysis, Insights and Forecast, 2019-2031
- 11.1. Market Analysis, Insights and Forecast - By Country/Sub-region
- 11.1.1 United States
- 11.1.2 Canada
- 11.1.3 Mexico
- 12. Europe Knotless Tissue Control Devices Industry Analysis, Insights and Forecast, 2019-2031
- 12.1. Market Analysis, Insights and Forecast - By Country/Sub-region
- 12.1.1 Germany
- 12.1.2 United Kingdom
- 12.1.3 France
- 12.1.4 Italy
- 12.1.5 Spain
- 12.1.6 Rest of Europe
- 13. Asia Pacific Knotless Tissue Control Devices Industry Analysis, Insights and Forecast, 2019-2031
- 13.1. Market Analysis, Insights and Forecast - By Country/Sub-region
- 13.1.1 China
- 13.1.2 Japan
- 13.1.3 India
- 13.1.4 Australia
- 13.1.5 South Korea
- 13.1.6 Rest of Asia Pacific
- 14. Middle East and Africa Knotless Tissue Control Devices Industry Analysis, Insights and Forecast, 2019-2031
- 14.1. Market Analysis, Insights and Forecast - By Country/Sub-region
- 14.1.1 GCC
- 14.1.2 South Africa
- 14.1.3 Rest of Middle East and Africa
- 15. South America Knotless Tissue Control Devices Industry Analysis, Insights and Forecast, 2019-2031
- 15.1. Market Analysis, Insights and Forecast - By Country/Sub-region
- 15.1.1 Brazil
- 15.1.2 Argentina
- 15.1.3 Rest of South America
- 16. Competitive Analysis
- 16.1. Global Market Share Analysis 2024
- 16.2. Company Profiles
- 16.2.1 Arthrex Inc
- 16.2.1.1. Overview
- 16.2.1.2. Products
- 16.2.1.3. SWOT Analysis
- 16.2.1.4. Recent Developments
- 16.2.1.5. Financials (Based on Availability)
- 16.2.2 Johnson and Johnson (DePuy Synthes Inc )
- 16.2.2.1. Overview
- 16.2.2.2. Products
- 16.2.2.3. SWOT Analysis
- 16.2.2.4. Recent Developments
- 16.2.2.5. Financials (Based on Availability)
- 16.2.3 ConMed Corporation
- 16.2.3.1. Overview
- 16.2.3.2. Products
- 16.2.3.3. SWOT Analysis
- 16.2.3.4. Recent Developments
- 16.2.3.5. Financials (Based on Availability)
- 16.2.4 Orthomed
- 16.2.4.1. Overview
- 16.2.4.2. Products
- 16.2.4.3. SWOT Analysis
- 16.2.4.4. Recent Developments
- 16.2.4.5. Financials (Based on Availability)
- 16.2.5 Enovis
- 16.2.5.1. Overview
- 16.2.5.2. Products
- 16.2.5.3. SWOT Analysis
- 16.2.5.4. Recent Developments
- 16.2.5.5. Financials (Based on Availability)
- 16.2.6 Parcus Medical LLC
- 16.2.6.1. Overview
- 16.2.6.2. Products
- 16.2.6.3. SWOT Analysis
- 16.2.6.4. Recent Developments
- 16.2.6.5. Financials (Based on Availability)
- 16.2.7 Zimmer Biomet Holdings
- 16.2.7.1. Overview
- 16.2.7.2. Products
- 16.2.7.3. SWOT Analysis
- 16.2.7.4. Recent Developments
- 16.2.7.5. Financials (Based on Availability)
- 16.2.8 Stryker Corporation
- 16.2.8.1. Overview
- 16.2.8.2. Products
- 16.2.8.3. SWOT Analysis
- 16.2.8.4. Recent Developments
- 16.2.8.5. Financials (Based on Availability)
- 16.2.9 Teknimed
- 16.2.9.1. Overview
- 16.2.9.2. Products
- 16.2.9.3. SWOT Analysis
- 16.2.9.4. Recent Developments
- 16.2.9.5. Financials (Based on Availability)
- 16.2.10 Smith & Nephew plc
- 16.2.10.1. Overview
- 16.2.10.2. Products
- 16.2.10.3. SWOT Analysis
- 16.2.10.4. Recent Developments
- 16.2.10.5. Financials (Based on Availability)
- 16.2.11 Wright Medical
- 16.2.11.1. Overview
- 16.2.11.2. Products
- 16.2.11.3. SWOT Analysis
- 16.2.11.4. Recent Developments
- 16.2.11.5. Financials (Based on Availability)
- 16.2.12 Medtronic plc
- 16.2.12.1. Overview
- 16.2.12.2. Products
- 16.2.12.3. SWOT Analysis
- 16.2.12.4. Recent Developments
- 16.2.12.5. Financials (Based on Availability)
- 16.2.1 Arthrex Inc
List of Figures
- Figure 1: Global Knotless Tissue Control Devices Industry Revenue Breakdown (Million, %) by Region 2024 & 2032
- Figure 2: Global Knotless Tissue Control Devices Industry Volume Breakdown (K Unit, %) by Region 2024 & 2032
- Figure 3: North America Knotless Tissue Control Devices Industry Revenue (Million), by Country 2024 & 2032
- Figure 4: North America Knotless Tissue Control Devices Industry Volume (K Unit), by Country 2024 & 2032
- Figure 5: North America Knotless Tissue Control Devices Industry Revenue Share (%), by Country 2024 & 2032
- Figure 6: North America Knotless Tissue Control Devices Industry Volume Share (%), by Country 2024 & 2032
- Figure 7: Europe Knotless Tissue Control Devices Industry Revenue (Million), by Country 2024 & 2032
- Figure 8: Europe Knotless Tissue Control Devices Industry Volume (K Unit), by Country 2024 & 2032
- Figure 9: Europe Knotless Tissue Control Devices Industry Revenue Share (%), by Country 2024 & 2032
- Figure 10: Europe Knotless Tissue Control Devices Industry Volume Share (%), by Country 2024 & 2032
- Figure 11: Asia Pacific Knotless Tissue Control Devices Industry Revenue (Million), by Country 2024 & 2032
- Figure 12: Asia Pacific Knotless Tissue Control Devices Industry Volume (K Unit), by Country 2024 & 2032
- Figure 13: Asia Pacific Knotless Tissue Control Devices Industry Revenue Share (%), by Country 2024 & 2032
- Figure 14: Asia Pacific Knotless Tissue Control Devices Industry Volume Share (%), by Country 2024 & 2032
- Figure 15: Middle East and Africa Knotless Tissue Control Devices Industry Revenue (Million), by Country 2024 & 2032
- Figure 16: Middle East and Africa Knotless Tissue Control Devices Industry Volume (K Unit), by Country 2024 & 2032
- Figure 17: Middle East and Africa Knotless Tissue Control Devices Industry Revenue Share (%), by Country 2024 & 2032
- Figure 18: Middle East and Africa Knotless Tissue Control Devices Industry Volume Share (%), by Country 2024 & 2032
- Figure 19: South America Knotless Tissue Control Devices Industry Revenue (Million), by Country 2024 & 2032
- Figure 20: South America Knotless Tissue Control Devices Industry Volume (K Unit), by Country 2024 & 2032
- Figure 21: South America Knotless Tissue Control Devices Industry Revenue Share (%), by Country 2024 & 2032
- Figure 22: South America Knotless Tissue Control Devices Industry Volume Share (%), by Country 2024 & 2032
- Figure 23: North America Knotless Tissue Control Devices Industry Revenue (Million), by Product Type 2024 & 2032
- Figure 24: North America Knotless Tissue Control Devices Industry Volume (K Unit), by Product Type 2024 & 2032
- Figure 25: North America Knotless Tissue Control Devices Industry Revenue Share (%), by Product Type 2024 & 2032
- Figure 26: North America Knotless Tissue Control Devices Industry Volume Share (%), by Product Type 2024 & 2032
- Figure 27: North America Knotless Tissue Control Devices Industry Revenue (Million), by Material Type 2024 & 2032
- Figure 28: North America Knotless Tissue Control Devices Industry Volume (K Unit), by Material Type 2024 & 2032
- Figure 29: North America Knotless Tissue Control Devices Industry Revenue Share (%), by Material Type 2024 & 2032
- Figure 30: North America Knotless Tissue Control Devices Industry Volume Share (%), by Material Type 2024 & 2032
- Figure 31: North America Knotless Tissue Control Devices Industry Revenue (Million), by Tying Type 2024 & 2032
- Figure 32: North America Knotless Tissue Control Devices Industry Volume (K Unit), by Tying Type 2024 & 2032
- Figure 33: North America Knotless Tissue Control Devices Industry Revenue Share (%), by Tying Type 2024 & 2032
- Figure 34: North America Knotless Tissue Control Devices Industry Volume Share (%), by Tying Type 2024 & 2032
- Figure 35: North America Knotless Tissue Control Devices Industry Revenue (Million), by Country 2024 & 2032
- Figure 36: North America Knotless Tissue Control Devices Industry Volume (K Unit), by Country 2024 & 2032
- Figure 37: North America Knotless Tissue Control Devices Industry Revenue Share (%), by Country 2024 & 2032
- Figure 38: North America Knotless Tissue Control Devices Industry Volume Share (%), by Country 2024 & 2032
- Figure 39: Europe Knotless Tissue Control Devices Industry Revenue (Million), by Product Type 2024 & 2032
- Figure 40: Europe Knotless Tissue Control Devices Industry Volume (K Unit), by Product Type 2024 & 2032
- Figure 41: Europe Knotless Tissue Control Devices Industry Revenue Share (%), by Product Type 2024 & 2032
- Figure 42: Europe Knotless Tissue Control Devices Industry Volume Share (%), by Product Type 2024 & 2032
- Figure 43: Europe Knotless Tissue Control Devices Industry Revenue (Million), by Material Type 2024 & 2032
- Figure 44: Europe Knotless Tissue Control Devices Industry Volume (K Unit), by Material Type 2024 & 2032
- Figure 45: Europe Knotless Tissue Control Devices Industry Revenue Share (%), by Material Type 2024 & 2032
- Figure 46: Europe Knotless Tissue Control Devices Industry Volume Share (%), by Material Type 2024 & 2032
- Figure 47: Europe Knotless Tissue Control Devices Industry Revenue (Million), by Tying Type 2024 & 2032
- Figure 48: Europe Knotless Tissue Control Devices Industry Volume (K Unit), by Tying Type 2024 & 2032
- Figure 49: Europe Knotless Tissue Control Devices Industry Revenue Share (%), by Tying Type 2024 & 2032
- Figure 50: Europe Knotless Tissue Control Devices Industry Volume Share (%), by Tying Type 2024 & 2032
- Figure 51: Europe Knotless Tissue Control Devices Industry Revenue (Million), by Country 2024 & 2032
- Figure 52: Europe Knotless Tissue Control Devices Industry Volume (K Unit), by Country 2024 & 2032
- Figure 53: Europe Knotless Tissue Control Devices Industry Revenue Share (%), by Country 2024 & 2032
- Figure 54: Europe Knotless Tissue Control Devices Industry Volume Share (%), by Country 2024 & 2032
- Figure 55: Asia Pacific Knotless Tissue Control Devices Industry Revenue (Million), by Product Type 2024 & 2032
- Figure 56: Asia Pacific Knotless Tissue Control Devices Industry Volume (K Unit), by Product Type 2024 & 2032
- Figure 57: Asia Pacific Knotless Tissue Control Devices Industry Revenue Share (%), by Product Type 2024 & 2032
- Figure 58: Asia Pacific Knotless Tissue Control Devices Industry Volume Share (%), by Product Type 2024 & 2032
- Figure 59: Asia Pacific Knotless Tissue Control Devices Industry Revenue (Million), by Material Type 2024 & 2032
- Figure 60: Asia Pacific Knotless Tissue Control Devices Industry Volume (K Unit), by Material Type 2024 & 2032
- Figure 61: Asia Pacific Knotless Tissue Control Devices Industry Revenue Share (%), by Material Type 2024 & 2032
- Figure 62: Asia Pacific Knotless Tissue Control Devices Industry Volume Share (%), by Material Type 2024 & 2032
- Figure 63: Asia Pacific Knotless Tissue Control Devices Industry Revenue (Million), by Tying Type 2024 & 2032
- Figure 64: Asia Pacific Knotless Tissue Control Devices Industry Volume (K Unit), by Tying Type 2024 & 2032
- Figure 65: Asia Pacific Knotless Tissue Control Devices Industry Revenue Share (%), by Tying Type 2024 & 2032
- Figure 66: Asia Pacific Knotless Tissue Control Devices Industry Volume Share (%), by Tying Type 2024 & 2032
- Figure 67: Asia Pacific Knotless Tissue Control Devices Industry Revenue (Million), by Country 2024 & 2032
- Figure 68: Asia Pacific Knotless Tissue Control Devices Industry Volume (K Unit), by Country 2024 & 2032
- Figure 69: Asia Pacific Knotless Tissue Control Devices Industry Revenue Share (%), by Country 2024 & 2032
- Figure 70: Asia Pacific Knotless Tissue Control Devices Industry Volume Share (%), by Country 2024 & 2032
- Figure 71: Middle East and Africa Knotless Tissue Control Devices Industry Revenue (Million), by Product Type 2024 & 2032
- Figure 72: Middle East and Africa Knotless Tissue Control Devices Industry Volume (K Unit), by Product Type 2024 & 2032
- Figure 73: Middle East and Africa Knotless Tissue Control Devices Industry Revenue Share (%), by Product Type 2024 & 2032
- Figure 74: Middle East and Africa Knotless Tissue Control Devices Industry Volume Share (%), by Product Type 2024 & 2032
- Figure 75: Middle East and Africa Knotless Tissue Control Devices Industry Revenue (Million), by Material Type 2024 & 2032
- Figure 76: Middle East and Africa Knotless Tissue Control Devices Industry Volume (K Unit), by Material Type 2024 & 2032
- Figure 77: Middle East and Africa Knotless Tissue Control Devices Industry Revenue Share (%), by Material Type 2024 & 2032
- Figure 78: Middle East and Africa Knotless Tissue Control Devices Industry Volume Share (%), by Material Type 2024 & 2032
- Figure 79: Middle East and Africa Knotless Tissue Control Devices Industry Revenue (Million), by Tying Type 2024 & 2032
- Figure 80: Middle East and Africa Knotless Tissue Control Devices Industry Volume (K Unit), by Tying Type 2024 & 2032
- Figure 81: Middle East and Africa Knotless Tissue Control Devices Industry Revenue Share (%), by Tying Type 2024 & 2032
- Figure 82: Middle East and Africa Knotless Tissue Control Devices Industry Volume Share (%), by Tying Type 2024 & 2032
- Figure 83: Middle East and Africa Knotless Tissue Control Devices Industry Revenue (Million), by Country 2024 & 2032
- Figure 84: Middle East and Africa Knotless Tissue Control Devices Industry Volume (K Unit), by Country 2024 & 2032
- Figure 85: Middle East and Africa Knotless Tissue Control Devices Industry Revenue Share (%), by Country 2024 & 2032
- Figure 86: Middle East and Africa Knotless Tissue Control Devices Industry Volume Share (%), by Country 2024 & 2032
- Figure 87: South America Knotless Tissue Control Devices Industry Revenue (Million), by Product Type 2024 & 2032
- Figure 88: South America Knotless Tissue Control Devices Industry Volume (K Unit), by Product Type 2024 & 2032
- Figure 89: South America Knotless Tissue Control Devices Industry Revenue Share (%), by Product Type 2024 & 2032
- Figure 90: South America Knotless Tissue Control Devices Industry Volume Share (%), by Product Type 2024 & 2032
- Figure 91: South America Knotless Tissue Control Devices Industry Revenue (Million), by Material Type 2024 & 2032
- Figure 92: South America Knotless Tissue Control Devices Industry Volume (K Unit), by Material Type 2024 & 2032
- Figure 93: South America Knotless Tissue Control Devices Industry Revenue Share (%), by Material Type 2024 & 2032
- Figure 94: South America Knotless Tissue Control Devices Industry Volume Share (%), by Material Type 2024 & 2032
- Figure 95: South America Knotless Tissue Control Devices Industry Revenue (Million), by Tying Type 2024 & 2032
- Figure 96: South America Knotless Tissue Control Devices Industry Volume (K Unit), by Tying Type 2024 & 2032
- Figure 97: South America Knotless Tissue Control Devices Industry Revenue Share (%), by Tying Type 2024 & 2032
- Figure 98: South America Knotless Tissue Control Devices Industry Volume Share (%), by Tying Type 2024 & 2032
- Figure 99: South America Knotless Tissue Control Devices Industry Revenue (Million), by Country 2024 & 2032
- Figure 100: South America Knotless Tissue Control Devices Industry Volume (K Unit), by Country 2024 & 2032
- Figure 101: South America Knotless Tissue Control Devices Industry Revenue Share (%), by Country 2024 & 2032
- Figure 102: South America Knotless Tissue Control Devices Industry Volume Share (%), by Country 2024 & 2032
List of Tables
- Table 1: Global Knotless Tissue Control Devices Industry Revenue Million Forecast, by Region 2019 & 2032
- Table 2: Global Knotless Tissue Control Devices Industry Volume K Unit Forecast, by Region 2019 & 2032
- Table 3: Global Knotless Tissue Control Devices Industry Revenue Million Forecast, by Product Type 2019 & 2032
- Table 4: Global Knotless Tissue Control Devices Industry Volume K Unit Forecast, by Product Type 2019 & 2032
- Table 5: Global Knotless Tissue Control Devices Industry Revenue Million Forecast, by Material Type 2019 & 2032
- Table 6: Global Knotless Tissue Control Devices Industry Volume K Unit Forecast, by Material Type 2019 & 2032
- Table 7: Global Knotless Tissue Control Devices Industry Revenue Million Forecast, by Tying Type 2019 & 2032
- Table 8: Global Knotless Tissue Control Devices Industry Volume K Unit Forecast, by Tying Type 2019 & 2032
- Table 9: Global Knotless Tissue Control Devices Industry Revenue Million Forecast, by Region 2019 & 2032
- Table 10: Global Knotless Tissue Control Devices Industry Volume K Unit Forecast, by Region 2019 & 2032
- Table 11: Global Knotless Tissue Control Devices Industry Revenue Million Forecast, by Country 2019 & 2032
- Table 12: Global Knotless Tissue Control Devices Industry Volume K Unit Forecast, by Country 2019 & 2032
- Table 13: United States Knotless Tissue Control Devices Industry Revenue (Million) Forecast, by Application 2019 & 2032
- Table 14: United States Knotless Tissue Control Devices Industry Volume (K Unit) Forecast, by Application 2019 & 2032
- Table 15: Canada Knotless Tissue Control Devices Industry Revenue (Million) Forecast, by Application 2019 & 2032
- Table 16: Canada Knotless Tissue Control Devices Industry Volume (K Unit) Forecast, by Application 2019 & 2032
- Table 17: Mexico Knotless Tissue Control Devices Industry Revenue (Million) Forecast, by Application 2019 & 2032
- Table 18: Mexico Knotless Tissue Control Devices Industry Volume (K Unit) Forecast, by Application 2019 & 2032
- Table 19: Global Knotless Tissue Control Devices Industry Revenue Million Forecast, by Country 2019 & 2032
- Table 20: Global Knotless Tissue Control Devices Industry Volume K Unit Forecast, by Country 2019 & 2032
- Table 21: Germany Knotless Tissue Control Devices Industry Revenue (Million) Forecast, by Application 2019 & 2032
- Table 22: Germany Knotless Tissue Control Devices Industry Volume (K Unit) Forecast, by Application 2019 & 2032
- Table 23: United Kingdom Knotless Tissue Control Devices Industry Revenue (Million) Forecast, by Application 2019 & 2032
- Table 24: United Kingdom Knotless Tissue Control Devices Industry Volume (K Unit) Forecast, by Application 2019 & 2032
- Table 25: France Knotless Tissue Control Devices Industry Revenue (Million) Forecast, by Application 2019 & 2032
- Table 26: France Knotless Tissue Control Devices Industry Volume (K Unit) Forecast, by Application 2019 & 2032
- Table 27: Italy Knotless Tissue Control Devices Industry Revenue (Million) Forecast, by Application 2019 & 2032
- Table 28: Italy Knotless Tissue Control Devices Industry Volume (K Unit) Forecast, by Application 2019 & 2032
- Table 29: Spain Knotless Tissue Control Devices Industry Revenue (Million) Forecast, by Application 2019 & 2032
- Table 30: Spain Knotless Tissue Control Devices Industry Volume (K Unit) Forecast, by Application 2019 & 2032
- Table 31: Rest of Europe Knotless Tissue Control Devices Industry Revenue (Million) Forecast, by Application 2019 & 2032
- Table 32: Rest of Europe Knotless Tissue Control Devices Industry Volume (K Unit) Forecast, by Application 2019 & 2032
- Table 33: Global Knotless Tissue Control Devices Industry Revenue Million Forecast, by Country 2019 & 2032
- Table 34: Global Knotless Tissue Control Devices Industry Volume K Unit Forecast, by Country 2019 & 2032
- Table 35: China Knotless Tissue Control Devices Industry Revenue (Million) Forecast, by Application 2019 & 2032
- Table 36: China Knotless Tissue Control Devices Industry Volume (K Unit) Forecast, by Application 2019 & 2032
- Table 37: Japan Knotless Tissue Control Devices Industry Revenue (Million) Forecast, by Application 2019 & 2032
- Table 38: Japan Knotless Tissue Control Devices Industry Volume (K Unit) Forecast, by Application 2019 & 2032
- Table 39: India Knotless Tissue Control Devices Industry Revenue (Million) Forecast, by Application 2019 & 2032
- Table 40: India Knotless Tissue Control Devices Industry Volume (K Unit) Forecast, by Application 2019 & 2032
- Table 41: Australia Knotless Tissue Control Devices Industry Revenue (Million) Forecast, by Application 2019 & 2032
- Table 42: Australia Knotless Tissue Control Devices Industry Volume (K Unit) Forecast, by Application 2019 & 2032
- Table 43: South Korea Knotless Tissue Control Devices Industry Revenue (Million) Forecast, by Application 2019 & 2032
- Table 44: South Korea Knotless Tissue Control Devices Industry Volume (K Unit) Forecast, by Application 2019 & 2032
- Table 45: Rest of Asia Pacific Knotless Tissue Control Devices Industry Revenue (Million) Forecast, by Application 2019 & 2032
- Table 46: Rest of Asia Pacific Knotless Tissue Control Devices Industry Volume (K Unit) Forecast, by Application 2019 & 2032
- Table 47: Global Knotless Tissue Control Devices Industry Revenue Million Forecast, by Country 2019 & 2032
- Table 48: Global Knotless Tissue Control Devices Industry Volume K Unit Forecast, by Country 2019 & 2032
- Table 49: GCC Knotless Tissue Control Devices Industry Revenue (Million) Forecast, by Application 2019 & 2032
- Table 50: GCC Knotless Tissue Control Devices Industry Volume (K Unit) Forecast, by Application 2019 & 2032
- Table 51: South Africa Knotless Tissue Control Devices Industry Revenue (Million) Forecast, by Application 2019 & 2032
- Table 52: South Africa Knotless Tissue Control Devices Industry Volume (K Unit) Forecast, by Application 2019 & 2032
- Table 53: Rest of Middle East and Africa Knotless Tissue Control Devices Industry Revenue (Million) Forecast, by Application 2019 & 2032
- Table 54: Rest of Middle East and Africa Knotless Tissue Control Devices Industry Volume (K Unit) Forecast, by Application 2019 & 2032
- Table 55: Global Knotless Tissue Control Devices Industry Revenue Million Forecast, by Country 2019 & 2032
- Table 56: Global Knotless Tissue Control Devices Industry Volume K Unit Forecast, by Country 2019 & 2032
- Table 57: Brazil Knotless Tissue Control Devices Industry Revenue (Million) Forecast, by Application 2019 & 2032
- Table 58: Brazil Knotless Tissue Control Devices Industry Volume (K Unit) Forecast, by Application 2019 & 2032
- Table 59: Argentina Knotless Tissue Control Devices Industry Revenue (Million) Forecast, by Application 2019 & 2032
- Table 60: Argentina Knotless Tissue Control Devices Industry Volume (K Unit) Forecast, by Application 2019 & 2032
- Table 61: Rest of South America Knotless Tissue Control Devices Industry Revenue (Million) Forecast, by Application 2019 & 2032
- Table 62: Rest of South America Knotless Tissue Control Devices Industry Volume (K Unit) Forecast, by Application 2019 & 2032
- Table 63: Global Knotless Tissue Control Devices Industry Revenue Million Forecast, by Product Type 2019 & 2032
- Table 64: Global Knotless Tissue Control Devices Industry Volume K Unit Forecast, by Product Type 2019 & 2032
- Table 65: Global Knotless Tissue Control Devices Industry Revenue Million Forecast, by Material Type 2019 & 2032
- Table 66: Global Knotless Tissue Control Devices Industry Volume K Unit Forecast, by Material Type 2019 & 2032
- Table 67: Global Knotless Tissue Control Devices Industry Revenue Million Forecast, by Tying Type 2019 & 2032
- Table 68: Global Knotless Tissue Control Devices Industry Volume K Unit Forecast, by Tying Type 2019 & 2032
- Table 69: Global Knotless Tissue Control Devices Industry Revenue Million Forecast, by Country 2019 & 2032
- Table 70: Global Knotless Tissue Control Devices Industry Volume K Unit Forecast, by Country 2019 & 2032
- Table 71: United States Knotless Tissue Control Devices Industry Revenue (Million) Forecast, by Application 2019 & 2032
- Table 72: United States Knotless Tissue Control Devices Industry Volume (K Unit) Forecast, by Application 2019 & 2032
- Table 73: Canada Knotless Tissue Control Devices Industry Revenue (Million) Forecast, by Application 2019 & 2032
- Table 74: Canada Knotless Tissue Control Devices Industry Volume (K Unit) Forecast, by Application 2019 & 2032
- Table 75: Mexico Knotless Tissue Control Devices Industry Revenue (Million) Forecast, by Application 2019 & 2032
- Table 76: Mexico Knotless Tissue Control Devices Industry Volume (K Unit) Forecast, by Application 2019 & 2032
- Table 77: Global Knotless Tissue Control Devices Industry Revenue Million Forecast, by Product Type 2019 & 2032
- Table 78: Global Knotless Tissue Control Devices Industry Volume K Unit Forecast, by Product Type 2019 & 2032
- Table 79: Global Knotless Tissue Control Devices Industry Revenue Million Forecast, by Material Type 2019 & 2032
- Table 80: Global Knotless Tissue Control Devices Industry Volume K Unit Forecast, by Material Type 2019 & 2032
- Table 81: Global Knotless Tissue Control Devices Industry Revenue Million Forecast, by Tying Type 2019 & 2032
- Table 82: Global Knotless Tissue Control Devices Industry Volume K Unit Forecast, by Tying Type 2019 & 2032
- Table 83: Global Knotless Tissue Control Devices Industry Revenue Million Forecast, by Country 2019 & 2032
- Table 84: Global Knotless Tissue Control Devices Industry Volume K Unit Forecast, by Country 2019 & 2032
- Table 85: Germany Knotless Tissue Control Devices Industry Revenue (Million) Forecast, by Application 2019 & 2032
- Table 86: Germany Knotless Tissue Control Devices Industry Volume (K Unit) Forecast, by Application 2019 & 2032
- Table 87: United Kingdom Knotless Tissue Control Devices Industry Revenue (Million) Forecast, by Application 2019 & 2032
- Table 88: United Kingdom Knotless Tissue Control Devices Industry Volume (K Unit) Forecast, by Application 2019 & 2032
- Table 89: France Knotless Tissue Control Devices Industry Revenue (Million) Forecast, by Application 2019 & 2032
- Table 90: France Knotless Tissue Control Devices Industry Volume (K Unit) Forecast, by Application 2019 & 2032
- Table 91: Italy Knotless Tissue Control Devices Industry Revenue (Million) Forecast, by Application 2019 & 2032
- Table 92: Italy Knotless Tissue Control Devices Industry Volume (K Unit) Forecast, by Application 2019 & 2032
- Table 93: Spain Knotless Tissue Control Devices Industry Revenue (Million) Forecast, by Application 2019 & 2032
- Table 94: Spain Knotless Tissue Control Devices Industry Volume (K Unit) Forecast, by Application 2019 & 2032
- Table 95: Rest of Europe Knotless Tissue Control Devices Industry Revenue (Million) Forecast, by Application 2019 & 2032
- Table 96: Rest of Europe Knotless Tissue Control Devices Industry Volume (K Unit) Forecast, by Application 2019 & 2032
- Table 97: Global Knotless Tissue Control Devices Industry Revenue Million Forecast, by Product Type 2019 & 2032
- Table 98: Global Knotless Tissue Control Devices Industry Volume K Unit Forecast, by Product Type 2019 & 2032
- Table 99: Global Knotless Tissue Control Devices Industry Revenue Million Forecast, by Material Type 2019 & 2032
- Table 100: Global Knotless Tissue Control Devices Industry Volume K Unit Forecast, by Material Type 2019 & 2032
- Table 101: Global Knotless Tissue Control Devices Industry Revenue Million Forecast, by Tying Type 2019 & 2032
- Table 102: Global Knotless Tissue Control Devices Industry Volume K Unit Forecast, by Tying Type 2019 & 2032
- Table 103: Global Knotless Tissue Control Devices Industry Revenue Million Forecast, by Country 2019 & 2032
- Table 104: Global Knotless Tissue Control Devices Industry Volume K Unit Forecast, by Country 2019 & 2032
- Table 105: China Knotless Tissue Control Devices Industry Revenue (Million) Forecast, by Application 2019 & 2032
- Table 106: China Knotless Tissue Control Devices Industry Volume (K Unit) Forecast, by Application 2019 & 2032
- Table 107: Japan Knotless Tissue Control Devices Industry Revenue (Million) Forecast, by Application 2019 & 2032
- Table 108: Japan Knotless Tissue Control Devices Industry Volume (K Unit) Forecast, by Application 2019 & 2032
- Table 109: India Knotless Tissue Control Devices Industry Revenue (Million) Forecast, by Application 2019 & 2032
- Table 110: India Knotless Tissue Control Devices Industry Volume (K Unit) Forecast, by Application 2019 & 2032
- Table 111: Australia Knotless Tissue Control Devices Industry Revenue (Million) Forecast, by Application 2019 & 2032
- Table 112: Australia Knotless Tissue Control Devices Industry Volume (K Unit) Forecast, by Application 2019 & 2032
- Table 113: South Korea Knotless Tissue Control Devices Industry Revenue (Million) Forecast, by Application 2019 & 2032
- Table 114: South Korea Knotless Tissue Control Devices Industry Volume (K Unit) Forecast, by Application 2019 & 2032
- Table 115: Rest of Asia Pacific Knotless Tissue Control Devices Industry Revenue (Million) Forecast, by Application 2019 & 2032
- Table 116: Rest of Asia Pacific Knotless Tissue Control Devices Industry Volume (K Unit) Forecast, by Application 2019 & 2032
- Table 117: Global Knotless Tissue Control Devices Industry Revenue Million Forecast, by Product Type 2019 & 2032
- Table 118: Global Knotless Tissue Control Devices Industry Volume K Unit Forecast, by Product Type 2019 & 2032
- Table 119: Global Knotless Tissue Control Devices Industry Revenue Million Forecast, by Material Type 2019 & 2032
- Table 120: Global Knotless Tissue Control Devices Industry Volume K Unit Forecast, by Material Type 2019 & 2032
- Table 121: Global Knotless Tissue Control Devices Industry Revenue Million Forecast, by Tying Type 2019 & 2032
- Table 122: Global Knotless Tissue Control Devices Industry Volume K Unit Forecast, by Tying Type 2019 & 2032
- Table 123: Global Knotless Tissue Control Devices Industry Revenue Million Forecast, by Country 2019 & 2032
- Table 124: Global Knotless Tissue Control Devices Industry Volume K Unit Forecast, by Country 2019 & 2032
- Table 125: GCC Knotless Tissue Control Devices Industry Revenue (Million) Forecast, by Application 2019 & 2032
- Table 126: GCC Knotless Tissue Control Devices Industry Volume (K Unit) Forecast, by Application 2019 & 2032
- Table 127: South Africa Knotless Tissue Control Devices Industry Revenue (Million) Forecast, by Application 2019 & 2032
- Table 128: South Africa Knotless Tissue Control Devices Industry Volume (K Unit) Forecast, by Application 2019 & 2032
- Table 129: Rest of Middle East and Africa Knotless Tissue Control Devices Industry Revenue (Million) Forecast, by Application 2019 & 2032
- Table 130: Rest of Middle East and Africa Knotless Tissue Control Devices Industry Volume (K Unit) Forecast, by Application 2019 & 2032
- Table 131: Global Knotless Tissue Control Devices Industry Revenue Million Forecast, by Product Type 2019 & 2032
- Table 132: Global Knotless Tissue Control Devices Industry Volume K Unit Forecast, by Product Type 2019 & 2032
- Table 133: Global Knotless Tissue Control Devices Industry Revenue Million Forecast, by Material Type 2019 & 2032
- Table 134: Global Knotless Tissue Control Devices Industry Volume K Unit Forecast, by Material Type 2019 & 2032
- Table 135: Global Knotless Tissue Control Devices Industry Revenue Million Forecast, by Tying Type 2019 & 2032
- Table 136: Global Knotless Tissue Control Devices Industry Volume K Unit Forecast, by Tying Type 2019 & 2032
- Table 137: Global Knotless Tissue Control Devices Industry Revenue Million Forecast, by Country 2019 & 2032
- Table 138: Global Knotless Tissue Control Devices Industry Volume K Unit Forecast, by Country 2019 & 2032
- Table 139: Brazil Knotless Tissue Control Devices Industry Revenue (Million) Forecast, by Application 2019 & 2032
- Table 140: Brazil Knotless Tissue Control Devices Industry Volume (K Unit) Forecast, by Application 2019 & 2032
- Table 141: Argentina Knotless Tissue Control Devices Industry Revenue (Million) Forecast, by Application 2019 & 2032
- Table 142: Argentina Knotless Tissue Control Devices Industry Volume (K Unit) Forecast, by Application 2019 & 2032
- Table 143: Rest of South America Knotless Tissue Control Devices Industry Revenue (Million) Forecast, by Application 2019 & 2032
- Table 144: Rest of South America Knotless Tissue Control Devices Industry Volume (K Unit) Forecast, by Application 2019 & 2032
Frequently Asked Questions
1. What is the projected Compound Annual Growth Rate (CAGR) of the Knotless Tissue Control Devices Industry?
The projected CAGR is approximately 5.50%.
2. Which companies are prominent players in the Knotless Tissue Control Devices Industry?
Key companies in the market include Arthrex Inc, Johnson and Johnson (DePuy Synthes Inc ), ConMed Corporation, Orthomed, Enovis, Parcus Medical LLC, Zimmer Biomet Holdings, Stryker Corporation, Teknimed, Smith & Nephew plc, Wright Medical, Medtronic plc.
3. What are the main segments of the Knotless Tissue Control Devices Industry?
The market segments include Product Type, Material Type, Tying Type.
4. Can you provide details about the market size?
The market size is estimated to be USD XX Million as of 2022.
5. What are some drivers contributing to market growth?
Increasing Orthopedic injuries in geriatric population; Demand for minimally-invasive surgeries; Rising Number of Sports Accidents.
6. What are the notable trends driving market growth?
Knotless Segment is Expected to Hold a Major Market Share in the Suture Anchor Devices Market.
7. Are there any restraints impacting market growth?
Varying degree of tissue reaction.
8. Can you provide examples of recent developments in the market?
N/A
9. What pricing options are available for accessing the report?
Pricing options include single-user, multi-user, and enterprise licenses priced at USD 4750, USD 5250, and USD 8750 respectively.
10. Is the market size provided in terms of value or volume?
The market size is provided in terms of value, measured in Million and volume, measured in K Unit.
11. Are there any specific market keywords associated with the report?
Yes, the market keyword associated with the report is "Knotless Tissue Control Devices Industry," which aids in identifying and referencing the specific market segment covered.
12. How do I determine which pricing option suits my needs best?
The pricing options vary based on user requirements and access needs. Individual users may opt for single-user licenses, while businesses requiring broader access may choose multi-user or enterprise licenses for cost-effective access to the report.
13. Are there any additional resources or data provided in the Knotless Tissue Control Devices Industry report?
While the report offers comprehensive insights, it's advisable to review the specific contents or supplementary materials provided to ascertain if additional resources or data are available.
14. How can I stay updated on further developments or reports in the Knotless Tissue Control Devices Industry?
To stay informed about further developments, trends, and reports in the Knotless Tissue Control Devices Industry, consider subscribing to industry newsletters, following relevant companies and organizations, or regularly checking reputable industry news sources and publications.
Methodology
Step 1 - Identification of Relevant Samples Size from Population Database


Step 2 - Approaches for Defining Global Market Size (Value, Volume* & Price*)

Note*: In applicable scenarios
Step 3 - Data Sources
Primary Research
- Web Analytics
- Survey Reports
- Research Institute
- Latest Research Reports
- Opinion Leaders
Secondary Research
- Annual Reports
- White Paper
- Latest Press Release
- Industry Association
- Paid Database
- Investor Presentations

Step 4 - Data Triangulation
Involves using different sources of information in order to increase the validity of a study
These sources are likely to be stakeholders in a program - participants, other researchers, program staff, other community members, and so on.
Then we put all data in single framework & apply various statistical tools to find out the dynamic on the market.
During the analysis stage, feedback from the stakeholder groups would be compared to determine areas of agreement as well as areas of divergence
