

Key Insights
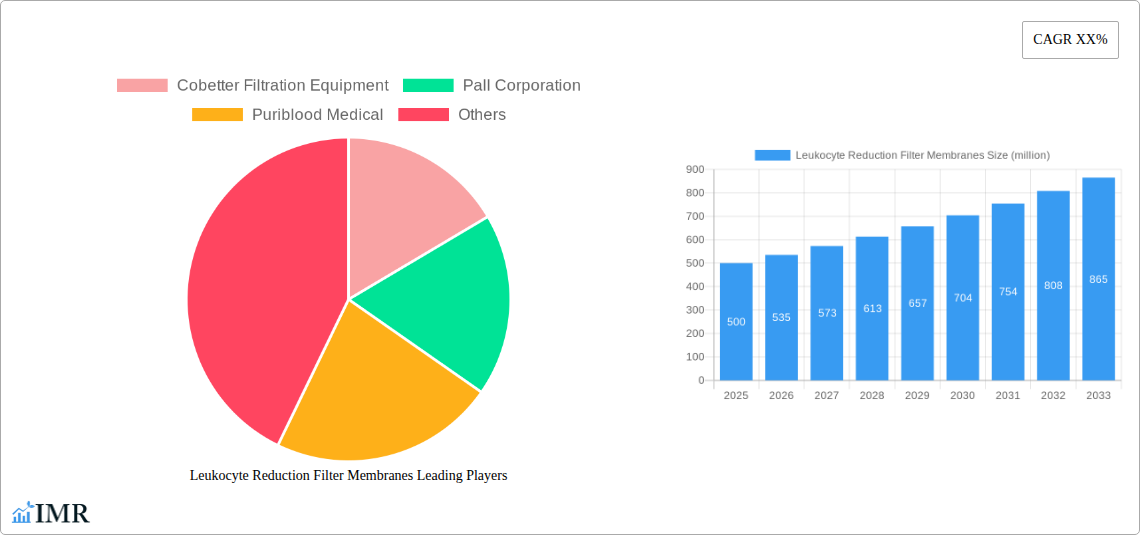
The global market for Leukocyte Reduction Filter Membranes is experiencing robust growth, driven by the increasing prevalence of blood-borne diseases and the rising demand for safe and effective blood transfusion therapies. The market, estimated at $500 million in 2025, is projected to expand at a Compound Annual Growth Rate (CAGR) of 7% from 2025 to 2033, reaching approximately $900 million by 2033. This growth is fueled by several key factors, including advancements in membrane technology leading to improved efficiency and reduced risks of transfusion-related complications, stringent regulatory requirements mandating the use of leukocyte reduction filters, and the growing adoption of these filters in various medical settings such as hospitals, blood banks, and transfusion centers. Furthermore, the increasing awareness among healthcare professionals and patients regarding the benefits of leukocyte reduction filters, coupled with technological innovations that enhance filter performance and reduce costs, are expected to further propel market expansion.
Major restraining factors include the relatively high cost of these filters, which can pose a barrier to adoption in resource-constrained settings. However, ongoing research and development efforts focusing on cost-effective manufacturing processes are expected to mitigate this constraint. The market is segmented by type (e.g., polyester, nylon, cellulose), application (e.g., blood transfusion, apheresis), and end-user (e.g., hospitals, blood banks). Key players in the market, such as Cobetter Filtration Equipment, Pall Corporation, and Puriblood Medical, are investing heavily in research and development to introduce innovative products and expand their market presence. Competitive landscape analysis reveals a mix of established players and emerging companies vying for market share through product differentiation, strategic partnerships, and geographical expansion. The regional distribution of the market is likely to be skewed towards developed regions initially, given higher healthcare expenditure and regulatory support, but emerging markets are expected to exhibit substantial growth in the coming years.
Leukocyte Reduction Filter Membranes Market Report: 2019-2033
This comprehensive report provides a detailed analysis of the Leukocyte Reduction Filter Membranes market, encompassing market dynamics, growth trends, regional segmentation, product landscape, key players, and future outlook. The report covers the period 2019-2033, with 2025 as the base year and forecast period extending to 2033. The market is segmented by type, application, and end-user, offering a granular understanding of this critical component within the larger blood processing and medical device industries. The total market value is estimated at xx million units in 2025.
Leukocyte Reduction Filter Membranes Market Dynamics & Structure
The Leukocyte Reduction Filter Membranes market exhibits a moderately consolidated structure, with key players like Cobetter Filtration Equipment, Pall Corporation, and Puriblood Medical holding significant market share. Technological innovation, particularly in membrane materials and filter design, is a key driver. Stringent regulatory frameworks, especially concerning biocompatibility and efficacy, shape market dynamics. Competitive pressure from alternative blood processing technologies exists, but the demand for safe and efficient leukocyte reduction remains high. Mergers and acquisitions (M&A) activity within the industry is expected to remain moderate, primarily focused on expanding product portfolios and geographical reach. The end-user segment is primarily hospitals and blood banks, with growing adoption in specialized clinics.
- Market Concentration: Moderately consolidated, with the top 3 players holding approximately xx% market share in 2025.
- Technological Innovation: Focus on improving filtration efficiency, reducing clogging, and enhancing biocompatibility.
- Regulatory Landscape: Stringent FDA and CE Mark regulations drive quality and safety standards.
- Competitive Substitutes: Alternative blood processing technologies, including centrifugation and other filtration methods.
- M&A Activity: Moderate activity, driven by expansion into new markets and product diversification. An estimated xx M&A deals occurred between 2019-2024.
Leukocyte Reduction Filter Membranes Growth Trends & Insights
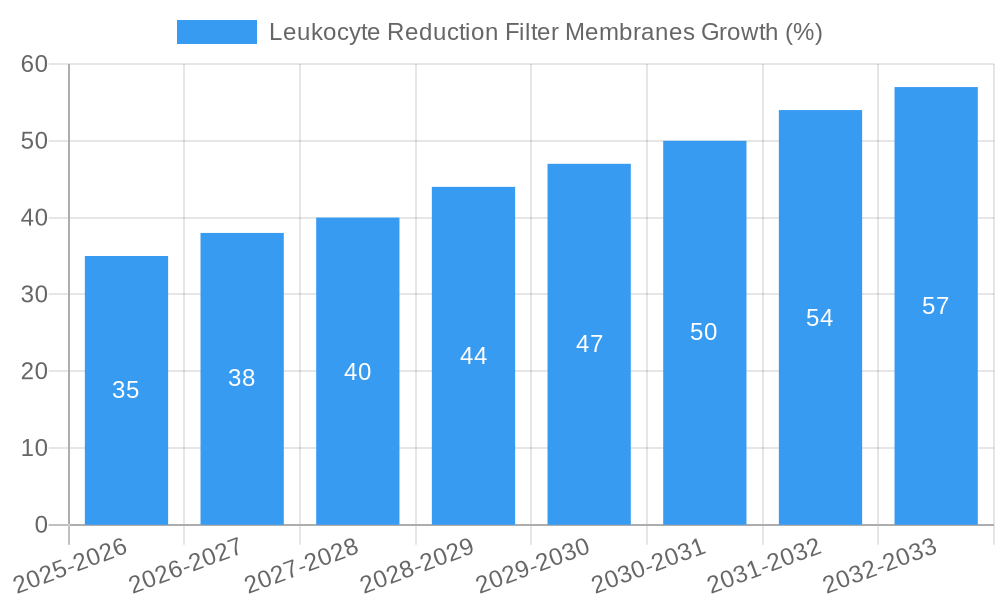
The Leukocyte Reduction Filter Membranes market has witnessed consistent growth over the historical period (2019-2024), driven by increasing awareness of transfusion-related complications and the growing adoption of leukocyte reduction techniques in blood transfusion practices. The market is expected to maintain a healthy Compound Annual Growth Rate (CAGR) of xx% during the forecast period (2025-2033), reaching an estimated value of xx million units by 2033. Technological advancements, such as the development of novel membrane materials with enhanced performance characteristics, are expected to fuel market growth. Furthermore, the increasing prevalence of chronic diseases requiring frequent blood transfusions and the rising demand for safer blood products are expected to contribute to market expansion. Market penetration is currently at xx% and is expected to reach xx% by 2033.
Dominant Regions, Countries, or Segments in Leukocyte Reduction Filter Membranes
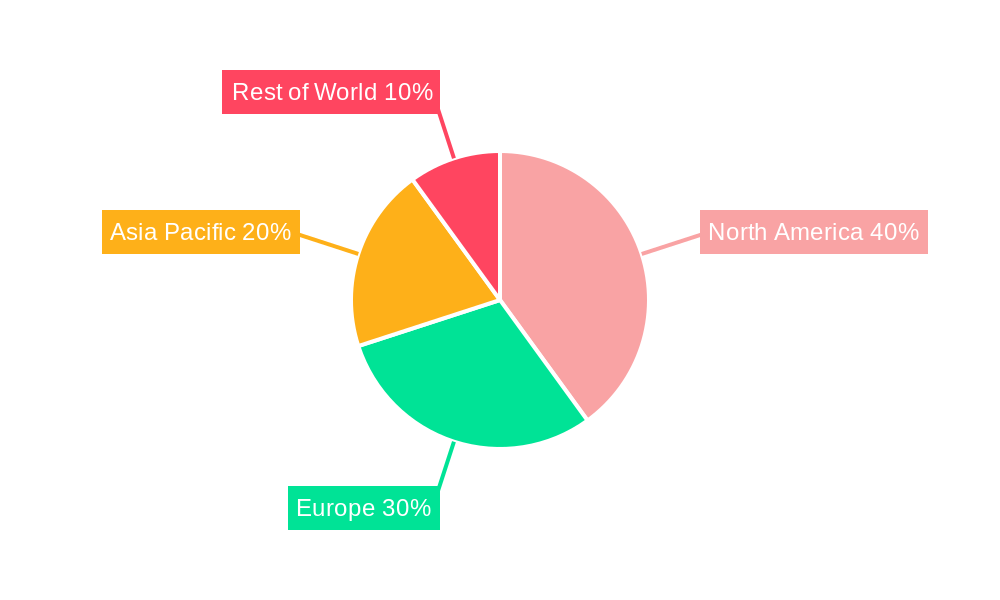
North America currently dominates the Leukocyte Reduction Filter Membranes market, followed by Europe and Asia Pacific. The high adoption rate in North America is attributed to the strong regulatory framework, advanced healthcare infrastructure, and higher awareness of blood-borne diseases. Europe's mature healthcare sector also contributes significantly. Asia Pacific is expected to witness the fastest growth during the forecast period, fueled by increasing healthcare spending, rising prevalence of chronic diseases, and expanding healthcare infrastructure.
- North America: Strong regulatory support, advanced healthcare infrastructure, high awareness of blood-borne diseases.
- Europe: Mature healthcare sector, high adoption rate, stringent regulatory standards.
- Asia Pacific: Fastest-growing region, driven by increasing healthcare expenditure and rising prevalence of chronic diseases.
- Market Share: North America holds approximately xx% market share in 2025, followed by Europe at xx%.
Leukocyte Reduction Filter Membranes Product Landscape
Leukocyte Reduction Filter Membranes are available in various designs, tailored to specific blood volumes and processing requirements. Innovations focus on improving filtration efficiency, reducing membrane fouling, and minimizing hemolysis. Key advancements include the development of novel membrane materials with enhanced biocompatibility and improved leukocyte removal rates. Unique selling propositions include high filtration efficiency, low hemolysis rates, and ease of use.
Key Drivers, Barriers & Challenges in Leukocyte Reduction Filter Membranes
Key Drivers: Increasing prevalence of blood-borne diseases, stringent regulations mandating leukocyte reduction, technological advancements leading to improved filter efficiency, and rising healthcare expenditure.
Challenges: High initial investment costs for advanced filter technologies, potential supply chain disruptions due to material sourcing limitations, and intense competition among manufacturers. Regulatory hurdles and the need for continuous product improvements also pose challenges, potentially impacting the market by xx million units by 2030.
Emerging Opportunities in Leukocyte Reduction Filter Membranes
Emerging markets in developing countries present significant growth opportunities. Point-of-care devices for leukocyte reduction are gaining traction. Furthermore, the development of integrated blood processing systems incorporating leukocyte reduction filters could unlock new market segments.
Growth Accelerators in the Leukocyte Reduction Filter Membranes Industry
Technological advancements in membrane materials and filter designs, strategic partnerships between filter manufacturers and blood banks, and expansion into emerging markets are key growth accelerators. The development of novel filter technologies with improved efficiency and reduced cost will further drive market expansion.
Key Players Shaping the Leukocyte Reduction Filter Membranes Market
- Cobetter Filtration Equipment
- Pall Corporation
- Puriblood Medical
Notable Milestones in Leukocyte Reduction Filter Membranes Sector
- 2020: Pall Corporation launched a new generation of leukocyte reduction filter with enhanced efficiency.
- 2022: Cobetter Filtration Equipment secured a major contract with a large blood bank in North America.
- 2023: New regulatory guidelines on leukocyte reduction were implemented in the European Union.
In-Depth Leukocyte Reduction Filter Membranes Market Outlook
The Leukocyte Reduction Filter Membranes market is poised for robust growth, driven by continuous technological advancements, increasing demand for safe blood products, and expansion into emerging markets. Strategic partnerships and innovative product development will be crucial for players seeking to capitalize on future opportunities. The market is anticipated to maintain a strong growth trajectory throughout the forecast period, presenting attractive prospects for investors and market participants.
Leukocyte Reduction Filter Membranes Segmentation
-
1. Application
- 1.1. Human Medical
- 1.2. Animal Medical
-
2. Types
- 2.1. Whole Blood Filtration
- 2.2. Red Blood Cell Filtration
- 2.3. Platelet Filtration
Leukocyte Reduction Filter Membranes Segmentation By Geography
-
1. North America
- 1.1. United States
- 1.2. Canada
- 1.3. Mexico
-
2. South America
- 2.1. Brazil
- 2.2. Argentina
- 2.3. Rest of South America
-
3. Europe
- 3.1. United Kingdom
- 3.2. Germany
- 3.3. France
- 3.4. Italy
- 3.5. Spain
- 3.6. Russia
- 3.7. Benelux
- 3.8. Nordics
- 3.9. Rest of Europe
-
4. Middle East & Africa
- 4.1. Turkey
- 4.2. Israel
- 4.3. GCC
- 4.4. North Africa
- 4.5. South Africa
- 4.6. Rest of Middle East & Africa
-
5. Asia Pacific
- 5.1. China
- 5.2. India
- 5.3. Japan
- 5.4. South Korea
- 5.5. ASEAN
- 5.6. Oceania
- 5.7. Rest of Asia Pacific
Leukocyte Reduction Filter Membranes REPORT HIGHLIGHTS
| Aspects | Details |
|---|---|
| Study Period | 2019-2033 |
| Base Year | 2024 |
| Estimated Year | 2025 |
| Forecast Period | 2025-2033 |
| Historical Period | 2019-2024 |
| Growth Rate | CAGR of XX% from 2019-2033 |
| Segmentation |
|
Table of Contents
- 1. Introduction
- 1.1. Research Scope
- 1.2. Market Segmentation
- 1.3. Research Methodology
- 1.4. Definitions and Assumptions
- 2. Executive Summary
- 2.1. Introduction
- 3. Market Dynamics
- 3.1. Introduction
- 3.2. Market Drivers
- 3.3. Market Restrains
- 3.4. Market Trends
- 4. Market Factor Analysis
- 4.1. Porters Five Forces
- 4.2. Supply/Value Chain
- 4.3. PESTEL analysis
- 4.4. Market Entropy
- 4.5. Patent/Trademark Analysis
- 5. Global Leukocyte Reduction Filter Membranes Analysis, Insights and Forecast, 2019-2031
- 5.1. Market Analysis, Insights and Forecast - by Application
- 5.1.1. Human Medical
- 5.1.2. Animal Medical
- 5.2. Market Analysis, Insights and Forecast - by Types
- 5.2.1. Whole Blood Filtration
- 5.2.2. Red Blood Cell Filtration
- 5.2.3. Platelet Filtration
- 5.3. Market Analysis, Insights and Forecast - by Region
- 5.3.1. North America
- 5.3.2. South America
- 5.3.3. Europe
- 5.3.4. Middle East & Africa
- 5.3.5. Asia Pacific
- 5.1. Market Analysis, Insights and Forecast - by Application
- 6. North America Leukocyte Reduction Filter Membranes Analysis, Insights and Forecast, 2019-2031
- 6.1. Market Analysis, Insights and Forecast - by Application
- 6.1.1. Human Medical
- 6.1.2. Animal Medical
- 6.2. Market Analysis, Insights and Forecast - by Types
- 6.2.1. Whole Blood Filtration
- 6.2.2. Red Blood Cell Filtration
- 6.2.3. Platelet Filtration
- 6.1. Market Analysis, Insights and Forecast - by Application
- 7. South America Leukocyte Reduction Filter Membranes Analysis, Insights and Forecast, 2019-2031
- 7.1. Market Analysis, Insights and Forecast - by Application
- 7.1.1. Human Medical
- 7.1.2. Animal Medical
- 7.2. Market Analysis, Insights and Forecast - by Types
- 7.2.1. Whole Blood Filtration
- 7.2.2. Red Blood Cell Filtration
- 7.2.3. Platelet Filtration
- 7.1. Market Analysis, Insights and Forecast - by Application
- 8. Europe Leukocyte Reduction Filter Membranes Analysis, Insights and Forecast, 2019-2031
- 8.1. Market Analysis, Insights and Forecast - by Application
- 8.1.1. Human Medical
- 8.1.2. Animal Medical
- 8.2. Market Analysis, Insights and Forecast - by Types
- 8.2.1. Whole Blood Filtration
- 8.2.2. Red Blood Cell Filtration
- 8.2.3. Platelet Filtration
- 8.1. Market Analysis, Insights and Forecast - by Application
- 9. Middle East & Africa Leukocyte Reduction Filter Membranes Analysis, Insights and Forecast, 2019-2031
- 9.1. Market Analysis, Insights and Forecast - by Application
- 9.1.1. Human Medical
- 9.1.2. Animal Medical
- 9.2. Market Analysis, Insights and Forecast - by Types
- 9.2.1. Whole Blood Filtration
- 9.2.2. Red Blood Cell Filtration
- 9.2.3. Platelet Filtration
- 9.1. Market Analysis, Insights and Forecast - by Application
- 10. Asia Pacific Leukocyte Reduction Filter Membranes Analysis, Insights and Forecast, 2019-2031
- 10.1. Market Analysis, Insights and Forecast - by Application
- 10.1.1. Human Medical
- 10.1.2. Animal Medical
- 10.2. Market Analysis, Insights and Forecast - by Types
- 10.2.1. Whole Blood Filtration
- 10.2.2. Red Blood Cell Filtration
- 10.2.3. Platelet Filtration
- 10.1. Market Analysis, Insights and Forecast - by Application
- 11. Competitive Analysis
- 11.1. Global Market Share Analysis 2024
- 11.2. Company Profiles
- 11.2.1 Cobetter Filtration Equipment
- 11.2.1.1. Overview
- 11.2.1.2. Products
- 11.2.1.3. SWOT Analysis
- 11.2.1.4. Recent Developments
- 11.2.1.5. Financials (Based on Availability)
- 11.2.2 Pall Corporation
- 11.2.2.1. Overview
- 11.2.2.2. Products
- 11.2.2.3. SWOT Analysis
- 11.2.2.4. Recent Developments
- 11.2.2.5. Financials (Based on Availability)
- 11.2.3 Puriblood Medical
- 11.2.3.1. Overview
- 11.2.3.2. Products
- 11.2.3.3. SWOT Analysis
- 11.2.3.4. Recent Developments
- 11.2.3.5. Financials (Based on Availability)
- 11.2.1 Cobetter Filtration Equipment
List of Figures
- Figure 1: Global Leukocyte Reduction Filter Membranes Revenue Breakdown (million, %) by Region 2024 & 2032
- Figure 2: Global Leukocyte Reduction Filter Membranes Volume Breakdown (K, %) by Region 2024 & 2032
- Figure 3: North America Leukocyte Reduction Filter Membranes Revenue (million), by Application 2024 & 2032
- Figure 4: North America Leukocyte Reduction Filter Membranes Volume (K), by Application 2024 & 2032
- Figure 5: North America Leukocyte Reduction Filter Membranes Revenue Share (%), by Application 2024 & 2032
- Figure 6: North America Leukocyte Reduction Filter Membranes Volume Share (%), by Application 2024 & 2032
- Figure 7: North America Leukocyte Reduction Filter Membranes Revenue (million), by Types 2024 & 2032
- Figure 8: North America Leukocyte Reduction Filter Membranes Volume (K), by Types 2024 & 2032
- Figure 9: North America Leukocyte Reduction Filter Membranes Revenue Share (%), by Types 2024 & 2032
- Figure 10: North America Leukocyte Reduction Filter Membranes Volume Share (%), by Types 2024 & 2032
- Figure 11: North America Leukocyte Reduction Filter Membranes Revenue (million), by Country 2024 & 2032
- Figure 12: North America Leukocyte Reduction Filter Membranes Volume (K), by Country 2024 & 2032
- Figure 13: North America Leukocyte Reduction Filter Membranes Revenue Share (%), by Country 2024 & 2032
- Figure 14: North America Leukocyte Reduction Filter Membranes Volume Share (%), by Country 2024 & 2032
- Figure 15: South America Leukocyte Reduction Filter Membranes Revenue (million), by Application 2024 & 2032
- Figure 16: South America Leukocyte Reduction Filter Membranes Volume (K), by Application 2024 & 2032
- Figure 17: South America Leukocyte Reduction Filter Membranes Revenue Share (%), by Application 2024 & 2032
- Figure 18: South America Leukocyte Reduction Filter Membranes Volume Share (%), by Application 2024 & 2032
- Figure 19: South America Leukocyte Reduction Filter Membranes Revenue (million), by Types 2024 & 2032
- Figure 20: South America Leukocyte Reduction Filter Membranes Volume (K), by Types 2024 & 2032
- Figure 21: South America Leukocyte Reduction Filter Membranes Revenue Share (%), by Types 2024 & 2032
- Figure 22: South America Leukocyte Reduction Filter Membranes Volume Share (%), by Types 2024 & 2032
- Figure 23: South America Leukocyte Reduction Filter Membranes Revenue (million), by Country 2024 & 2032
- Figure 24: South America Leukocyte Reduction Filter Membranes Volume (K), by Country 2024 & 2032
- Figure 25: South America Leukocyte Reduction Filter Membranes Revenue Share (%), by Country 2024 & 2032
- Figure 26: South America Leukocyte Reduction Filter Membranes Volume Share (%), by Country 2024 & 2032
- Figure 27: Europe Leukocyte Reduction Filter Membranes Revenue (million), by Application 2024 & 2032
- Figure 28: Europe Leukocyte Reduction Filter Membranes Volume (K), by Application 2024 & 2032
- Figure 29: Europe Leukocyte Reduction Filter Membranes Revenue Share (%), by Application 2024 & 2032
- Figure 30: Europe Leukocyte Reduction Filter Membranes Volume Share (%), by Application 2024 & 2032
- Figure 31: Europe Leukocyte Reduction Filter Membranes Revenue (million), by Types 2024 & 2032
- Figure 32: Europe Leukocyte Reduction Filter Membranes Volume (K), by Types 2024 & 2032
- Figure 33: Europe Leukocyte Reduction Filter Membranes Revenue Share (%), by Types 2024 & 2032
- Figure 34: Europe Leukocyte Reduction Filter Membranes Volume Share (%), by Types 2024 & 2032
- Figure 35: Europe Leukocyte Reduction Filter Membranes Revenue (million), by Country 2024 & 2032
- Figure 36: Europe Leukocyte Reduction Filter Membranes Volume (K), by Country 2024 & 2032
- Figure 37: Europe Leukocyte Reduction Filter Membranes Revenue Share (%), by Country 2024 & 2032
- Figure 38: Europe Leukocyte Reduction Filter Membranes Volume Share (%), by Country 2024 & 2032
- Figure 39: Middle East & Africa Leukocyte Reduction Filter Membranes Revenue (million), by Application 2024 & 2032
- Figure 40: Middle East & Africa Leukocyte Reduction Filter Membranes Volume (K), by Application 2024 & 2032
- Figure 41: Middle East & Africa Leukocyte Reduction Filter Membranes Revenue Share (%), by Application 2024 & 2032
- Figure 42: Middle East & Africa Leukocyte Reduction Filter Membranes Volume Share (%), by Application 2024 & 2032
- Figure 43: Middle East & Africa Leukocyte Reduction Filter Membranes Revenue (million), by Types 2024 & 2032
- Figure 44: Middle East & Africa Leukocyte Reduction Filter Membranes Volume (K), by Types 2024 & 2032
- Figure 45: Middle East & Africa Leukocyte Reduction Filter Membranes Revenue Share (%), by Types 2024 & 2032
- Figure 46: Middle East & Africa Leukocyte Reduction Filter Membranes Volume Share (%), by Types 2024 & 2032
- Figure 47: Middle East & Africa Leukocyte Reduction Filter Membranes Revenue (million), by Country 2024 & 2032
- Figure 48: Middle East & Africa Leukocyte Reduction Filter Membranes Volume (K), by Country 2024 & 2032
- Figure 49: Middle East & Africa Leukocyte Reduction Filter Membranes Revenue Share (%), by Country 2024 & 2032
- Figure 50: Middle East & Africa Leukocyte Reduction Filter Membranes Volume Share (%), by Country 2024 & 2032
- Figure 51: Asia Pacific Leukocyte Reduction Filter Membranes Revenue (million), by Application 2024 & 2032
- Figure 52: Asia Pacific Leukocyte Reduction Filter Membranes Volume (K), by Application 2024 & 2032
- Figure 53: Asia Pacific Leukocyte Reduction Filter Membranes Revenue Share (%), by Application 2024 & 2032
- Figure 54: Asia Pacific Leukocyte Reduction Filter Membranes Volume Share (%), by Application 2024 & 2032
- Figure 55: Asia Pacific Leukocyte Reduction Filter Membranes Revenue (million), by Types 2024 & 2032
- Figure 56: Asia Pacific Leukocyte Reduction Filter Membranes Volume (K), by Types 2024 & 2032
- Figure 57: Asia Pacific Leukocyte Reduction Filter Membranes Revenue Share (%), by Types 2024 & 2032
- Figure 58: Asia Pacific Leukocyte Reduction Filter Membranes Volume Share (%), by Types 2024 & 2032
- Figure 59: Asia Pacific Leukocyte Reduction Filter Membranes Revenue (million), by Country 2024 & 2032
- Figure 60: Asia Pacific Leukocyte Reduction Filter Membranes Volume (K), by Country 2024 & 2032
- Figure 61: Asia Pacific Leukocyte Reduction Filter Membranes Revenue Share (%), by Country 2024 & 2032
- Figure 62: Asia Pacific Leukocyte Reduction Filter Membranes Volume Share (%), by Country 2024 & 2032
List of Tables
- Table 1: Global Leukocyte Reduction Filter Membranes Revenue million Forecast, by Region 2019 & 2032
- Table 2: Global Leukocyte Reduction Filter Membranes Volume K Forecast, by Region 2019 & 2032
- Table 3: Global Leukocyte Reduction Filter Membranes Revenue million Forecast, by Application 2019 & 2032
- Table 4: Global Leukocyte Reduction Filter Membranes Volume K Forecast, by Application 2019 & 2032
- Table 5: Global Leukocyte Reduction Filter Membranes Revenue million Forecast, by Types 2019 & 2032
- Table 6: Global Leukocyte Reduction Filter Membranes Volume K Forecast, by Types 2019 & 2032
- Table 7: Global Leukocyte Reduction Filter Membranes Revenue million Forecast, by Region 2019 & 2032
- Table 8: Global Leukocyte Reduction Filter Membranes Volume K Forecast, by Region 2019 & 2032
- Table 9: Global Leukocyte Reduction Filter Membranes Revenue million Forecast, by Application 2019 & 2032
- Table 10: Global Leukocyte Reduction Filter Membranes Volume K Forecast, by Application 2019 & 2032
- Table 11: Global Leukocyte Reduction Filter Membranes Revenue million Forecast, by Types 2019 & 2032
- Table 12: Global Leukocyte Reduction Filter Membranes Volume K Forecast, by Types 2019 & 2032
- Table 13: Global Leukocyte Reduction Filter Membranes Revenue million Forecast, by Country 2019 & 2032
- Table 14: Global Leukocyte Reduction Filter Membranes Volume K Forecast, by Country 2019 & 2032
- Table 15: United States Leukocyte Reduction Filter Membranes Revenue (million) Forecast, by Application 2019 & 2032
- Table 16: United States Leukocyte Reduction Filter Membranes Volume (K) Forecast, by Application 2019 & 2032
- Table 17: Canada Leukocyte Reduction Filter Membranes Revenue (million) Forecast, by Application 2019 & 2032
- Table 18: Canada Leukocyte Reduction Filter Membranes Volume (K) Forecast, by Application 2019 & 2032
- Table 19: Mexico Leukocyte Reduction Filter Membranes Revenue (million) Forecast, by Application 2019 & 2032
- Table 20: Mexico Leukocyte Reduction Filter Membranes Volume (K) Forecast, by Application 2019 & 2032
- Table 21: Global Leukocyte Reduction Filter Membranes Revenue million Forecast, by Application 2019 & 2032
- Table 22: Global Leukocyte Reduction Filter Membranes Volume K Forecast, by Application 2019 & 2032
- Table 23: Global Leukocyte Reduction Filter Membranes Revenue million Forecast, by Types 2019 & 2032
- Table 24: Global Leukocyte Reduction Filter Membranes Volume K Forecast, by Types 2019 & 2032
- Table 25: Global Leukocyte Reduction Filter Membranes Revenue million Forecast, by Country 2019 & 2032
- Table 26: Global Leukocyte Reduction Filter Membranes Volume K Forecast, by Country 2019 & 2032
- Table 27: Brazil Leukocyte Reduction Filter Membranes Revenue (million) Forecast, by Application 2019 & 2032
- Table 28: Brazil Leukocyte Reduction Filter Membranes Volume (K) Forecast, by Application 2019 & 2032
- Table 29: Argentina Leukocyte Reduction Filter Membranes Revenue (million) Forecast, by Application 2019 & 2032
- Table 30: Argentina Leukocyte Reduction Filter Membranes Volume (K) Forecast, by Application 2019 & 2032
- Table 31: Rest of South America Leukocyte Reduction Filter Membranes Revenue (million) Forecast, by Application 2019 & 2032
- Table 32: Rest of South America Leukocyte Reduction Filter Membranes Volume (K) Forecast, by Application 2019 & 2032
- Table 33: Global Leukocyte Reduction Filter Membranes Revenue million Forecast, by Application 2019 & 2032
- Table 34: Global Leukocyte Reduction Filter Membranes Volume K Forecast, by Application 2019 & 2032
- Table 35: Global Leukocyte Reduction Filter Membranes Revenue million Forecast, by Types 2019 & 2032
- Table 36: Global Leukocyte Reduction Filter Membranes Volume K Forecast, by Types 2019 & 2032
- Table 37: Global Leukocyte Reduction Filter Membranes Revenue million Forecast, by Country 2019 & 2032
- Table 38: Global Leukocyte Reduction Filter Membranes Volume K Forecast, by Country 2019 & 2032
- Table 39: United Kingdom Leukocyte Reduction Filter Membranes Revenue (million) Forecast, by Application 2019 & 2032
- Table 40: United Kingdom Leukocyte Reduction Filter Membranes Volume (K) Forecast, by Application 2019 & 2032
- Table 41: Germany Leukocyte Reduction Filter Membranes Revenue (million) Forecast, by Application 2019 & 2032
- Table 42: Germany Leukocyte Reduction Filter Membranes Volume (K) Forecast, by Application 2019 & 2032
- Table 43: France Leukocyte Reduction Filter Membranes Revenue (million) Forecast, by Application 2019 & 2032
- Table 44: France Leukocyte Reduction Filter Membranes Volume (K) Forecast, by Application 2019 & 2032
- Table 45: Italy Leukocyte Reduction Filter Membranes Revenue (million) Forecast, by Application 2019 & 2032
- Table 46: Italy Leukocyte Reduction Filter Membranes Volume (K) Forecast, by Application 2019 & 2032
- Table 47: Spain Leukocyte Reduction Filter Membranes Revenue (million) Forecast, by Application 2019 & 2032
- Table 48: Spain Leukocyte Reduction Filter Membranes Volume (K) Forecast, by Application 2019 & 2032
- Table 49: Russia Leukocyte Reduction Filter Membranes Revenue (million) Forecast, by Application 2019 & 2032
- Table 50: Russia Leukocyte Reduction Filter Membranes Volume (K) Forecast, by Application 2019 & 2032
- Table 51: Benelux Leukocyte Reduction Filter Membranes Revenue (million) Forecast, by Application 2019 & 2032
- Table 52: Benelux Leukocyte Reduction Filter Membranes Volume (K) Forecast, by Application 2019 & 2032
- Table 53: Nordics Leukocyte Reduction Filter Membranes Revenue (million) Forecast, by Application 2019 & 2032
- Table 54: Nordics Leukocyte Reduction Filter Membranes Volume (K) Forecast, by Application 2019 & 2032
- Table 55: Rest of Europe Leukocyte Reduction Filter Membranes Revenue (million) Forecast, by Application 2019 & 2032
- Table 56: Rest of Europe Leukocyte Reduction Filter Membranes Volume (K) Forecast, by Application 2019 & 2032
- Table 57: Global Leukocyte Reduction Filter Membranes Revenue million Forecast, by Application 2019 & 2032
- Table 58: Global Leukocyte Reduction Filter Membranes Volume K Forecast, by Application 2019 & 2032
- Table 59: Global Leukocyte Reduction Filter Membranes Revenue million Forecast, by Types 2019 & 2032
- Table 60: Global Leukocyte Reduction Filter Membranes Volume K Forecast, by Types 2019 & 2032
- Table 61: Global Leukocyte Reduction Filter Membranes Revenue million Forecast, by Country 2019 & 2032
- Table 62: Global Leukocyte Reduction Filter Membranes Volume K Forecast, by Country 2019 & 2032
- Table 63: Turkey Leukocyte Reduction Filter Membranes Revenue (million) Forecast, by Application 2019 & 2032
- Table 64: Turkey Leukocyte Reduction Filter Membranes Volume (K) Forecast, by Application 2019 & 2032
- Table 65: Israel Leukocyte Reduction Filter Membranes Revenue (million) Forecast, by Application 2019 & 2032
- Table 66: Israel Leukocyte Reduction Filter Membranes Volume (K) Forecast, by Application 2019 & 2032
- Table 67: GCC Leukocyte Reduction Filter Membranes Revenue (million) Forecast, by Application 2019 & 2032
- Table 68: GCC Leukocyte Reduction Filter Membranes Volume (K) Forecast, by Application 2019 & 2032
- Table 69: North Africa Leukocyte Reduction Filter Membranes Revenue (million) Forecast, by Application 2019 & 2032
- Table 70: North Africa Leukocyte Reduction Filter Membranes Volume (K) Forecast, by Application 2019 & 2032
- Table 71: South Africa Leukocyte Reduction Filter Membranes Revenue (million) Forecast, by Application 2019 & 2032
- Table 72: South Africa Leukocyte Reduction Filter Membranes Volume (K) Forecast, by Application 2019 & 2032
- Table 73: Rest of Middle East & Africa Leukocyte Reduction Filter Membranes Revenue (million) Forecast, by Application 2019 & 2032
- Table 74: Rest of Middle East & Africa Leukocyte Reduction Filter Membranes Volume (K) Forecast, by Application 2019 & 2032
- Table 75: Global Leukocyte Reduction Filter Membranes Revenue million Forecast, by Application 2019 & 2032
- Table 76: Global Leukocyte Reduction Filter Membranes Volume K Forecast, by Application 2019 & 2032
- Table 77: Global Leukocyte Reduction Filter Membranes Revenue million Forecast, by Types 2019 & 2032
- Table 78: Global Leukocyte Reduction Filter Membranes Volume K Forecast, by Types 2019 & 2032
- Table 79: Global Leukocyte Reduction Filter Membranes Revenue million Forecast, by Country 2019 & 2032
- Table 80: Global Leukocyte Reduction Filter Membranes Volume K Forecast, by Country 2019 & 2032
- Table 81: China Leukocyte Reduction Filter Membranes Revenue (million) Forecast, by Application 2019 & 2032
- Table 82: China Leukocyte Reduction Filter Membranes Volume (K) Forecast, by Application 2019 & 2032
- Table 83: India Leukocyte Reduction Filter Membranes Revenue (million) Forecast, by Application 2019 & 2032
- Table 84: India Leukocyte Reduction Filter Membranes Volume (K) Forecast, by Application 2019 & 2032
- Table 85: Japan Leukocyte Reduction Filter Membranes Revenue (million) Forecast, by Application 2019 & 2032
- Table 86: Japan Leukocyte Reduction Filter Membranes Volume (K) Forecast, by Application 2019 & 2032
- Table 87: South Korea Leukocyte Reduction Filter Membranes Revenue (million) Forecast, by Application 2019 & 2032
- Table 88: South Korea Leukocyte Reduction Filter Membranes Volume (K) Forecast, by Application 2019 & 2032
- Table 89: ASEAN Leukocyte Reduction Filter Membranes Revenue (million) Forecast, by Application 2019 & 2032
- Table 90: ASEAN Leukocyte Reduction Filter Membranes Volume (K) Forecast, by Application 2019 & 2032
- Table 91: Oceania Leukocyte Reduction Filter Membranes Revenue (million) Forecast, by Application 2019 & 2032
- Table 92: Oceania Leukocyte Reduction Filter Membranes Volume (K) Forecast, by Application 2019 & 2032
- Table 93: Rest of Asia Pacific Leukocyte Reduction Filter Membranes Revenue (million) Forecast, by Application 2019 & 2032
- Table 94: Rest of Asia Pacific Leukocyte Reduction Filter Membranes Volume (K) Forecast, by Application 2019 & 2032
Frequently Asked Questions
1. What is the projected Compound Annual Growth Rate (CAGR) of the Leukocyte Reduction Filter Membranes?
The projected CAGR is approximately XX%.
2. Which companies are prominent players in the Leukocyte Reduction Filter Membranes?
Key companies in the market include Cobetter Filtration Equipment, Pall Corporation, Puriblood Medical.
3. What are the main segments of the Leukocyte Reduction Filter Membranes?
The market segments include Application, Types.
4. Can you provide details about the market size?
The market size is estimated to be USD XXX million as of 2022.
5. What are some drivers contributing to market growth?
N/A
6. What are the notable trends driving market growth?
N/A
7. Are there any restraints impacting market growth?
N/A
8. Can you provide examples of recent developments in the market?
N/A
9. What pricing options are available for accessing the report?
Pricing options include single-user, multi-user, and enterprise licenses priced at USD 3350.00, USD 5025.00, and USD 6700.00 respectively.
10. Is the market size provided in terms of value or volume?
The market size is provided in terms of value, measured in million and volume, measured in K.
11. Are there any specific market keywords associated with the report?
Yes, the market keyword associated with the report is "Leukocyte Reduction Filter Membranes," which aids in identifying and referencing the specific market segment covered.
12. How do I determine which pricing option suits my needs best?
The pricing options vary based on user requirements and access needs. Individual users may opt for single-user licenses, while businesses requiring broader access may choose multi-user or enterprise licenses for cost-effective access to the report.
13. Are there any additional resources or data provided in the Leukocyte Reduction Filter Membranes report?
While the report offers comprehensive insights, it's advisable to review the specific contents or supplementary materials provided to ascertain if additional resources or data are available.
14. How can I stay updated on further developments or reports in the Leukocyte Reduction Filter Membranes?
To stay informed about further developments, trends, and reports in the Leukocyte Reduction Filter Membranes, consider subscribing to industry newsletters, following relevant companies and organizations, or regularly checking reputable industry news sources and publications.
Methodology
Step 1 - Identification of Relevant Samples Size from Population Database


Step 2 - Approaches for Defining Global Market Size (Value, Volume* & Price*)

Note*: In applicable scenarios
Step 3 - Data Sources
Primary Research
- Web Analytics
- Survey Reports
- Research Institute
- Latest Research Reports
- Opinion Leaders
Secondary Research
- Annual Reports
- White Paper
- Latest Press Release
- Industry Association
- Paid Database
- Investor Presentations

Step 4 - Data Triangulation
Involves using different sources of information in order to increase the validity of a study
These sources are likely to be stakeholders in a program - participants, other researchers, program staff, other community members, and so on.
Then we put all data in single framework & apply various statistical tools to find out the dynamic on the market.
During the analysis stage, feedback from the stakeholder groups would be compared to determine areas of agreement as well as areas of divergence
