

Key Insights
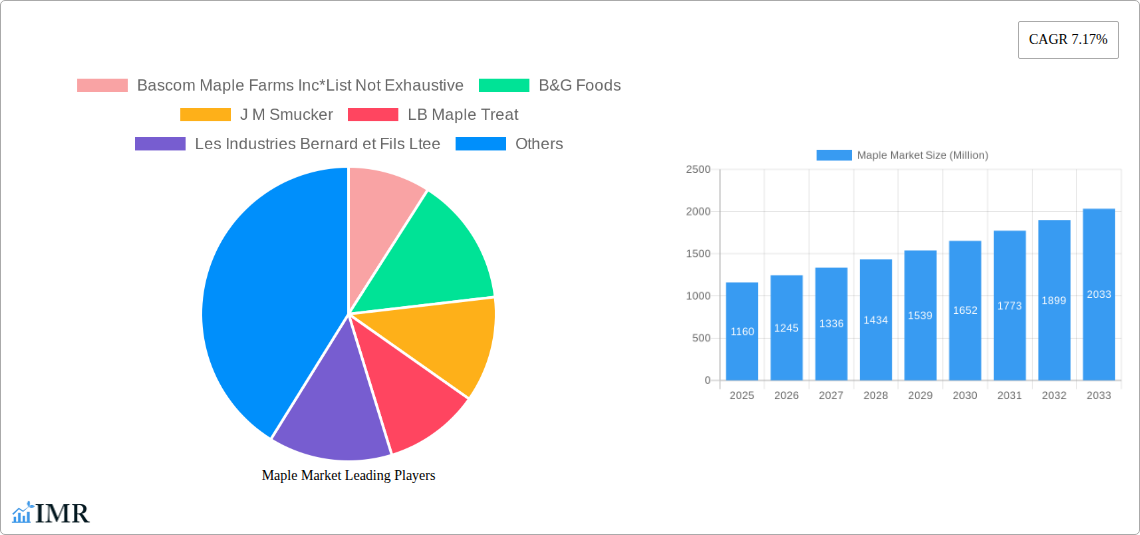
The global maple syrup market, valued at $1.16 billion in 2025, is projected to experience robust growth, exhibiting a Compound Annual Growth Rate (CAGR) of 7.17% from 2025 to 2033. This expansion is driven by several key factors. Increasing consumer awareness of the health benefits associated with maple syrup, particularly its rich antioxidant content and lower glycemic index compared to refined sugars, fuels demand. The rising popularity of maple syrup as a natural sweetener in various food and beverage applications, from pancakes and waffles to baked goods and even savory dishes, further contributes to market growth. Furthermore, the burgeoning demand for organic and ethically sourced food products is boosting the segment of organic maple syrup. The expanding food service industry, particularly cafes and restaurants offering gourmet breakfast options, is also a significant driver. Growth is further supported by innovative product development, with manufacturers introducing maple-flavored syrups, candies, and other confectionery items, broadening the appeal beyond traditional uses. Geographic expansion into new markets, particularly in Asia and South America, where awareness of maple syrup is increasing, presents considerable opportunities for future growth.
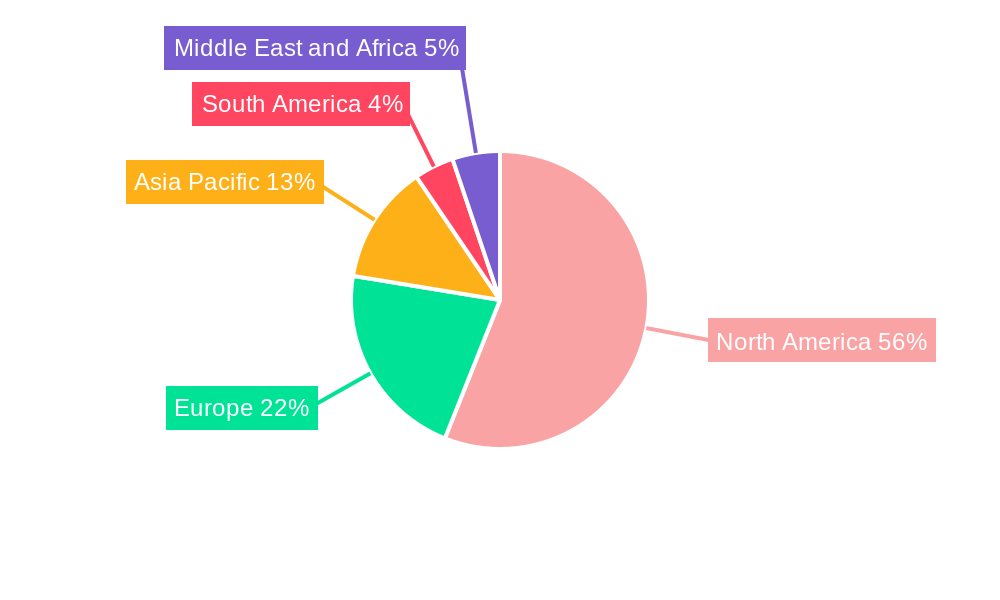
However, certain challenges exist. Price fluctuations due to seasonal production and weather conditions can impact profitability. Competition from other sweeteners, including artificial sweeteners and honey, poses a threat. Ensuring sustainable harvesting practices to protect maple tree populations is also crucial for long-term market sustainability. The market is segmented by product type (black maple, red maple, sugar maple), distribution channel (supermarkets, convenience stores, online retail), and product form (organic vs. conventional). North America currently dominates the market, given its established maple syrup production and consumption patterns, but Europe and Asia-Pacific regions represent significant growth potential. Major players such as Bascom Maple Farms, B&G Foods, and J.M. Smucker are key competitors, constantly striving for innovation and brand enhancement to maintain their market share. The forecast period of 2025-2033 promises further market expansion fueled by both consumer trends and industry innovation.
Maple Market: A Comprehensive Market Report (2019-2033)
This in-depth report provides a comprehensive analysis of the global maple market, encompassing market dynamics, growth trends, regional insights, and key player strategies. Covering the historical period (2019-2024), base year (2025), and forecast period (2025-2033), this report is an essential resource for industry professionals seeking to navigate this dynamic market. The report segments the market by category (organic, conventional), type (black maple, red maple, sugar maple), and distribution channel (supermarket & hypermarket, convenience stores, specialty stores, online retail stores, other). The total market size is projected to reach xx Million by 2033.
Maple Market Dynamics & Structure
The maple market is characterized by a moderate level of concentration, with key players like J M Smucker, B&G Foods, and the Federation of Quebec Maple Syrup Producers holding significant market share. Technological innovation, particularly in processing and packaging, plays a crucial role. Stringent regulatory frameworks regarding food safety and labeling influence production practices. While honey and other sweeteners represent competitive substitutes, maple syrup maintains its distinct flavor profile and premium positioning. Consumer demand is influenced by health consciousness and increasing interest in natural sweeteners. M&A activity has been relatively moderate in recent years, with a focus on streamlining operations and optimizing supply chains. The total number of M&A deals in the period 2019-2024 is estimated at xx.
- Market Concentration: Moderately concentrated, with top 5 players holding approximately xx% market share.
- Technological Innovation: Focus on automation, efficient extraction techniques, and innovative packaging solutions.
- Regulatory Framework: Stringent food safety and labeling regulations impacting production and distribution.
- Competitive Substitutes: Honey, agave nectar, and artificial sweeteners pose competitive challenges.
- End-User Demographics: Growing demand driven by health-conscious consumers and premium product preference.
- M&A Trends: Consolidation through mergers and acquisitions focused on supply chain optimization (xx deals between 2019-2024).
Maple Market Growth Trends & Insights
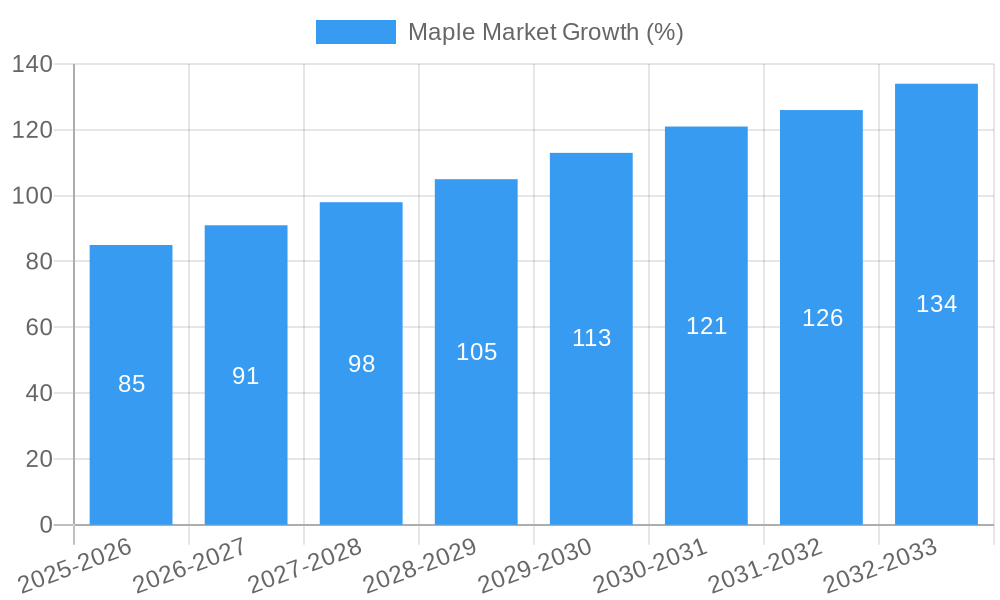
The global maple market experienced steady growth during the historical period (2019-2024), driven by increasing consumer preference for natural sweeteners and the rising popularity of maple syrup in various food and beverage applications. The market size reached xx Million in 2024, exhibiting a CAGR of xx% during this period. Technological advancements, including improved processing techniques and innovative packaging solutions, have contributed to market expansion. Consumer behavior shifts toward healthier food choices have further boosted market growth. The forecast period (2025-2033) projects continued growth, with market size anticipated to reach xx Million in 2033, driven by increasing product diversification, expanding distribution channels, and the rising prevalence of online retail. The CAGR for the forecast period is estimated at xx%. Market penetration, particularly in emerging economies, shows significant potential for future growth.
Dominant Regions, Countries, or Segments in Maple Market
North America, specifically Canada and the United States, dominates the global maple market, accounting for approximately xx% of global production in 2024. The strong presence of established producers, favorable climatic conditions, and high consumer demand are key factors contributing to this dominance. Within the segment breakdown:
- Category: Organic maple syrup is experiencing a higher growth rate compared to conventional, reflecting the increasing demand for organic and sustainably sourced products.
- Type: Sugar maple syrup holds the largest market share due to its widespread availability and consumer preference.
- Distribution Channel: Supermarket and hypermarkets are the dominant distribution channel, followed by specialty stores catering to premium segments. Online retail is an emerging channel with significant growth potential.
The growth in these regions is driven by:
- Strong consumer preference for maple syrup.
- Established production infrastructure and efficient supply chains.
- Government support for maple syrup production and export.
Maple Market Product Landscape
Product innovation in the maple market focuses primarily on enhancing the product's versatility and expanding its applications beyond traditional uses. This includes introducing flavored maple syrups, maple-infused confectionery items, and maple-based sauces and condiments. Technological advancements in processing allow for improved quality control, extending shelf life, and maintaining the syrup's flavor profile. Unique selling propositions emphasize the natural sweetness, health benefits, and versatility of maple syrup.
Key Drivers, Barriers & Challenges in Maple Market
Key Drivers:
- Growing consumer preference for natural sweeteners and healthy food options.
- Increasing demand for versatile and premium food ingredients.
- Expansion of distribution channels and online retail.
- Technological advancements in processing and packaging.
Key Challenges & Restraints:
- Fluctuations in maple sap production due to weather conditions.
- Intense competition from other sweeteners and substitute products.
- Increasing raw material costs and rising energy prices. This results in an estimated xx% increase in production costs from 2024 to 2025.
- Stringent regulations and food safety standards.
Emerging Opportunities in Maple Market
Emerging opportunities include expansion into new geographical markets, particularly in Asia and Europe, where awareness and acceptance of maple syrup are growing. Innovation in product formats, such as maple-infused beverages and ready-to-eat meals, presents significant growth prospects. Targeting specific consumer segments, such as health-conscious individuals and gourmet food enthusiasts, creates lucrative opportunities. Additionally, the development of sustainable and ethical sourcing practices will become increasingly important.
Growth Accelerators in the Maple Market Industry
Long-term growth in the maple market will be accelerated by strategic partnerships between maple producers and food and beverage companies to develop innovative products. Technological advancements in processing and extraction methods will enhance production efficiency and reduce costs. Market expansion into new geographical regions and tapping into unmet consumer demands will further propel growth. Sustainable sourcing practices and environmental considerations will increasingly influence consumer choices, driving demand for eco-friendly maple products.
Key Players Shaping the Maple Market Market
- Bascom Maple Farms Inc
- B&G Foods
- J M Smucker
- LB Maple Treat
- Les Industries Bernard et Fils Ltee
- Federation of Quebec Maple Syrup Producers
- Vermont Maple Sugar Maker Association
- Thompsons maple product
- Bascom family farms
- HJ Heinz Company
Notable Milestones in Maple Market Sector
- December 2021: The Federation of Quebec Maple Syrup Producers released more than half of its syrup stockpile, impacting market prices.
- August 2021: B&G Foods sold its Portland manufacturing facility, potentially affecting its production capacity.
- March 2022: PepsiCo's limited-edition maple syrup cola created significant buzz and increased maple syrup visibility.
In-Depth Maple Market Market Outlook
The maple market is poised for continued growth, driven by evolving consumer preferences, product innovation, and expansion into new markets. Strategic partnerships and investments in sustainable practices will play a crucial role in shaping the industry's future. The market's long-term potential is significant, with untapped opportunities in emerging economies and new product applications. Companies that prioritize innovation, sustainability, and efficient supply chains will be best positioned to capitalize on the market's growth trajectory.
Maple Market Segmentation
-
1. Category
- 1.1. Organic
- 1.2. Conventional
-
2. Type
- 2.1. Black Maple
- 2.2. Red Maple
- 2.3. Sugar Maple
-
3. Distribution Channel
- 3.1. Supermarket and Hypermarket
- 3.2. Convenience Store
- 3.3. Specialty Stores
- 3.4. Online Retail Stores
- 3.5. Other Distribution Channels
Maple Market Segmentation By Geography
-
1. North America
- 1.1. United States
- 1.2. Canada
- 1.3. Mexico
- 1.4. Rest of North America
-
2. Europe
- 2.1. Germany
- 2.2. United Kingdom
- 2.3. France
- 2.4. Russia
- 2.5. Spain
- 2.6. Italy
- 2.7. Rest of Europe
-
3. Asia Pacific
- 3.1. India
- 3.2. China
- 3.3. Japan
- 3.4. Rest of Asia Pacific
-
4. South America
- 4.1. Brazil
- 4.2. Argentina
- 4.3. Rest of South America
-
5. Middle East and Africa
- 5.1. United Arab Emirates
- 5.2. South Africa
- 5.3. Rest of Middle East and Africa
Maple Market REPORT HIGHLIGHTS
| Aspects | Details |
|---|---|
| Study Period | 2019-2033 |
| Base Year | 2024 |
| Estimated Year | 2025 |
| Forecast Period | 2025-2033 |
| Historical Period | 2019-2024 |
| Growth Rate | CAGR of 7.17% from 2019-2033 |
| Segmentation |
|
Table of Contents
- 1. Introduction
- 1.1. Research Scope
- 1.2. Market Segmentation
- 1.3. Research Methodology
- 1.4. Definitions and Assumptions
- 2. Executive Summary
- 2.1. Introduction
- 3. Market Dynamics
- 3.1. Introduction
- 3.2. Market Drivers
- 3.2.1. Prevalence of Lactose Intolerance Driving the Market; Growing Influence of Healthy Lifestyle Trends and Rising Non-Traditional Users
- 3.3. Market Restrains
- 3.3.1. Wide Availability of Alternative Protein Sources
- 3.4. Market Trends
- 3.4.1. Utilization of Maple Syrup as a Flavoring Agent
- 4. Market Factor Analysis
- 4.1. Porters Five Forces
- 4.2. Supply/Value Chain
- 4.3. PESTEL analysis
- 4.4. Market Entropy
- 4.5. Patent/Trademark Analysis
- 5. Global Maple Market Analysis, Insights and Forecast, 2019-2031
- 5.1. Market Analysis, Insights and Forecast - by Category
- 5.1.1. Organic
- 5.1.2. Conventional
- 5.2. Market Analysis, Insights and Forecast - by Type
- 5.2.1. Black Maple
- 5.2.2. Red Maple
- 5.2.3. Sugar Maple
- 5.3. Market Analysis, Insights and Forecast - by Distribution Channel
- 5.3.1. Supermarket and Hypermarket
- 5.3.2. Convenience Store
- 5.3.3. Specialty Stores
- 5.3.4. Online Retail Stores
- 5.3.5. Other Distribution Channels
- 5.4. Market Analysis, Insights and Forecast - by Region
- 5.4.1. North America
- 5.4.2. Europe
- 5.4.3. Asia Pacific
- 5.4.4. South America
- 5.4.5. Middle East and Africa
- 5.1. Market Analysis, Insights and Forecast - by Category
- 6. North America Maple Market Analysis, Insights and Forecast, 2019-2031
- 6.1. Market Analysis, Insights and Forecast - by Category
- 6.1.1. Organic
- 6.1.2. Conventional
- 6.2. Market Analysis, Insights and Forecast - by Type
- 6.2.1. Black Maple
- 6.2.2. Red Maple
- 6.2.3. Sugar Maple
- 6.3. Market Analysis, Insights and Forecast - by Distribution Channel
- 6.3.1. Supermarket and Hypermarket
- 6.3.2. Convenience Store
- 6.3.3. Specialty Stores
- 6.3.4. Online Retail Stores
- 6.3.5. Other Distribution Channels
- 6.1. Market Analysis, Insights and Forecast - by Category
- 7. Europe Maple Market Analysis, Insights and Forecast, 2019-2031
- 7.1. Market Analysis, Insights and Forecast - by Category
- 7.1.1. Organic
- 7.1.2. Conventional
- 7.2. Market Analysis, Insights and Forecast - by Type
- 7.2.1. Black Maple
- 7.2.2. Red Maple
- 7.2.3. Sugar Maple
- 7.3. Market Analysis, Insights and Forecast - by Distribution Channel
- 7.3.1. Supermarket and Hypermarket
- 7.3.2. Convenience Store
- 7.3.3. Specialty Stores
- 7.3.4. Online Retail Stores
- 7.3.5. Other Distribution Channels
- 7.1. Market Analysis, Insights and Forecast - by Category
- 8. Asia Pacific Maple Market Analysis, Insights and Forecast, 2019-2031
- 8.1. Market Analysis, Insights and Forecast - by Category
- 8.1.1. Organic
- 8.1.2. Conventional
- 8.2. Market Analysis, Insights and Forecast - by Type
- 8.2.1. Black Maple
- 8.2.2. Red Maple
- 8.2.3. Sugar Maple
- 8.3. Market Analysis, Insights and Forecast - by Distribution Channel
- 8.3.1. Supermarket and Hypermarket
- 8.3.2. Convenience Store
- 8.3.3. Specialty Stores
- 8.3.4. Online Retail Stores
- 8.3.5. Other Distribution Channels
- 8.1. Market Analysis, Insights and Forecast - by Category
- 9. South America Maple Market Analysis, Insights and Forecast, 2019-2031
- 9.1. Market Analysis, Insights and Forecast - by Category
- 9.1.1. Organic
- 9.1.2. Conventional
- 9.2. Market Analysis, Insights and Forecast - by Type
- 9.2.1. Black Maple
- 9.2.2. Red Maple
- 9.2.3. Sugar Maple
- 9.3. Market Analysis, Insights and Forecast - by Distribution Channel
- 9.3.1. Supermarket and Hypermarket
- 9.3.2. Convenience Store
- 9.3.3. Specialty Stores
- 9.3.4. Online Retail Stores
- 9.3.5. Other Distribution Channels
- 9.1. Market Analysis, Insights and Forecast - by Category
- 10. Middle East and Africa Maple Market Analysis, Insights and Forecast, 2019-2031
- 10.1. Market Analysis, Insights and Forecast - by Category
- 10.1.1. Organic
- 10.1.2. Conventional
- 10.2. Market Analysis, Insights and Forecast - by Type
- 10.2.1. Black Maple
- 10.2.2. Red Maple
- 10.2.3. Sugar Maple
- 10.3. Market Analysis, Insights and Forecast - by Distribution Channel
- 10.3.1. Supermarket and Hypermarket
- 10.3.2. Convenience Store
- 10.3.3. Specialty Stores
- 10.3.4. Online Retail Stores
- 10.3.5. Other Distribution Channels
- 10.1. Market Analysis, Insights and Forecast - by Category
- 11. North America Maple Market Analysis, Insights and Forecast, 2019-2031
- 11.1. Market Analysis, Insights and Forecast - By Country/Sub-region
- 11.1.1 United States
- 11.1.2 Canada
- 11.1.3 Mexico
- 11.1.4 Rest of North America
- 12. Europe Maple Market Analysis, Insights and Forecast, 2019-2031
- 12.1. Market Analysis, Insights and Forecast - By Country/Sub-region
- 12.1.1 Germany
- 12.1.2 United Kingdom
- 12.1.3 France
- 12.1.4 Russia
- 12.1.5 Spain
- 12.1.6 Italy
- 12.1.7 Rest of Europe
- 13. Asia Pacific Maple Market Analysis, Insights and Forecast, 2019-2031
- 13.1. Market Analysis, Insights and Forecast - By Country/Sub-region
- 13.1.1 India
- 13.1.2 China
- 13.1.3 Japan
- 13.1.4 Rest of Asia Pacific
- 14. South America Maple Market Analysis, Insights and Forecast, 2019-2031
- 14.1. Market Analysis, Insights and Forecast - By Country/Sub-region
- 14.1.1 Brazil
- 14.1.2 Argentina
- 14.1.3 Rest of South America
- 15. Middle East and Africa Maple Market Analysis, Insights and Forecast, 2019-2031
- 15.1. Market Analysis, Insights and Forecast - By Country/Sub-region
- 15.1.1 United Arab Emirates
- 15.1.2 South Africa
- 15.1.3 Rest of Middle East and Africa
- 16. Competitive Analysis
- 16.1. Global Market Share Analysis 2024
- 16.2. Company Profiles
- 16.2.1 Bascom Maple Farms Inc*List Not Exhaustive
- 16.2.1.1. Overview
- 16.2.1.2. Products
- 16.2.1.3. SWOT Analysis
- 16.2.1.4. Recent Developments
- 16.2.1.5. Financials (Based on Availability)
- 16.2.2 B&G Foods
- 16.2.2.1. Overview
- 16.2.2.2. Products
- 16.2.2.3. SWOT Analysis
- 16.2.2.4. Recent Developments
- 16.2.2.5. Financials (Based on Availability)
- 16.2.3 J M Smucker
- 16.2.3.1. Overview
- 16.2.3.2. Products
- 16.2.3.3. SWOT Analysis
- 16.2.3.4. Recent Developments
- 16.2.3.5. Financials (Based on Availability)
- 16.2.4 LB Maple Treat
- 16.2.4.1. Overview
- 16.2.4.2. Products
- 16.2.4.3. SWOT Analysis
- 16.2.4.4. Recent Developments
- 16.2.4.5. Financials (Based on Availability)
- 16.2.5 Les Industries Bernard et Fils Ltee
- 16.2.5.1. Overview
- 16.2.5.2. Products
- 16.2.5.3. SWOT Analysis
- 16.2.5.4. Recent Developments
- 16.2.5.5. Financials (Based on Availability)
- 16.2.6 Federation of Quebec Maple Syrup Producers
- 16.2.6.1. Overview
- 16.2.6.2. Products
- 16.2.6.3. SWOT Analysis
- 16.2.6.4. Recent Developments
- 16.2.6.5. Financials (Based on Availability)
- 16.2.7 Vermont Maple sugar maker Association
- 16.2.7.1. Overview
- 16.2.7.2. Products
- 16.2.7.3. SWOT Analysis
- 16.2.7.4. Recent Developments
- 16.2.7.5. Financials (Based on Availability)
- 16.2.8 Thompsons maple product
- 16.2.8.1. Overview
- 16.2.8.2. Products
- 16.2.8.3. SWOT Analysis
- 16.2.8.4. Recent Developments
- 16.2.8.5. Financials (Based on Availability)
- 16.2.9 Bascom family farms
- 16.2.9.1. Overview
- 16.2.9.2. Products
- 16.2.9.3. SWOT Analysis
- 16.2.9.4. Recent Developments
- 16.2.9.5. Financials (Based on Availability)
- 16.2.10 HJ Heinz Company
- 16.2.10.1. Overview
- 16.2.10.2. Products
- 16.2.10.3. SWOT Analysis
- 16.2.10.4. Recent Developments
- 16.2.10.5. Financials (Based on Availability)
- 16.2.1 Bascom Maple Farms Inc*List Not Exhaustive
List of Figures
- Figure 1: Global Maple Market Revenue Breakdown (Million, %) by Region 2024 & 2032
- Figure 2: Global Maple Market Volume Breakdown (Liters, %) by Region 2024 & 2032
- Figure 3: North America Maple Market Revenue (Million), by Country 2024 & 2032
- Figure 4: North America Maple Market Volume (Liters), by Country 2024 & 2032
- Figure 5: North America Maple Market Revenue Share (%), by Country 2024 & 2032
- Figure 6: North America Maple Market Volume Share (%), by Country 2024 & 2032
- Figure 7: Europe Maple Market Revenue (Million), by Country 2024 & 2032
- Figure 8: Europe Maple Market Volume (Liters), by Country 2024 & 2032
- Figure 9: Europe Maple Market Revenue Share (%), by Country 2024 & 2032
- Figure 10: Europe Maple Market Volume Share (%), by Country 2024 & 2032
- Figure 11: Asia Pacific Maple Market Revenue (Million), by Country 2024 & 2032
- Figure 12: Asia Pacific Maple Market Volume (Liters), by Country 2024 & 2032
- Figure 13: Asia Pacific Maple Market Revenue Share (%), by Country 2024 & 2032
- Figure 14: Asia Pacific Maple Market Volume Share (%), by Country 2024 & 2032
- Figure 15: South America Maple Market Revenue (Million), by Country 2024 & 2032
- Figure 16: South America Maple Market Volume (Liters), by Country 2024 & 2032
- Figure 17: South America Maple Market Revenue Share (%), by Country 2024 & 2032
- Figure 18: South America Maple Market Volume Share (%), by Country 2024 & 2032
- Figure 19: Middle East and Africa Maple Market Revenue (Million), by Country 2024 & 2032
- Figure 20: Middle East and Africa Maple Market Volume (Liters), by Country 2024 & 2032
- Figure 21: Middle East and Africa Maple Market Revenue Share (%), by Country 2024 & 2032
- Figure 22: Middle East and Africa Maple Market Volume Share (%), by Country 2024 & 2032
- Figure 23: North America Maple Market Revenue (Million), by Category 2024 & 2032
- Figure 24: North America Maple Market Volume (Liters), by Category 2024 & 2032
- Figure 25: North America Maple Market Revenue Share (%), by Category 2024 & 2032
- Figure 26: North America Maple Market Volume Share (%), by Category 2024 & 2032
- Figure 27: North America Maple Market Revenue (Million), by Type 2024 & 2032
- Figure 28: North America Maple Market Volume (Liters), by Type 2024 & 2032
- Figure 29: North America Maple Market Revenue Share (%), by Type 2024 & 2032
- Figure 30: North America Maple Market Volume Share (%), by Type 2024 & 2032
- Figure 31: North America Maple Market Revenue (Million), by Distribution Channel 2024 & 2032
- Figure 32: North America Maple Market Volume (Liters), by Distribution Channel 2024 & 2032
- Figure 33: North America Maple Market Revenue Share (%), by Distribution Channel 2024 & 2032
- Figure 34: North America Maple Market Volume Share (%), by Distribution Channel 2024 & 2032
- Figure 35: North America Maple Market Revenue (Million), by Country 2024 & 2032
- Figure 36: North America Maple Market Volume (Liters), by Country 2024 & 2032
- Figure 37: North America Maple Market Revenue Share (%), by Country 2024 & 2032
- Figure 38: North America Maple Market Volume Share (%), by Country 2024 & 2032
- Figure 39: Europe Maple Market Revenue (Million), by Category 2024 & 2032
- Figure 40: Europe Maple Market Volume (Liters), by Category 2024 & 2032
- Figure 41: Europe Maple Market Revenue Share (%), by Category 2024 & 2032
- Figure 42: Europe Maple Market Volume Share (%), by Category 2024 & 2032
- Figure 43: Europe Maple Market Revenue (Million), by Type 2024 & 2032
- Figure 44: Europe Maple Market Volume (Liters), by Type 2024 & 2032
- Figure 45: Europe Maple Market Revenue Share (%), by Type 2024 & 2032
- Figure 46: Europe Maple Market Volume Share (%), by Type 2024 & 2032
- Figure 47: Europe Maple Market Revenue (Million), by Distribution Channel 2024 & 2032
- Figure 48: Europe Maple Market Volume (Liters), by Distribution Channel 2024 & 2032
- Figure 49: Europe Maple Market Revenue Share (%), by Distribution Channel 2024 & 2032
- Figure 50: Europe Maple Market Volume Share (%), by Distribution Channel 2024 & 2032
- Figure 51: Europe Maple Market Revenue (Million), by Country 2024 & 2032
- Figure 52: Europe Maple Market Volume (Liters), by Country 2024 & 2032
- Figure 53: Europe Maple Market Revenue Share (%), by Country 2024 & 2032
- Figure 54: Europe Maple Market Volume Share (%), by Country 2024 & 2032
- Figure 55: Asia Pacific Maple Market Revenue (Million), by Category 2024 & 2032
- Figure 56: Asia Pacific Maple Market Volume (Liters), by Category 2024 & 2032
- Figure 57: Asia Pacific Maple Market Revenue Share (%), by Category 2024 & 2032
- Figure 58: Asia Pacific Maple Market Volume Share (%), by Category 2024 & 2032
- Figure 59: Asia Pacific Maple Market Revenue (Million), by Type 2024 & 2032
- Figure 60: Asia Pacific Maple Market Volume (Liters), by Type 2024 & 2032
- Figure 61: Asia Pacific Maple Market Revenue Share (%), by Type 2024 & 2032
- Figure 62: Asia Pacific Maple Market Volume Share (%), by Type 2024 & 2032
- Figure 63: Asia Pacific Maple Market Revenue (Million), by Distribution Channel 2024 & 2032
- Figure 64: Asia Pacific Maple Market Volume (Liters), by Distribution Channel 2024 & 2032
- Figure 65: Asia Pacific Maple Market Revenue Share (%), by Distribution Channel 2024 & 2032
- Figure 66: Asia Pacific Maple Market Volume Share (%), by Distribution Channel 2024 & 2032
- Figure 67: Asia Pacific Maple Market Revenue (Million), by Country 2024 & 2032
- Figure 68: Asia Pacific Maple Market Volume (Liters), by Country 2024 & 2032
- Figure 69: Asia Pacific Maple Market Revenue Share (%), by Country 2024 & 2032
- Figure 70: Asia Pacific Maple Market Volume Share (%), by Country 2024 & 2032
- Figure 71: South America Maple Market Revenue (Million), by Category 2024 & 2032
- Figure 72: South America Maple Market Volume (Liters), by Category 2024 & 2032
- Figure 73: South America Maple Market Revenue Share (%), by Category 2024 & 2032
- Figure 74: South America Maple Market Volume Share (%), by Category 2024 & 2032
- Figure 75: South America Maple Market Revenue (Million), by Type 2024 & 2032
- Figure 76: South America Maple Market Volume (Liters), by Type 2024 & 2032
- Figure 77: South America Maple Market Revenue Share (%), by Type 2024 & 2032
- Figure 78: South America Maple Market Volume Share (%), by Type 2024 & 2032
- Figure 79: South America Maple Market Revenue (Million), by Distribution Channel 2024 & 2032
- Figure 80: South America Maple Market Volume (Liters), by Distribution Channel 2024 & 2032
- Figure 81: South America Maple Market Revenue Share (%), by Distribution Channel 2024 & 2032
- Figure 82: South America Maple Market Volume Share (%), by Distribution Channel 2024 & 2032
- Figure 83: South America Maple Market Revenue (Million), by Country 2024 & 2032
- Figure 84: South America Maple Market Volume (Liters), by Country 2024 & 2032
- Figure 85: South America Maple Market Revenue Share (%), by Country 2024 & 2032
- Figure 86: South America Maple Market Volume Share (%), by Country 2024 & 2032
- Figure 87: Middle East and Africa Maple Market Revenue (Million), by Category 2024 & 2032
- Figure 88: Middle East and Africa Maple Market Volume (Liters), by Category 2024 & 2032
- Figure 89: Middle East and Africa Maple Market Revenue Share (%), by Category 2024 & 2032
- Figure 90: Middle East and Africa Maple Market Volume Share (%), by Category 2024 & 2032
- Figure 91: Middle East and Africa Maple Market Revenue (Million), by Type 2024 & 2032
- Figure 92: Middle East and Africa Maple Market Volume (Liters), by Type 2024 & 2032
- Figure 93: Middle East and Africa Maple Market Revenue Share (%), by Type 2024 & 2032
- Figure 94: Middle East and Africa Maple Market Volume Share (%), by Type 2024 & 2032
- Figure 95: Middle East and Africa Maple Market Revenue (Million), by Distribution Channel 2024 & 2032
- Figure 96: Middle East and Africa Maple Market Volume (Liters), by Distribution Channel 2024 & 2032
- Figure 97: Middle East and Africa Maple Market Revenue Share (%), by Distribution Channel 2024 & 2032
- Figure 98: Middle East and Africa Maple Market Volume Share (%), by Distribution Channel 2024 & 2032
- Figure 99: Middle East and Africa Maple Market Revenue (Million), by Country 2024 & 2032
- Figure 100: Middle East and Africa Maple Market Volume (Liters), by Country 2024 & 2032
- Figure 101: Middle East and Africa Maple Market Revenue Share (%), by Country 2024 & 2032
- Figure 102: Middle East and Africa Maple Market Volume Share (%), by Country 2024 & 2032
List of Tables
- Table 1: Global Maple Market Revenue Million Forecast, by Region 2019 & 2032
- Table 2: Global Maple Market Volume Liters Forecast, by Region 2019 & 2032
- Table 3: Global Maple Market Revenue Million Forecast, by Category 2019 & 2032
- Table 4: Global Maple Market Volume Liters Forecast, by Category 2019 & 2032
- Table 5: Global Maple Market Revenue Million Forecast, by Type 2019 & 2032
- Table 6: Global Maple Market Volume Liters Forecast, by Type 2019 & 2032
- Table 7: Global Maple Market Revenue Million Forecast, by Distribution Channel 2019 & 2032
- Table 8: Global Maple Market Volume Liters Forecast, by Distribution Channel 2019 & 2032
- Table 9: Global Maple Market Revenue Million Forecast, by Region 2019 & 2032
- Table 10: Global Maple Market Volume Liters Forecast, by Region 2019 & 2032
- Table 11: Global Maple Market Revenue Million Forecast, by Country 2019 & 2032
- Table 12: Global Maple Market Volume Liters Forecast, by Country 2019 & 2032
- Table 13: United States Maple Market Revenue (Million) Forecast, by Application 2019 & 2032
- Table 14: United States Maple Market Volume (Liters) Forecast, by Application 2019 & 2032
- Table 15: Canada Maple Market Revenue (Million) Forecast, by Application 2019 & 2032
- Table 16: Canada Maple Market Volume (Liters) Forecast, by Application 2019 & 2032
- Table 17: Mexico Maple Market Revenue (Million) Forecast, by Application 2019 & 2032
- Table 18: Mexico Maple Market Volume (Liters) Forecast, by Application 2019 & 2032
- Table 19: Rest of North America Maple Market Revenue (Million) Forecast, by Application 2019 & 2032
- Table 20: Rest of North America Maple Market Volume (Liters) Forecast, by Application 2019 & 2032
- Table 21: Global Maple Market Revenue Million Forecast, by Country 2019 & 2032
- Table 22: Global Maple Market Volume Liters Forecast, by Country 2019 & 2032
- Table 23: Germany Maple Market Revenue (Million) Forecast, by Application 2019 & 2032
- Table 24: Germany Maple Market Volume (Liters) Forecast, by Application 2019 & 2032
- Table 25: United Kingdom Maple Market Revenue (Million) Forecast, by Application 2019 & 2032
- Table 26: United Kingdom Maple Market Volume (Liters) Forecast, by Application 2019 & 2032
- Table 27: France Maple Market Revenue (Million) Forecast, by Application 2019 & 2032
- Table 28: France Maple Market Volume (Liters) Forecast, by Application 2019 & 2032
- Table 29: Russia Maple Market Revenue (Million) Forecast, by Application 2019 & 2032
- Table 30: Russia Maple Market Volume (Liters) Forecast, by Application 2019 & 2032
- Table 31: Spain Maple Market Revenue (Million) Forecast, by Application 2019 & 2032
- Table 32: Spain Maple Market Volume (Liters) Forecast, by Application 2019 & 2032
- Table 33: Italy Maple Market Revenue (Million) Forecast, by Application 2019 & 2032
- Table 34: Italy Maple Market Volume (Liters) Forecast, by Application 2019 & 2032
- Table 35: Rest of Europe Maple Market Revenue (Million) Forecast, by Application 2019 & 2032
- Table 36: Rest of Europe Maple Market Volume (Liters) Forecast, by Application 2019 & 2032
- Table 37: Global Maple Market Revenue Million Forecast, by Country 2019 & 2032
- Table 38: Global Maple Market Volume Liters Forecast, by Country 2019 & 2032
- Table 39: India Maple Market Revenue (Million) Forecast, by Application 2019 & 2032
- Table 40: India Maple Market Volume (Liters) Forecast, by Application 2019 & 2032
- Table 41: China Maple Market Revenue (Million) Forecast, by Application 2019 & 2032
- Table 42: China Maple Market Volume (Liters) Forecast, by Application 2019 & 2032
- Table 43: Japan Maple Market Revenue (Million) Forecast, by Application 2019 & 2032
- Table 44: Japan Maple Market Volume (Liters) Forecast, by Application 2019 & 2032
- Table 45: Rest of Asia Pacific Maple Market Revenue (Million) Forecast, by Application 2019 & 2032
- Table 46: Rest of Asia Pacific Maple Market Volume (Liters) Forecast, by Application 2019 & 2032
- Table 47: Global Maple Market Revenue Million Forecast, by Country 2019 & 2032
- Table 48: Global Maple Market Volume Liters Forecast, by Country 2019 & 2032
- Table 49: Brazil Maple Market Revenue (Million) Forecast, by Application 2019 & 2032
- Table 50: Brazil Maple Market Volume (Liters) Forecast, by Application 2019 & 2032
- Table 51: Argentina Maple Market Revenue (Million) Forecast, by Application 2019 & 2032
- Table 52: Argentina Maple Market Volume (Liters) Forecast, by Application 2019 & 2032
- Table 53: Rest of South America Maple Market Revenue (Million) Forecast, by Application 2019 & 2032
- Table 54: Rest of South America Maple Market Volume (Liters) Forecast, by Application 2019 & 2032
- Table 55: Global Maple Market Revenue Million Forecast, by Country 2019 & 2032
- Table 56: Global Maple Market Volume Liters Forecast, by Country 2019 & 2032
- Table 57: United Arab Emirates Maple Market Revenue (Million) Forecast, by Application 2019 & 2032
- Table 58: United Arab Emirates Maple Market Volume (Liters) Forecast, by Application 2019 & 2032
- Table 59: South Africa Maple Market Revenue (Million) Forecast, by Application 2019 & 2032
- Table 60: South Africa Maple Market Volume (Liters) Forecast, by Application 2019 & 2032
- Table 61: Rest of Middle East and Africa Maple Market Revenue (Million) Forecast, by Application 2019 & 2032
- Table 62: Rest of Middle East and Africa Maple Market Volume (Liters) Forecast, by Application 2019 & 2032
- Table 63: Global Maple Market Revenue Million Forecast, by Category 2019 & 2032
- Table 64: Global Maple Market Volume Liters Forecast, by Category 2019 & 2032
- Table 65: Global Maple Market Revenue Million Forecast, by Type 2019 & 2032
- Table 66: Global Maple Market Volume Liters Forecast, by Type 2019 & 2032
- Table 67: Global Maple Market Revenue Million Forecast, by Distribution Channel 2019 & 2032
- Table 68: Global Maple Market Volume Liters Forecast, by Distribution Channel 2019 & 2032
- Table 69: Global Maple Market Revenue Million Forecast, by Country 2019 & 2032
- Table 70: Global Maple Market Volume Liters Forecast, by Country 2019 & 2032
- Table 71: United States Maple Market Revenue (Million) Forecast, by Application 2019 & 2032
- Table 72: United States Maple Market Volume (Liters) Forecast, by Application 2019 & 2032
- Table 73: Canada Maple Market Revenue (Million) Forecast, by Application 2019 & 2032
- Table 74: Canada Maple Market Volume (Liters) Forecast, by Application 2019 & 2032
- Table 75: Mexico Maple Market Revenue (Million) Forecast, by Application 2019 & 2032
- Table 76: Mexico Maple Market Volume (Liters) Forecast, by Application 2019 & 2032
- Table 77: Rest of North America Maple Market Revenue (Million) Forecast, by Application 2019 & 2032
- Table 78: Rest of North America Maple Market Volume (Liters) Forecast, by Application 2019 & 2032
- Table 79: Global Maple Market Revenue Million Forecast, by Category 2019 & 2032
- Table 80: Global Maple Market Volume Liters Forecast, by Category 2019 & 2032
- Table 81: Global Maple Market Revenue Million Forecast, by Type 2019 & 2032
- Table 82: Global Maple Market Volume Liters Forecast, by Type 2019 & 2032
- Table 83: Global Maple Market Revenue Million Forecast, by Distribution Channel 2019 & 2032
- Table 84: Global Maple Market Volume Liters Forecast, by Distribution Channel 2019 & 2032
- Table 85: Global Maple Market Revenue Million Forecast, by Country 2019 & 2032
- Table 86: Global Maple Market Volume Liters Forecast, by Country 2019 & 2032
- Table 87: Germany Maple Market Revenue (Million) Forecast, by Application 2019 & 2032
- Table 88: Germany Maple Market Volume (Liters) Forecast, by Application 2019 & 2032
- Table 89: United Kingdom Maple Market Revenue (Million) Forecast, by Application 2019 & 2032
- Table 90: United Kingdom Maple Market Volume (Liters) Forecast, by Application 2019 & 2032
- Table 91: France Maple Market Revenue (Million) Forecast, by Application 2019 & 2032
- Table 92: France Maple Market Volume (Liters) Forecast, by Application 2019 & 2032
- Table 93: Russia Maple Market Revenue (Million) Forecast, by Application 2019 & 2032
- Table 94: Russia Maple Market Volume (Liters) Forecast, by Application 2019 & 2032
- Table 95: Spain Maple Market Revenue (Million) Forecast, by Application 2019 & 2032
- Table 96: Spain Maple Market Volume (Liters) Forecast, by Application 2019 & 2032
- Table 97: Italy Maple Market Revenue (Million) Forecast, by Application 2019 & 2032
- Table 98: Italy Maple Market Volume (Liters) Forecast, by Application 2019 & 2032
- Table 99: Rest of Europe Maple Market Revenue (Million) Forecast, by Application 2019 & 2032
- Table 100: Rest of Europe Maple Market Volume (Liters) Forecast, by Application 2019 & 2032
- Table 101: Global Maple Market Revenue Million Forecast, by Category 2019 & 2032
- Table 102: Global Maple Market Volume Liters Forecast, by Category 2019 & 2032
- Table 103: Global Maple Market Revenue Million Forecast, by Type 2019 & 2032
- Table 104: Global Maple Market Volume Liters Forecast, by Type 2019 & 2032
- Table 105: Global Maple Market Revenue Million Forecast, by Distribution Channel 2019 & 2032
- Table 106: Global Maple Market Volume Liters Forecast, by Distribution Channel 2019 & 2032
- Table 107: Global Maple Market Revenue Million Forecast, by Country 2019 & 2032
- Table 108: Global Maple Market Volume Liters Forecast, by Country 2019 & 2032
- Table 109: India Maple Market Revenue (Million) Forecast, by Application 2019 & 2032
- Table 110: India Maple Market Volume (Liters) Forecast, by Application 2019 & 2032
- Table 111: China Maple Market Revenue (Million) Forecast, by Application 2019 & 2032
- Table 112: China Maple Market Volume (Liters) Forecast, by Application 2019 & 2032
- Table 113: Japan Maple Market Revenue (Million) Forecast, by Application 2019 & 2032
- Table 114: Japan Maple Market Volume (Liters) Forecast, by Application 2019 & 2032
- Table 115: Rest of Asia Pacific Maple Market Revenue (Million) Forecast, by Application 2019 & 2032
- Table 116: Rest of Asia Pacific Maple Market Volume (Liters) Forecast, by Application 2019 & 2032
- Table 117: Global Maple Market Revenue Million Forecast, by Category 2019 & 2032
- Table 118: Global Maple Market Volume Liters Forecast, by Category 2019 & 2032
- Table 119: Global Maple Market Revenue Million Forecast, by Type 2019 & 2032
- Table 120: Global Maple Market Volume Liters Forecast, by Type 2019 & 2032
- Table 121: Global Maple Market Revenue Million Forecast, by Distribution Channel 2019 & 2032
- Table 122: Global Maple Market Volume Liters Forecast, by Distribution Channel 2019 & 2032
- Table 123: Global Maple Market Revenue Million Forecast, by Country 2019 & 2032
- Table 124: Global Maple Market Volume Liters Forecast, by Country 2019 & 2032
- Table 125: Brazil Maple Market Revenue (Million) Forecast, by Application 2019 & 2032
- Table 126: Brazil Maple Market Volume (Liters) Forecast, by Application 2019 & 2032
- Table 127: Argentina Maple Market Revenue (Million) Forecast, by Application 2019 & 2032
- Table 128: Argentina Maple Market Volume (Liters) Forecast, by Application 2019 & 2032
- Table 129: Rest of South America Maple Market Revenue (Million) Forecast, by Application 2019 & 2032
- Table 130: Rest of South America Maple Market Volume (Liters) Forecast, by Application 2019 & 2032
- Table 131: Global Maple Market Revenue Million Forecast, by Category 2019 & 2032
- Table 132: Global Maple Market Volume Liters Forecast, by Category 2019 & 2032
- Table 133: Global Maple Market Revenue Million Forecast, by Type 2019 & 2032
- Table 134: Global Maple Market Volume Liters Forecast, by Type 2019 & 2032
- Table 135: Global Maple Market Revenue Million Forecast, by Distribution Channel 2019 & 2032
- Table 136: Global Maple Market Volume Liters Forecast, by Distribution Channel 2019 & 2032
- Table 137: Global Maple Market Revenue Million Forecast, by Country 2019 & 2032
- Table 138: Global Maple Market Volume Liters Forecast, by Country 2019 & 2032
- Table 139: United Arab Emirates Maple Market Revenue (Million) Forecast, by Application 2019 & 2032
- Table 140: United Arab Emirates Maple Market Volume (Liters) Forecast, by Application 2019 & 2032
- Table 141: South Africa Maple Market Revenue (Million) Forecast, by Application 2019 & 2032
- Table 142: South Africa Maple Market Volume (Liters) Forecast, by Application 2019 & 2032
- Table 143: Rest of Middle East and Africa Maple Market Revenue (Million) Forecast, by Application 2019 & 2032
- Table 144: Rest of Middle East and Africa Maple Market Volume (Liters) Forecast, by Application 2019 & 2032
Frequently Asked Questions
1. What is the projected Compound Annual Growth Rate (CAGR) of the Maple Market?
The projected CAGR is approximately 7.17%.
2. Which companies are prominent players in the Maple Market?
Key companies in the market include Bascom Maple Farms Inc*List Not Exhaustive, B&G Foods, J M Smucker, LB Maple Treat, Les Industries Bernard et Fils Ltee, Federation of Quebec Maple Syrup Producers, Vermont Maple sugar maker Association, Thompsons maple product, Bascom family farms, HJ Heinz Company.
3. What are the main segments of the Maple Market?
The market segments include Category, Type, Distribution Channel.
4. Can you provide details about the market size?
The market size is estimated to be USD 1.16 Million as of 2022.
5. What are some drivers contributing to market growth?
Prevalence of Lactose Intolerance Driving the Market; Growing Influence of Healthy Lifestyle Trends and Rising Non-Traditional Users.
6. What are the notable trends driving market growth?
Utilization of Maple Syrup as a Flavoring Agent.
7. Are there any restraints impacting market growth?
Wide Availability of Alternative Protein Sources.
8. Can you provide examples of recent developments in the market?
March 2022: PepsiCo Inc. introduced a limited-edition maple syrup version of its namesake cola brand in collaboration with the United States pancake restaurant chain IHOP.
9. What pricing options are available for accessing the report?
Pricing options include single-user, multi-user, and enterprise licenses priced at USD 4750, USD 5250, and USD 8750 respectively.
10. Is the market size provided in terms of value or volume?
The market size is provided in terms of value, measured in Million and volume, measured in Liters.
11. Are there any specific market keywords associated with the report?
Yes, the market keyword associated with the report is "Maple Market," which aids in identifying and referencing the specific market segment covered.
12. How do I determine which pricing option suits my needs best?
The pricing options vary based on user requirements and access needs. Individual users may opt for single-user licenses, while businesses requiring broader access may choose multi-user or enterprise licenses for cost-effective access to the report.
13. Are there any additional resources or data provided in the Maple Market report?
While the report offers comprehensive insights, it's advisable to review the specific contents or supplementary materials provided to ascertain if additional resources or data are available.
14. How can I stay updated on further developments or reports in the Maple Market?
To stay informed about further developments, trends, and reports in the Maple Market, consider subscribing to industry newsletters, following relevant companies and organizations, or regularly checking reputable industry news sources and publications.
Methodology
Step 1 - Identification of Relevant Samples Size from Population Database


Step 2 - Approaches for Defining Global Market Size (Value, Volume* & Price*)

Note*: In applicable scenarios
Step 3 - Data Sources
Primary Research
- Web Analytics
- Survey Reports
- Research Institute
- Latest Research Reports
- Opinion Leaders
Secondary Research
- Annual Reports
- White Paper
- Latest Press Release
- Industry Association
- Paid Database
- Investor Presentations

Step 4 - Data Triangulation
Involves using different sources of information in order to increase the validity of a study
These sources are likely to be stakeholders in a program - participants, other researchers, program staff, other community members, and so on.
Then we put all data in single framework & apply various statistical tools to find out the dynamic on the market.
During the analysis stage, feedback from the stakeholder groups would be compared to determine areas of agreement as well as areas of divergence
