

Key Insights
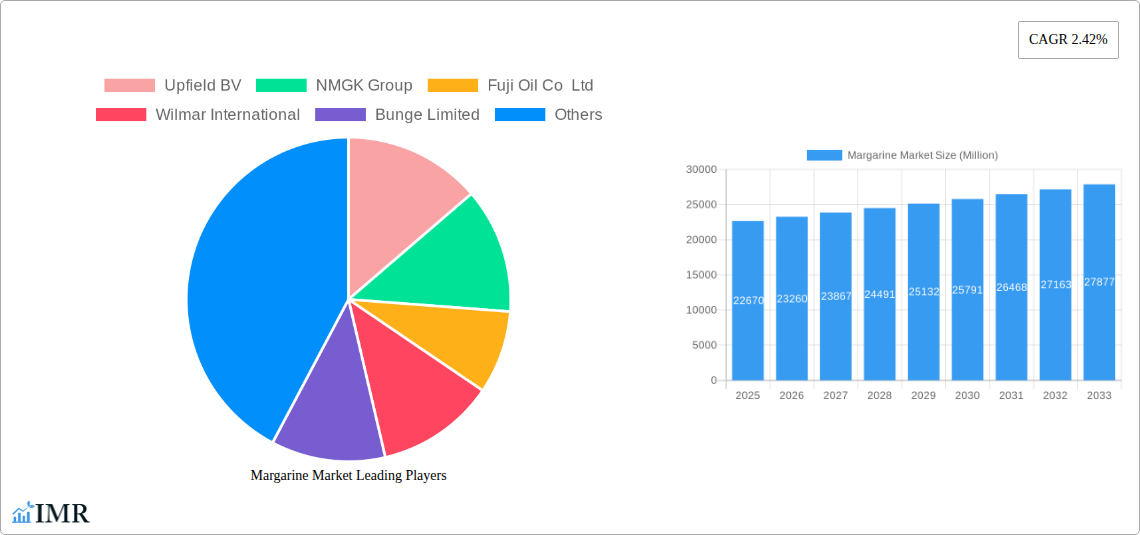
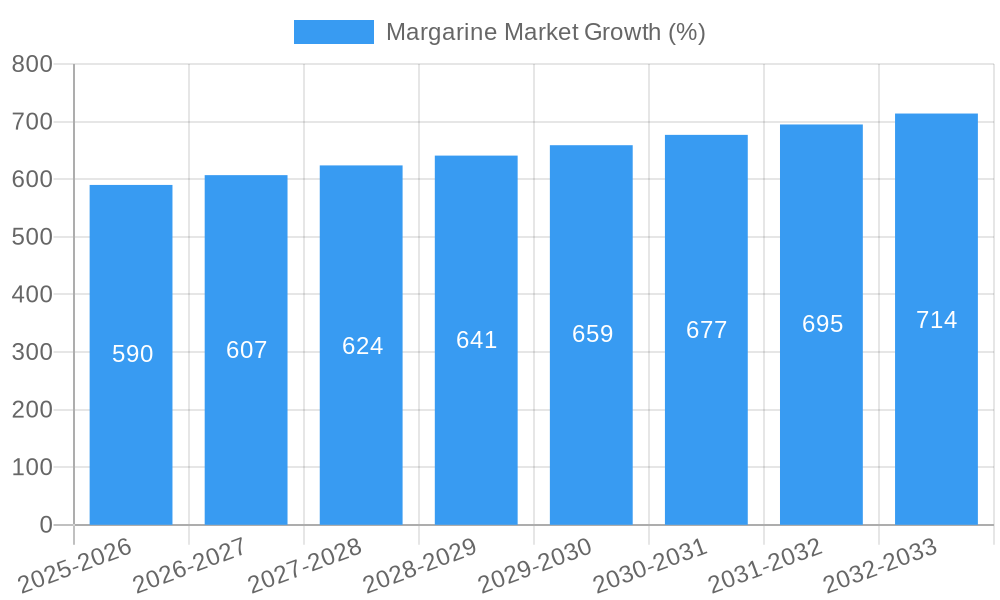
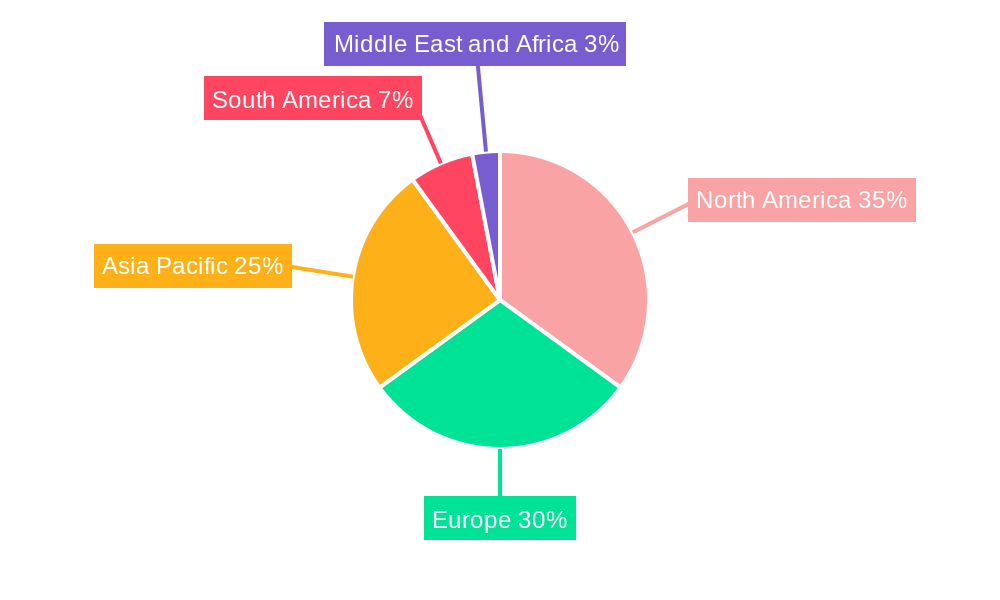
The global margarine market, valued at $22.67 billion in 2025, is projected to experience steady growth, driven by several key factors. Increasing consumer demand for convenient, affordable, and versatile cooking and spreading options fuels market expansion. The rising popularity of plant-based diets and the growing awareness of the health benefits of unsaturated fats are also significant drivers. Further growth is anticipated from the food service sector (HoReCa) and the industrial food processing industries, which use margarine as an ingredient in various food products. Market segmentation reveals significant demand across different types – hard, soft, and liquid margarines – catering to varied consumer preferences and culinary applications. Geographic distribution shows strong performance across North America and Europe, with significant growth potential in the Asia-Pacific region, driven by rising disposable incomes and changing dietary habits. However, challenges remain, including fluctuating raw material prices, increased competition from other spreads, and evolving consumer preferences toward healthier alternatives. The market's sustained growth trajectory is expected to continue through 2033, albeit at a moderate pace, reflecting ongoing adaptation to evolving market dynamics.
The competitive landscape is highly fragmented, with both large multinational corporations and smaller regional players vying for market share. Major players like Upfield BV, Wilmar International, and Bunge Limited leverage their extensive distribution networks and established brand recognition to maintain their leading positions. However, smaller, specialized companies are increasingly innovating to offer unique product formulations, focusing on health-conscious and niche markets. This includes introducing products with added functional benefits, such as omega-3 fatty acids or reduced saturated fat content. Successful strategies will involve adapting to evolving consumer demands, managing supply chain complexities, and investing in research and development to stay ahead of the curve. Companies are also exploring sustainable sourcing practices and environmentally friendly packaging solutions to align with growing consumer preferences for ethical and sustainable products.
Margarine Market: A Comprehensive Report (2019-2033)
This comprehensive report provides an in-depth analysis of the global margarine market, encompassing market dynamics, growth trends, regional analysis, competitive landscape, and future outlook. The study period covers 2019-2033, with 2025 as the base year and a forecast period of 2025-2033. The report leverages extensive primary and secondary research to offer valuable insights for industry professionals, investors, and strategic decision-makers. The market is segmented by type (Hard, Soft, Liquid), distribution channel (HoReCa, Industrial, Household Consumers), and key players including Upfield BV, NMGK Group, Fuji Oil Co Ltd, Wilmar International, Bunge Limited, Conagra Brands Inc, Associated British Foods, Vandemoortele, Puratos NV, BRF SA, and Richardson International Limited (list not exhaustive). The report values are presented in million units.
Margarine Market Dynamics & Structure
The global margarine market is characterized by moderate concentration, with a few major players holding significant market share. Technological innovations, particularly in sustainable and healthier alternatives, are key drivers. Stringent regulatory frameworks concerning trans-fats and labeling impact market dynamics. Competitive substitutes, including butter and other spreads, influence consumer choices. End-user demographics, particularly health-conscious consumers and those seeking convenience, shape demand. Mergers and acquisitions (M&A) activity, as evidenced by recent deals like Conagra Brands’ acquisition of Pinnacle Foods, contribute to market consolidation.
- Market Concentration: xx% held by top 5 players in 2024 (estimated).
- Technological Innovation: Focus on plant-based, reduced-fat, and healthier options.
- Regulatory Framework: Stricter regulations on trans-fat content and labeling.
- Competitive Substitutes: Butter, spreads, and other cooking oils pose competition.
- M&A Activity: xx deals recorded between 2019 and 2024 (estimated). Conagra's acquisition of Pinnacle Foods significantly impacted market share.
- Innovation Barriers: High R&D costs and consumer acceptance of new formulations.
Margarine Market Growth Trends & Insights
The global margarine market experienced a CAGR of xx% during the historical period (2019-2024). Market size reached xx million units in 2024 and is projected to reach xx million units by 2033, with a projected CAGR of xx% during the forecast period (2025-2033). Adoption rates vary across regions, with developed markets showing slower growth compared to emerging economies. Technological disruptions, such as the introduction of plant-based margarines and innovative production processes, are influencing market dynamics. Changing consumer preferences toward healthier and more sustainable options are driving growth in specific segments. Market penetration remains high in developed regions but varies significantly across geographies.
Dominant Regions, Countries, or Segments in Margarine Market
The North American and European regions currently dominate the margarine market, accounting for xx% of the global market share in 2024. However, Asia-Pacific is expected to exhibit the highest growth rate during the forecast period due to increasing demand from developing economies and rising disposable incomes. Within segments, the household consumer segment holds the largest market share, followed by the industrial segment. The soft margarine type demonstrates strong growth potential.
- Key Drivers (Asia-Pacific): Rising disposable incomes, increasing urbanization, and changing dietary habits.
- Dominance Factors (North America & Europe): Established market presence, high consumer awareness, and strong distribution networks.
- Growth Potential (Asia-Pacific): Untapped market potential and increasing demand for convenient cooking options.
- Market Share (Household Consumers): xx% in 2024 (estimated).
Margarine Market Product Landscape
The margarine market showcases a diverse range of products catering to varying consumer preferences and dietary needs. Innovations focus on reducing saturated and trans fats, incorporating healthier oils, and enhancing taste and texture. Product differentiation strategies rely heavily on branding, health claims, and convenient packaging formats. Technological advancements in manufacturing processes lead to cost-effective production and improved product quality. Unique selling propositions often highlight aspects such as sustainability, specific health benefits, and superior taste.
Key Drivers, Barriers & Challenges in Margarine Market
Key Drivers:
- Growing demand for convenient cooking options.
- Increasing health consciousness and preference for healthier fats.
- Technological innovations resulting in improved product quality and taste.
- Expansion into new and emerging markets.
Key Challenges:
- Competition from butter and other substitutes.
- Fluctuating raw material prices (e.g., palm oil).
- Stringent regulations on trans-fat content and labeling.
- Concerns about the environmental impact of palm oil production. This has led to a xx% decrease in palm oil-based margarine production in some regions (estimated).
Emerging Opportunities in Margarine Market
- Growing demand for vegan and plant-based margarine.
- Expansion into new and niche markets (e.g., specialized dietary needs).
- Development of functional margarines with added health benefits (e.g., probiotics, omega-3s).
- Innovative packaging solutions to enhance product shelf-life and convenience.
Growth Accelerators in the Margarine Market Industry
The long-term growth of the margarine market will be driven by continuous innovation in product formulation, focusing on sustainability and healthier options. Strategic partnerships, like Upfield's collaboration with IBM Food Trust, enhance supply chain transparency and build consumer trust. Expansion into untapped markets and adoption of advanced manufacturing technologies will also contribute to sustained growth.
Key Players Shaping the Margarine Market Market
- Upfield BV
- NMGK Group
- Fuji Oil Co Ltd
- Wilmar International
- Bunge Limited
- Conagra Brands Inc
- Associated British Foods
- Vandemoortele
- Puratos NV
- BRF SA
- Richardson International Limited
Notable Milestones in Margarine Market Sector
- [Year/Month]: Upfield's partnership with IBM Food Trust to enhance supply chain transparency.
- [Year/Month]: Conagra Brands' acquisition of Pinnacle Foods to expand its margarine portfolio.
- [Year/Month]: Bunge's focus on sustainable palm oil production in response to environmental concerns.
In-Depth Margarine Market Market Outlook
The future of the margarine market looks promising, driven by sustained consumer demand for convenient and healthy cooking options. Innovation in product formulations, strategic partnerships, and a focus on sustainability will continue to drive market growth. The shift towards plant-based alternatives and increasing demand in emerging markets present significant opportunities for growth and expansion for key players. Companies that successfully navigate regulatory hurdles and adapt to evolving consumer preferences will gain a competitive edge.
Margarine Market Segmentation
-
1. Type
- 1.1. Hard
- 1.2. Soft
- 1.3. Liquid
-
2. End User
-
2.1. Household Consumers
- 2.1.1. Supermarkets/hypermarkets
- 2.1.2. Convenience/Grocery Stores
- 2.1.3. Online Retail Stores
- 2.1.4. Other Distribution Channels
- 2.2. HoReCa
- 2.3. Industrial
-
2.1. Household Consumers
Margarine Market Segmentation By Geography
-
1. North America
- 1.1. United States
- 1.2. Canada
- 1.3. Mexico
- 1.4. Rest of North America
-
2. Europe
- 2.1. United Kingdom
- 2.2. Germany
- 2.3. France
- 2.4. Russia
- 2.5. Italy
- 2.6. Spain
- 2.7. Rest of Europe
-
3. Asia Pacific
- 3.1. India
- 3.2. China
- 3.3. Japan
- 3.4. Australia
- 3.5. Rest of Asia Pacific
-
4. South America
- 4.1. Brazil
- 4.2. Argentina
- 4.3. Rest of South America
-
5. Middle East and Africa
- 5.1. South Africa
- 5.2. United Arab Emirates
- 5.3. Rest of Middle East and Africa
Margarine Market REPORT HIGHLIGHTS
| Aspects | Details |
|---|---|
| Study Period | 2019-2033 |
| Base Year | 2024 |
| Estimated Year | 2025 |
| Forecast Period | 2025-2033 |
| Historical Period | 2019-2024 |
| Growth Rate | CAGR of 2.42% from 2019-2033 |
| Segmentation |
|
Table of Contents
- 1. Introduction
- 1.1. Research Scope
- 1.2. Market Segmentation
- 1.3. Research Methodology
- 1.4. Definitions and Assumptions
- 2. Executive Summary
- 2.1. Introduction
- 3. Market Dynamics
- 3.1. Introduction
- 3.2. Market Drivers
- 3.2.1. Growing Demand for Bakery and Confectionery Products; Increasing Awareness about the benefits of Vegetarian and Vegan Diets
- 3.3. Market Restrains
- 3.3.1. Stringent Regulations for Consumption of Trans-Fats
- 3.4. Market Trends
- 3.4.1. Rising Demand for Sustainable Foods
- 4. Market Factor Analysis
- 4.1. Porters Five Forces
- 4.2. Supply/Value Chain
- 4.3. PESTEL analysis
- 4.4. Market Entropy
- 4.5. Patent/Trademark Analysis
- 5. Global Margarine Market Analysis, Insights and Forecast, 2019-2031
- 5.1. Market Analysis, Insights and Forecast - by Type
- 5.1.1. Hard
- 5.1.2. Soft
- 5.1.3. Liquid
- 5.2. Market Analysis, Insights and Forecast - by End User
- 5.2.1. Household Consumers
- 5.2.1.1. Supermarkets/hypermarkets
- 5.2.1.2. Convenience/Grocery Stores
- 5.2.1.3. Online Retail Stores
- 5.2.1.4. Other Distribution Channels
- 5.2.2. HoReCa
- 5.2.3. Industrial
- 5.2.1. Household Consumers
- 5.3. Market Analysis, Insights and Forecast - by Region
- 5.3.1. North America
- 5.3.2. Europe
- 5.3.3. Asia Pacific
- 5.3.4. South America
- 5.3.5. Middle East and Africa
- 5.1. Market Analysis, Insights and Forecast - by Type
- 6. North America Margarine Market Analysis, Insights and Forecast, 2019-2031
- 6.1. Market Analysis, Insights and Forecast - by Type
- 6.1.1. Hard
- 6.1.2. Soft
- 6.1.3. Liquid
- 6.2. Market Analysis, Insights and Forecast - by End User
- 6.2.1. Household Consumers
- 6.2.1.1. Supermarkets/hypermarkets
- 6.2.1.2. Convenience/Grocery Stores
- 6.2.1.3. Online Retail Stores
- 6.2.1.4. Other Distribution Channels
- 6.2.2. HoReCa
- 6.2.3. Industrial
- 6.2.1. Household Consumers
- 6.1. Market Analysis, Insights and Forecast - by Type
- 7. Europe Margarine Market Analysis, Insights and Forecast, 2019-2031
- 7.1. Market Analysis, Insights and Forecast - by Type
- 7.1.1. Hard
- 7.1.2. Soft
- 7.1.3. Liquid
- 7.2. Market Analysis, Insights and Forecast - by End User
- 7.2.1. Household Consumers
- 7.2.1.1. Supermarkets/hypermarkets
- 7.2.1.2. Convenience/Grocery Stores
- 7.2.1.3. Online Retail Stores
- 7.2.1.4. Other Distribution Channels
- 7.2.2. HoReCa
- 7.2.3. Industrial
- 7.2.1. Household Consumers
- 7.1. Market Analysis, Insights and Forecast - by Type
- 8. Asia Pacific Margarine Market Analysis, Insights and Forecast, 2019-2031
- 8.1. Market Analysis, Insights and Forecast - by Type
- 8.1.1. Hard
- 8.1.2. Soft
- 8.1.3. Liquid
- 8.2. Market Analysis, Insights and Forecast - by End User
- 8.2.1. Household Consumers
- 8.2.1.1. Supermarkets/hypermarkets
- 8.2.1.2. Convenience/Grocery Stores
- 8.2.1.3. Online Retail Stores
- 8.2.1.4. Other Distribution Channels
- 8.2.2. HoReCa
- 8.2.3. Industrial
- 8.2.1. Household Consumers
- 8.1. Market Analysis, Insights and Forecast - by Type
- 9. South America Margarine Market Analysis, Insights and Forecast, 2019-2031
- 9.1. Market Analysis, Insights and Forecast - by Type
- 9.1.1. Hard
- 9.1.2. Soft
- 9.1.3. Liquid
- 9.2. Market Analysis, Insights and Forecast - by End User
- 9.2.1. Household Consumers
- 9.2.1.1. Supermarkets/hypermarkets
- 9.2.1.2. Convenience/Grocery Stores
- 9.2.1.3. Online Retail Stores
- 9.2.1.4. Other Distribution Channels
- 9.2.2. HoReCa
- 9.2.3. Industrial
- 9.2.1. Household Consumers
- 9.1. Market Analysis, Insights and Forecast - by Type
- 10. Middle East and Africa Margarine Market Analysis, Insights and Forecast, 2019-2031
- 10.1. Market Analysis, Insights and Forecast - by Type
- 10.1.1. Hard
- 10.1.2. Soft
- 10.1.3. Liquid
- 10.2. Market Analysis, Insights and Forecast - by End User
- 10.2.1. Household Consumers
- 10.2.1.1. Supermarkets/hypermarkets
- 10.2.1.2. Convenience/Grocery Stores
- 10.2.1.3. Online Retail Stores
- 10.2.1.4. Other Distribution Channels
- 10.2.2. HoReCa
- 10.2.3. Industrial
- 10.2.1. Household Consumers
- 10.1. Market Analysis, Insights and Forecast - by Type
- 11. North America Margarine Market Analysis, Insights and Forecast, 2019-2031
- 11.1. Market Analysis, Insights and Forecast - By Country/Sub-region
- 11.1.1 United States
- 11.1.2 Canada
- 11.1.3 Mexico
- 11.1.4 Rest of North America
- 12. Europe Margarine Market Analysis, Insights and Forecast, 2019-2031
- 12.1. Market Analysis, Insights and Forecast - By Country/Sub-region
- 12.1.1 United Kingdom
- 12.1.2 Germany
- 12.1.3 France
- 12.1.4 Russia
- 12.1.5 Italy
- 12.1.6 Spain
- 12.1.7 Rest of Europe
- 13. Asia Pacific Margarine Market Analysis, Insights and Forecast, 2019-2031
- 13.1. Market Analysis, Insights and Forecast - By Country/Sub-region
- 13.1.1 India
- 13.1.2 China
- 13.1.3 Japan
- 13.1.4 Australia
- 13.1.5 Rest of Asia Pacific
- 14. South America Margarine Market Analysis, Insights and Forecast, 2019-2031
- 14.1. Market Analysis, Insights and Forecast - By Country/Sub-region
- 14.1.1 Brazil
- 14.1.2 Argentina
- 14.1.3 Rest of South America
- 15. Middle East and Africa Margarine Market Analysis, Insights and Forecast, 2019-2031
- 15.1. Market Analysis, Insights and Forecast - By Country/Sub-region
- 15.1.1 South Africa
- 15.1.2 United Arab Emirates
- 15.1.3 Rest of Middle East and Africa
- 16. Competitive Analysis
- 16.1. Global Market Share Analysis 2024
- 16.2. Company Profiles
- 16.2.1 Upfield BV
- 16.2.1.1. Overview
- 16.2.1.2. Products
- 16.2.1.3. SWOT Analysis
- 16.2.1.4. Recent Developments
- 16.2.1.5. Financials (Based on Availability)
- 16.2.2 NMGK Group
- 16.2.2.1. Overview
- 16.2.2.2. Products
- 16.2.2.3. SWOT Analysis
- 16.2.2.4. Recent Developments
- 16.2.2.5. Financials (Based on Availability)
- 16.2.3 Fuji Oil Co Ltd
- 16.2.3.1. Overview
- 16.2.3.2. Products
- 16.2.3.3. SWOT Analysis
- 16.2.3.4. Recent Developments
- 16.2.3.5. Financials (Based on Availability)
- 16.2.4 Wilmar International
- 16.2.4.1. Overview
- 16.2.4.2. Products
- 16.2.4.3. SWOT Analysis
- 16.2.4.4. Recent Developments
- 16.2.4.5. Financials (Based on Availability)
- 16.2.5 Bunge Limited
- 16.2.5.1. Overview
- 16.2.5.2. Products
- 16.2.5.3. SWOT Analysis
- 16.2.5.4. Recent Developments
- 16.2.5.5. Financials (Based on Availability)
- 16.2.6 Conagra Brands Inc
- 16.2.6.1. Overview
- 16.2.6.2. Products
- 16.2.6.3. SWOT Analysis
- 16.2.6.4. Recent Developments
- 16.2.6.5. Financials (Based on Availability)
- 16.2.7 Associated British Foods
- 16.2.7.1. Overview
- 16.2.7.2. Products
- 16.2.7.3. SWOT Analysis
- 16.2.7.4. Recent Developments
- 16.2.7.5. Financials (Based on Availability)
- 16.2.8 Vandemoortele*List Not Exhaustive
- 16.2.8.1. Overview
- 16.2.8.2. Products
- 16.2.8.3. SWOT Analysis
- 16.2.8.4. Recent Developments
- 16.2.8.5. Financials (Based on Availability)
- 16.2.9 Puratos NV
- 16.2.9.1. Overview
- 16.2.9.2. Products
- 16.2.9.3. SWOT Analysis
- 16.2.9.4. Recent Developments
- 16.2.9.5. Financials (Based on Availability)
- 16.2.10 BRF SA
- 16.2.10.1. Overview
- 16.2.10.2. Products
- 16.2.10.3. SWOT Analysis
- 16.2.10.4. Recent Developments
- 16.2.10.5. Financials (Based on Availability)
- 16.2.11 Richardson International Limited
- 16.2.11.1. Overview
- 16.2.11.2. Products
- 16.2.11.3. SWOT Analysis
- 16.2.11.4. Recent Developments
- 16.2.11.5. Financials (Based on Availability)
- 16.2.1 Upfield BV
List of Figures
- Figure 1: Global Margarine Market Revenue Breakdown (Million, %) by Region 2024 & 2032
- Figure 2: Global Margarine Market Volume Breakdown (K Tons, %) by Region 2024 & 2032
- Figure 3: North America Margarine Market Revenue (Million), by Country 2024 & 2032
- Figure 4: North America Margarine Market Volume (K Tons), by Country 2024 & 2032
- Figure 5: North America Margarine Market Revenue Share (%), by Country 2024 & 2032
- Figure 6: North America Margarine Market Volume Share (%), by Country 2024 & 2032
- Figure 7: Europe Margarine Market Revenue (Million), by Country 2024 & 2032
- Figure 8: Europe Margarine Market Volume (K Tons), by Country 2024 & 2032
- Figure 9: Europe Margarine Market Revenue Share (%), by Country 2024 & 2032
- Figure 10: Europe Margarine Market Volume Share (%), by Country 2024 & 2032
- Figure 11: Asia Pacific Margarine Market Revenue (Million), by Country 2024 & 2032
- Figure 12: Asia Pacific Margarine Market Volume (K Tons), by Country 2024 & 2032
- Figure 13: Asia Pacific Margarine Market Revenue Share (%), by Country 2024 & 2032
- Figure 14: Asia Pacific Margarine Market Volume Share (%), by Country 2024 & 2032
- Figure 15: South America Margarine Market Revenue (Million), by Country 2024 & 2032
- Figure 16: South America Margarine Market Volume (K Tons), by Country 2024 & 2032
- Figure 17: South America Margarine Market Revenue Share (%), by Country 2024 & 2032
- Figure 18: South America Margarine Market Volume Share (%), by Country 2024 & 2032
- Figure 19: Middle East and Africa Margarine Market Revenue (Million), by Country 2024 & 2032
- Figure 20: Middle East and Africa Margarine Market Volume (K Tons), by Country 2024 & 2032
- Figure 21: Middle East and Africa Margarine Market Revenue Share (%), by Country 2024 & 2032
- Figure 22: Middle East and Africa Margarine Market Volume Share (%), by Country 2024 & 2032
- Figure 23: North America Margarine Market Revenue (Million), by Type 2024 & 2032
- Figure 24: North America Margarine Market Volume (K Tons), by Type 2024 & 2032
- Figure 25: North America Margarine Market Revenue Share (%), by Type 2024 & 2032
- Figure 26: North America Margarine Market Volume Share (%), by Type 2024 & 2032
- Figure 27: North America Margarine Market Revenue (Million), by End User 2024 & 2032
- Figure 28: North America Margarine Market Volume (K Tons), by End User 2024 & 2032
- Figure 29: North America Margarine Market Revenue Share (%), by End User 2024 & 2032
- Figure 30: North America Margarine Market Volume Share (%), by End User 2024 & 2032
- Figure 31: North America Margarine Market Revenue (Million), by Country 2024 & 2032
- Figure 32: North America Margarine Market Volume (K Tons), by Country 2024 & 2032
- Figure 33: North America Margarine Market Revenue Share (%), by Country 2024 & 2032
- Figure 34: North America Margarine Market Volume Share (%), by Country 2024 & 2032
- Figure 35: Europe Margarine Market Revenue (Million), by Type 2024 & 2032
- Figure 36: Europe Margarine Market Volume (K Tons), by Type 2024 & 2032
- Figure 37: Europe Margarine Market Revenue Share (%), by Type 2024 & 2032
- Figure 38: Europe Margarine Market Volume Share (%), by Type 2024 & 2032
- Figure 39: Europe Margarine Market Revenue (Million), by End User 2024 & 2032
- Figure 40: Europe Margarine Market Volume (K Tons), by End User 2024 & 2032
- Figure 41: Europe Margarine Market Revenue Share (%), by End User 2024 & 2032
- Figure 42: Europe Margarine Market Volume Share (%), by End User 2024 & 2032
- Figure 43: Europe Margarine Market Revenue (Million), by Country 2024 & 2032
- Figure 44: Europe Margarine Market Volume (K Tons), by Country 2024 & 2032
- Figure 45: Europe Margarine Market Revenue Share (%), by Country 2024 & 2032
- Figure 46: Europe Margarine Market Volume Share (%), by Country 2024 & 2032
- Figure 47: Asia Pacific Margarine Market Revenue (Million), by Type 2024 & 2032
- Figure 48: Asia Pacific Margarine Market Volume (K Tons), by Type 2024 & 2032
- Figure 49: Asia Pacific Margarine Market Revenue Share (%), by Type 2024 & 2032
- Figure 50: Asia Pacific Margarine Market Volume Share (%), by Type 2024 & 2032
- Figure 51: Asia Pacific Margarine Market Revenue (Million), by End User 2024 & 2032
- Figure 52: Asia Pacific Margarine Market Volume (K Tons), by End User 2024 & 2032
- Figure 53: Asia Pacific Margarine Market Revenue Share (%), by End User 2024 & 2032
- Figure 54: Asia Pacific Margarine Market Volume Share (%), by End User 2024 & 2032
- Figure 55: Asia Pacific Margarine Market Revenue (Million), by Country 2024 & 2032
- Figure 56: Asia Pacific Margarine Market Volume (K Tons), by Country 2024 & 2032
- Figure 57: Asia Pacific Margarine Market Revenue Share (%), by Country 2024 & 2032
- Figure 58: Asia Pacific Margarine Market Volume Share (%), by Country 2024 & 2032
- Figure 59: South America Margarine Market Revenue (Million), by Type 2024 & 2032
- Figure 60: South America Margarine Market Volume (K Tons), by Type 2024 & 2032
- Figure 61: South America Margarine Market Revenue Share (%), by Type 2024 & 2032
- Figure 62: South America Margarine Market Volume Share (%), by Type 2024 & 2032
- Figure 63: South America Margarine Market Revenue (Million), by End User 2024 & 2032
- Figure 64: South America Margarine Market Volume (K Tons), by End User 2024 & 2032
- Figure 65: South America Margarine Market Revenue Share (%), by End User 2024 & 2032
- Figure 66: South America Margarine Market Volume Share (%), by End User 2024 & 2032
- Figure 67: South America Margarine Market Revenue (Million), by Country 2024 & 2032
- Figure 68: South America Margarine Market Volume (K Tons), by Country 2024 & 2032
- Figure 69: South America Margarine Market Revenue Share (%), by Country 2024 & 2032
- Figure 70: South America Margarine Market Volume Share (%), by Country 2024 & 2032
- Figure 71: Middle East and Africa Margarine Market Revenue (Million), by Type 2024 & 2032
- Figure 72: Middle East and Africa Margarine Market Volume (K Tons), by Type 2024 & 2032
- Figure 73: Middle East and Africa Margarine Market Revenue Share (%), by Type 2024 & 2032
- Figure 74: Middle East and Africa Margarine Market Volume Share (%), by Type 2024 & 2032
- Figure 75: Middle East and Africa Margarine Market Revenue (Million), by End User 2024 & 2032
- Figure 76: Middle East and Africa Margarine Market Volume (K Tons), by End User 2024 & 2032
- Figure 77: Middle East and Africa Margarine Market Revenue Share (%), by End User 2024 & 2032
- Figure 78: Middle East and Africa Margarine Market Volume Share (%), by End User 2024 & 2032
- Figure 79: Middle East and Africa Margarine Market Revenue (Million), by Country 2024 & 2032
- Figure 80: Middle East and Africa Margarine Market Volume (K Tons), by Country 2024 & 2032
- Figure 81: Middle East and Africa Margarine Market Revenue Share (%), by Country 2024 & 2032
- Figure 82: Middle East and Africa Margarine Market Volume Share (%), by Country 2024 & 2032
List of Tables
- Table 1: Global Margarine Market Revenue Million Forecast, by Region 2019 & 2032
- Table 2: Global Margarine Market Volume K Tons Forecast, by Region 2019 & 2032
- Table 3: Global Margarine Market Revenue Million Forecast, by Type 2019 & 2032
- Table 4: Global Margarine Market Volume K Tons Forecast, by Type 2019 & 2032
- Table 5: Global Margarine Market Revenue Million Forecast, by End User 2019 & 2032
- Table 6: Global Margarine Market Volume K Tons Forecast, by End User 2019 & 2032
- Table 7: Global Margarine Market Revenue Million Forecast, by Region 2019 & 2032
- Table 8: Global Margarine Market Volume K Tons Forecast, by Region 2019 & 2032
- Table 9: Global Margarine Market Revenue Million Forecast, by Country 2019 & 2032
- Table 10: Global Margarine Market Volume K Tons Forecast, by Country 2019 & 2032
- Table 11: United States Margarine Market Revenue (Million) Forecast, by Application 2019 & 2032
- Table 12: United States Margarine Market Volume (K Tons) Forecast, by Application 2019 & 2032
- Table 13: Canada Margarine Market Revenue (Million) Forecast, by Application 2019 & 2032
- Table 14: Canada Margarine Market Volume (K Tons) Forecast, by Application 2019 & 2032
- Table 15: Mexico Margarine Market Revenue (Million) Forecast, by Application 2019 & 2032
- Table 16: Mexico Margarine Market Volume (K Tons) Forecast, by Application 2019 & 2032
- Table 17: Rest of North America Margarine Market Revenue (Million) Forecast, by Application 2019 & 2032
- Table 18: Rest of North America Margarine Market Volume (K Tons) Forecast, by Application 2019 & 2032
- Table 19: Global Margarine Market Revenue Million Forecast, by Country 2019 & 2032
- Table 20: Global Margarine Market Volume K Tons Forecast, by Country 2019 & 2032
- Table 21: United Kingdom Margarine Market Revenue (Million) Forecast, by Application 2019 & 2032
- Table 22: United Kingdom Margarine Market Volume (K Tons) Forecast, by Application 2019 & 2032
- Table 23: Germany Margarine Market Revenue (Million) Forecast, by Application 2019 & 2032
- Table 24: Germany Margarine Market Volume (K Tons) Forecast, by Application 2019 & 2032
- Table 25: France Margarine Market Revenue (Million) Forecast, by Application 2019 & 2032
- Table 26: France Margarine Market Volume (K Tons) Forecast, by Application 2019 & 2032
- Table 27: Russia Margarine Market Revenue (Million) Forecast, by Application 2019 & 2032
- Table 28: Russia Margarine Market Volume (K Tons) Forecast, by Application 2019 & 2032
- Table 29: Italy Margarine Market Revenue (Million) Forecast, by Application 2019 & 2032
- Table 30: Italy Margarine Market Volume (K Tons) Forecast, by Application 2019 & 2032
- Table 31: Spain Margarine Market Revenue (Million) Forecast, by Application 2019 & 2032
- Table 32: Spain Margarine Market Volume (K Tons) Forecast, by Application 2019 & 2032
- Table 33: Rest of Europe Margarine Market Revenue (Million) Forecast, by Application 2019 & 2032
- Table 34: Rest of Europe Margarine Market Volume (K Tons) Forecast, by Application 2019 & 2032
- Table 35: Global Margarine Market Revenue Million Forecast, by Country 2019 & 2032
- Table 36: Global Margarine Market Volume K Tons Forecast, by Country 2019 & 2032
- Table 37: India Margarine Market Revenue (Million) Forecast, by Application 2019 & 2032
- Table 38: India Margarine Market Volume (K Tons) Forecast, by Application 2019 & 2032
- Table 39: China Margarine Market Revenue (Million) Forecast, by Application 2019 & 2032
- Table 40: China Margarine Market Volume (K Tons) Forecast, by Application 2019 & 2032
- Table 41: Japan Margarine Market Revenue (Million) Forecast, by Application 2019 & 2032
- Table 42: Japan Margarine Market Volume (K Tons) Forecast, by Application 2019 & 2032
- Table 43: Australia Margarine Market Revenue (Million) Forecast, by Application 2019 & 2032
- Table 44: Australia Margarine Market Volume (K Tons) Forecast, by Application 2019 & 2032
- Table 45: Rest of Asia Pacific Margarine Market Revenue (Million) Forecast, by Application 2019 & 2032
- Table 46: Rest of Asia Pacific Margarine Market Volume (K Tons) Forecast, by Application 2019 & 2032
- Table 47: Global Margarine Market Revenue Million Forecast, by Country 2019 & 2032
- Table 48: Global Margarine Market Volume K Tons Forecast, by Country 2019 & 2032
- Table 49: Brazil Margarine Market Revenue (Million) Forecast, by Application 2019 & 2032
- Table 50: Brazil Margarine Market Volume (K Tons) Forecast, by Application 2019 & 2032
- Table 51: Argentina Margarine Market Revenue (Million) Forecast, by Application 2019 & 2032
- Table 52: Argentina Margarine Market Volume (K Tons) Forecast, by Application 2019 & 2032
- Table 53: Rest of South America Margarine Market Revenue (Million) Forecast, by Application 2019 & 2032
- Table 54: Rest of South America Margarine Market Volume (K Tons) Forecast, by Application 2019 & 2032
- Table 55: Global Margarine Market Revenue Million Forecast, by Country 2019 & 2032
- Table 56: Global Margarine Market Volume K Tons Forecast, by Country 2019 & 2032
- Table 57: South Africa Margarine Market Revenue (Million) Forecast, by Application 2019 & 2032
- Table 58: South Africa Margarine Market Volume (K Tons) Forecast, by Application 2019 & 2032
- Table 59: United Arab Emirates Margarine Market Revenue (Million) Forecast, by Application 2019 & 2032
- Table 60: United Arab Emirates Margarine Market Volume (K Tons) Forecast, by Application 2019 & 2032
- Table 61: Rest of Middle East and Africa Margarine Market Revenue (Million) Forecast, by Application 2019 & 2032
- Table 62: Rest of Middle East and Africa Margarine Market Volume (K Tons) Forecast, by Application 2019 & 2032
- Table 63: Global Margarine Market Revenue Million Forecast, by Type 2019 & 2032
- Table 64: Global Margarine Market Volume K Tons Forecast, by Type 2019 & 2032
- Table 65: Global Margarine Market Revenue Million Forecast, by End User 2019 & 2032
- Table 66: Global Margarine Market Volume K Tons Forecast, by End User 2019 & 2032
- Table 67: Global Margarine Market Revenue Million Forecast, by Country 2019 & 2032
- Table 68: Global Margarine Market Volume K Tons Forecast, by Country 2019 & 2032
- Table 69: United States Margarine Market Revenue (Million) Forecast, by Application 2019 & 2032
- Table 70: United States Margarine Market Volume (K Tons) Forecast, by Application 2019 & 2032
- Table 71: Canada Margarine Market Revenue (Million) Forecast, by Application 2019 & 2032
- Table 72: Canada Margarine Market Volume (K Tons) Forecast, by Application 2019 & 2032
- Table 73: Mexico Margarine Market Revenue (Million) Forecast, by Application 2019 & 2032
- Table 74: Mexico Margarine Market Volume (K Tons) Forecast, by Application 2019 & 2032
- Table 75: Rest of North America Margarine Market Revenue (Million) Forecast, by Application 2019 & 2032
- Table 76: Rest of North America Margarine Market Volume (K Tons) Forecast, by Application 2019 & 2032
- Table 77: Global Margarine Market Revenue Million Forecast, by Type 2019 & 2032
- Table 78: Global Margarine Market Volume K Tons Forecast, by Type 2019 & 2032
- Table 79: Global Margarine Market Revenue Million Forecast, by End User 2019 & 2032
- Table 80: Global Margarine Market Volume K Tons Forecast, by End User 2019 & 2032
- Table 81: Global Margarine Market Revenue Million Forecast, by Country 2019 & 2032
- Table 82: Global Margarine Market Volume K Tons Forecast, by Country 2019 & 2032
- Table 83: United Kingdom Margarine Market Revenue (Million) Forecast, by Application 2019 & 2032
- Table 84: United Kingdom Margarine Market Volume (K Tons) Forecast, by Application 2019 & 2032
- Table 85: Germany Margarine Market Revenue (Million) Forecast, by Application 2019 & 2032
- Table 86: Germany Margarine Market Volume (K Tons) Forecast, by Application 2019 & 2032
- Table 87: France Margarine Market Revenue (Million) Forecast, by Application 2019 & 2032
- Table 88: France Margarine Market Volume (K Tons) Forecast, by Application 2019 & 2032
- Table 89: Russia Margarine Market Revenue (Million) Forecast, by Application 2019 & 2032
- Table 90: Russia Margarine Market Volume (K Tons) Forecast, by Application 2019 & 2032
- Table 91: Italy Margarine Market Revenue (Million) Forecast, by Application 2019 & 2032
- Table 92: Italy Margarine Market Volume (K Tons) Forecast, by Application 2019 & 2032
- Table 93: Spain Margarine Market Revenue (Million) Forecast, by Application 2019 & 2032
- Table 94: Spain Margarine Market Volume (K Tons) Forecast, by Application 2019 & 2032
- Table 95: Rest of Europe Margarine Market Revenue (Million) Forecast, by Application 2019 & 2032
- Table 96: Rest of Europe Margarine Market Volume (K Tons) Forecast, by Application 2019 & 2032
- Table 97: Global Margarine Market Revenue Million Forecast, by Type 2019 & 2032
- Table 98: Global Margarine Market Volume K Tons Forecast, by Type 2019 & 2032
- Table 99: Global Margarine Market Revenue Million Forecast, by End User 2019 & 2032
- Table 100: Global Margarine Market Volume K Tons Forecast, by End User 2019 & 2032
- Table 101: Global Margarine Market Revenue Million Forecast, by Country 2019 & 2032
- Table 102: Global Margarine Market Volume K Tons Forecast, by Country 2019 & 2032
- Table 103: India Margarine Market Revenue (Million) Forecast, by Application 2019 & 2032
- Table 104: India Margarine Market Volume (K Tons) Forecast, by Application 2019 & 2032
- Table 105: China Margarine Market Revenue (Million) Forecast, by Application 2019 & 2032
- Table 106: China Margarine Market Volume (K Tons) Forecast, by Application 2019 & 2032
- Table 107: Japan Margarine Market Revenue (Million) Forecast, by Application 2019 & 2032
- Table 108: Japan Margarine Market Volume (K Tons) Forecast, by Application 2019 & 2032
- Table 109: Australia Margarine Market Revenue (Million) Forecast, by Application 2019 & 2032
- Table 110: Australia Margarine Market Volume (K Tons) Forecast, by Application 2019 & 2032
- Table 111: Rest of Asia Pacific Margarine Market Revenue (Million) Forecast, by Application 2019 & 2032
- Table 112: Rest of Asia Pacific Margarine Market Volume (K Tons) Forecast, by Application 2019 & 2032
- Table 113: Global Margarine Market Revenue Million Forecast, by Type 2019 & 2032
- Table 114: Global Margarine Market Volume K Tons Forecast, by Type 2019 & 2032
- Table 115: Global Margarine Market Revenue Million Forecast, by End User 2019 & 2032
- Table 116: Global Margarine Market Volume K Tons Forecast, by End User 2019 & 2032
- Table 117: Global Margarine Market Revenue Million Forecast, by Country 2019 & 2032
- Table 118: Global Margarine Market Volume K Tons Forecast, by Country 2019 & 2032
- Table 119: Brazil Margarine Market Revenue (Million) Forecast, by Application 2019 & 2032
- Table 120: Brazil Margarine Market Volume (K Tons) Forecast, by Application 2019 & 2032
- Table 121: Argentina Margarine Market Revenue (Million) Forecast, by Application 2019 & 2032
- Table 122: Argentina Margarine Market Volume (K Tons) Forecast, by Application 2019 & 2032
- Table 123: Rest of South America Margarine Market Revenue (Million) Forecast, by Application 2019 & 2032
- Table 124: Rest of South America Margarine Market Volume (K Tons) Forecast, by Application 2019 & 2032
- Table 125: Global Margarine Market Revenue Million Forecast, by Type 2019 & 2032
- Table 126: Global Margarine Market Volume K Tons Forecast, by Type 2019 & 2032
- Table 127: Global Margarine Market Revenue Million Forecast, by End User 2019 & 2032
- Table 128: Global Margarine Market Volume K Tons Forecast, by End User 2019 & 2032
- Table 129: Global Margarine Market Revenue Million Forecast, by Country 2019 & 2032
- Table 130: Global Margarine Market Volume K Tons Forecast, by Country 2019 & 2032
- Table 131: South Africa Margarine Market Revenue (Million) Forecast, by Application 2019 & 2032
- Table 132: South Africa Margarine Market Volume (K Tons) Forecast, by Application 2019 & 2032
- Table 133: United Arab Emirates Margarine Market Revenue (Million) Forecast, by Application 2019 & 2032
- Table 134: United Arab Emirates Margarine Market Volume (K Tons) Forecast, by Application 2019 & 2032
- Table 135: Rest of Middle East and Africa Margarine Market Revenue (Million) Forecast, by Application 2019 & 2032
- Table 136: Rest of Middle East and Africa Margarine Market Volume (K Tons) Forecast, by Application 2019 & 2032
Frequently Asked Questions
1. What is the projected Compound Annual Growth Rate (CAGR) of the Margarine Market?
The projected CAGR is approximately 2.42%.
2. Which companies are prominent players in the Margarine Market?
Key companies in the market include Upfield BV, NMGK Group, Fuji Oil Co Ltd, Wilmar International, Bunge Limited, Conagra Brands Inc, Associated British Foods, Vandemoortele*List Not Exhaustive, Puratos NV, BRF SA, Richardson International Limited.
3. What are the main segments of the Margarine Market?
The market segments include Type, End User.
4. Can you provide details about the market size?
The market size is estimated to be USD 22.67 Million as of 2022.
5. What are some drivers contributing to market growth?
Growing Demand for Bakery and Confectionery Products; Increasing Awareness about the benefits of Vegetarian and Vegan Diets.
6. What are the notable trends driving market growth?
Rising Demand for Sustainable Foods.
7. Are there any restraints impacting market growth?
Stringent Regulations for Consumption of Trans-Fats.
8. Can you provide examples of recent developments in the market?
Upfield's partnership with IBM Food Trust to enhance supply chain transparency Conagra Brands' acquisition of Pinnacle Foods to expand its margarine portfolio Bunge's focus on sustainable palm oil production in response to environmental concerns
9. What pricing options are available for accessing the report?
Pricing options include single-user, multi-user, and enterprise licenses priced at USD 4750, USD 5250, and USD 8750 respectively.
10. Is the market size provided in terms of value or volume?
The market size is provided in terms of value, measured in Million and volume, measured in K Tons.
11. Are there any specific market keywords associated with the report?
Yes, the market keyword associated with the report is "Margarine Market," which aids in identifying and referencing the specific market segment covered.
12. How do I determine which pricing option suits my needs best?
The pricing options vary based on user requirements and access needs. Individual users may opt for single-user licenses, while businesses requiring broader access may choose multi-user or enterprise licenses for cost-effective access to the report.
13. Are there any additional resources or data provided in the Margarine Market report?
While the report offers comprehensive insights, it's advisable to review the specific contents or supplementary materials provided to ascertain if additional resources or data are available.
14. How can I stay updated on further developments or reports in the Margarine Market?
To stay informed about further developments, trends, and reports in the Margarine Market, consider subscribing to industry newsletters, following relevant companies and organizations, or regularly checking reputable industry news sources and publications.
Methodology
Step 1 - Identification of Relevant Samples Size from Population Database


Step 2 - Approaches for Defining Global Market Size (Value, Volume* & Price*)

Note*: In applicable scenarios
Step 3 - Data Sources
Primary Research
- Web Analytics
- Survey Reports
- Research Institute
- Latest Research Reports
- Opinion Leaders
Secondary Research
- Annual Reports
- White Paper
- Latest Press Release
- Industry Association
- Paid Database
- Investor Presentations

Step 4 - Data Triangulation
Involves using different sources of information in order to increase the validity of a study
These sources are likely to be stakeholders in a program - participants, other researchers, program staff, other community members, and so on.
Then we put all data in single framework & apply various statistical tools to find out the dynamic on the market.
During the analysis stage, feedback from the stakeholder groups would be compared to determine areas of agreement as well as areas of divergence
