

Key Insights
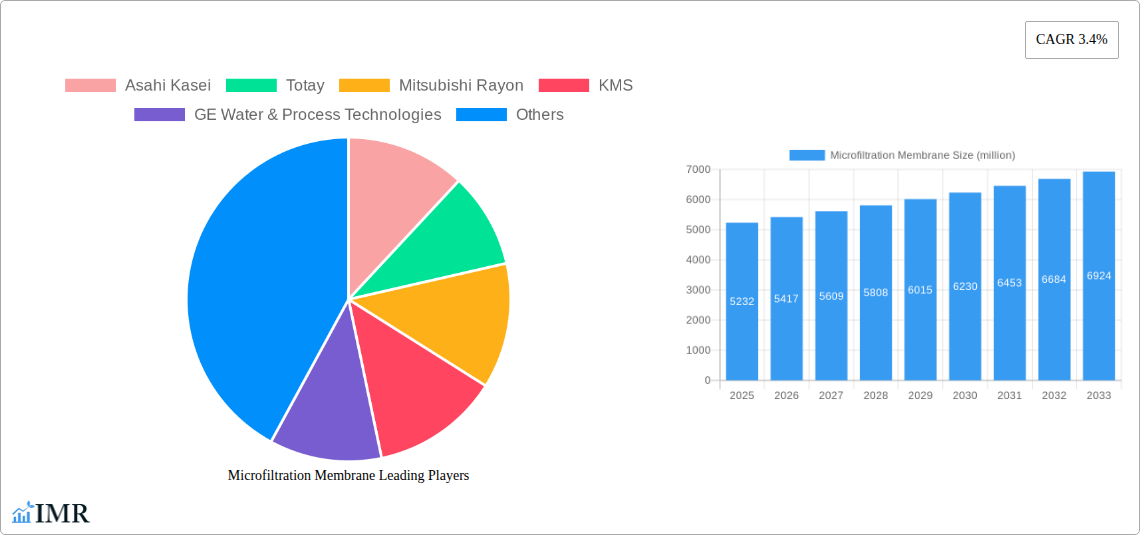
The global microfiltration membrane market, valued at $5.232 billion in 2025, is projected to experience steady growth, driven by increasing demand across various sectors. The Compound Annual Growth Rate (CAGR) of 3.4% from 2025 to 2033 indicates a robust, albeit moderate, expansion. Key drivers include the escalating need for water purification in industrial and municipal applications, coupled with rising environmental concerns and stricter regulations regarding water quality. The growth is further fueled by advancements in membrane technology, leading to improved efficiency, durability, and cost-effectiveness. Specific applications, such as wastewater treatment, food and beverage processing, and pharmaceutical manufacturing, are contributing significantly to market expansion. While the market faces challenges such as high initial investment costs and potential membrane fouling, ongoing innovation in membrane materials and cleaning techniques is mitigating these limitations. The competitive landscape comprises both established players like Asahi Kasei, Toyobo, and GE Water & Process Technologies, and emerging companies focusing on specialized membrane solutions. This dynamic interplay of factors suggests a continued, albeit measured, growth trajectory for the microfiltration membrane market in the coming years.
The market segmentation, while not explicitly provided, is likely diverse, encompassing various membrane materials (e.g., ceramic, polymeric), pore sizes, and applications. Regional differences in market growth will depend on factors such as infrastructure development, regulatory frameworks, and economic conditions. Developed regions like North America and Europe are expected to maintain a significant market share, while developing economies in Asia-Pacific and other regions present substantial growth opportunities. The market’s future success hinges on continuous technological advancements, strategic partnerships, and expanding applications across industries that demand higher water quality and efficient filtration solutions. The consistent development of more sustainable and energy-efficient membrane technologies will be crucial to maintaining this steady growth.
Microfiltration Membrane Market Report: 2019-2033
This comprehensive report provides an in-depth analysis of the global microfiltration membrane market, encompassing market dynamics, growth trends, regional insights, product landscapes, and key players. The study period covers 2019-2033, with 2025 serving as the base and estimated year. The forecast period spans 2025-2033, and the historical period encompasses 2019-2024. This report is invaluable for industry professionals, investors, and researchers seeking a thorough understanding of this dynamic market. The report utilizes both parent market (water treatment) and child market (membrane filtration) perspectives to offer a holistic view. Market values are presented in million units.
Microfiltration Membrane Market Dynamics & Structure
The global microfiltration membrane market is characterized by moderate concentration, with key players holding significant market share. Technological innovation, driven by the need for higher efficiency and sustainability, is a key driver. Stringent regulatory frameworks concerning water quality and environmental protection further shape market dynamics. Competitive substitutes, such as other filtration technologies (ultrafiltration, reverse osmosis), present challenges. End-user demographics, primarily encompassing the industrial, municipal, and pharmaceutical sectors, influence market demand. M&A activity has been moderate, with xx deals recorded between 2019-2024, resulting in a xx% market share shift among the top 5 players.
- Market Concentration: Moderately concentrated, with top 5 players holding approximately xx% market share in 2024.
- Technological Innovation: Focus on improving membrane materials, fouling resistance, and automation.
- Regulatory Landscape: Stringent regulations driving demand for advanced filtration solutions.
- Competitive Substitutes: Ultrafiltration, reverse osmosis, and other filtration methods pose competition.
- End-User Demographics: Industrial (xx%), Municipal (xx%), Pharmaceutical (xx%), and other sectors.
- M&A Activity: xx deals recorded between 2019-2024, leading to a xx% market share shift.
Microfiltration Membrane Growth Trends & Insights
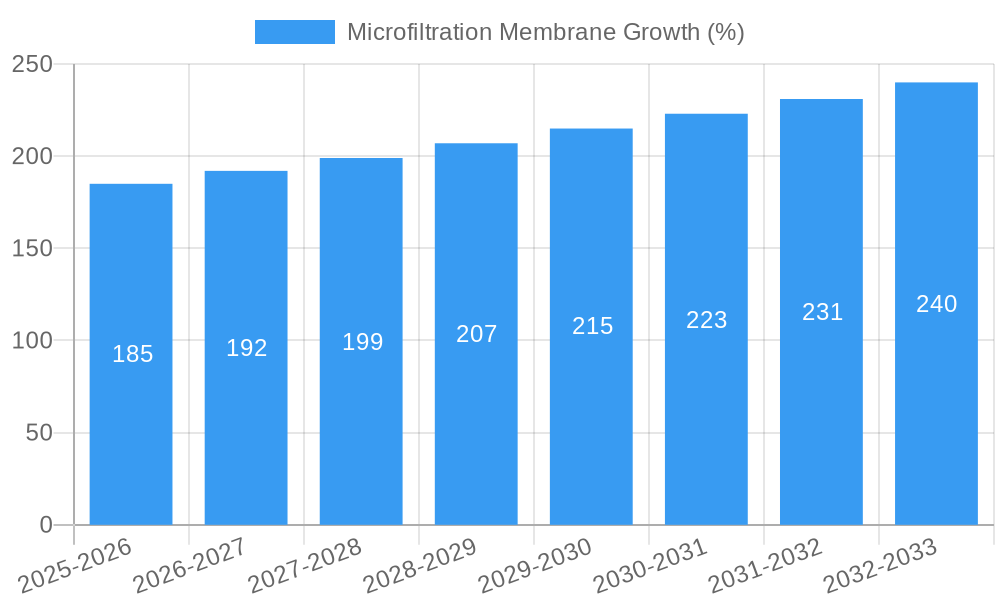
The global microfiltration membrane market exhibited a CAGR of xx% during the historical period (2019-2024), reaching a market size of xx million units in 2024. This growth is attributed to increasing industrialization, stricter environmental regulations, and rising awareness of water scarcity. Technological advancements, such as the development of more efficient and durable membranes, have further fueled market expansion. Market penetration remains relatively low in developing economies, representing a significant growth opportunity. Consumer behavior shifts toward sustainable and eco-friendly practices are also boosting demand. The forecast period (2025-2033) projects a CAGR of xx%, driven by factors such as increasing demand from emerging economies and continued technological innovation.
Dominant Regions, Countries, or Segments in Microfiltration Membrane
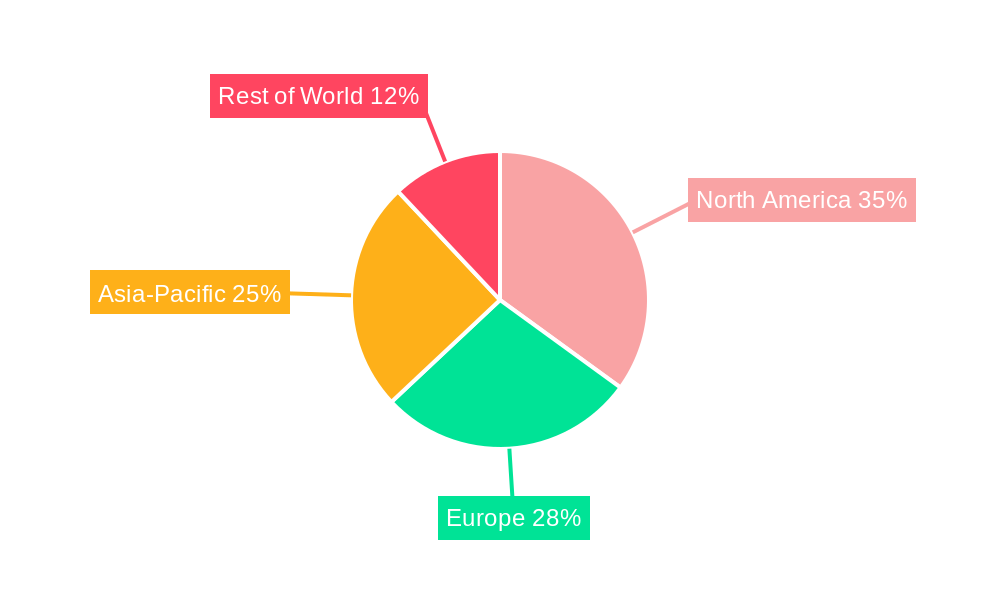
North America currently holds the largest market share in the microfiltration membrane market (xx%), followed by Europe (xx%) and Asia-Pacific (xx%). This dominance is driven by robust industrialization, stringent environmental regulations, and strong investments in water infrastructure. The Asia-Pacific region is projected to witness the fastest growth rate during the forecast period due to rapid industrialization and urbanization in emerging economies like India and China.
- North America: Strong regulatory framework, high industrial activity, established water infrastructure.
- Europe: Focus on sustainable water management, stringent environmental regulations, and significant government investments.
- Asia-Pacific: Rapid industrialization, urbanization, rising water scarcity issues, increasing government investments.
Microfiltration Membrane Product Landscape
Microfiltration membranes are available in various configurations, including hollow fiber, flat sheet, and spiral wound modules. Recent innovations focus on improving membrane materials (e.g., ceramic, polymeric) to enhance permeability, fouling resistance, and longevity. Unique selling propositions often center on specific applications (e.g., high-flow, high-selectivity) and enhanced cleaning protocols. Technological advancements include the integration of sensors for real-time monitoring and automated cleaning systems.
Key Drivers, Barriers & Challenges in Microfiltration Membrane
Key Drivers:
- Increasing industrialization and urbanization leading to higher water demand.
- Stringent government regulations regarding water quality and environmental protection.
- Growing awareness of water scarcity and the need for sustainable water management.
- Technological advancements resulting in improved membrane performance and cost-effectiveness.
Key Challenges:
- High initial investment costs associated with membrane systems.
- Membrane fouling and cleaning challenges reducing lifespan and efficiency.
- Competition from alternative filtration technologies.
- Supply chain disruptions affecting the availability of raw materials.
Emerging Opportunities in Microfiltration Membrane
Emerging opportunities lie in untapped markets (e.g., developing economies), innovative applications (e.g., water reuse, desalination), and evolving consumer preferences (e.g., sustainable solutions). The development of advanced membrane materials with enhanced performance characteristics presents significant growth potential. Integration of smart technologies (e.g., IoT sensors) for real-time monitoring and optimization of membrane systems offers further opportunities.
Growth Accelerators in the Microfiltration Membrane Industry
Technological breakthroughs, such as the development of novel membrane materials with enhanced performance, are key growth accelerators. Strategic partnerships between membrane manufacturers and water treatment companies are also driving market expansion. Market expansion strategies, including geographic diversification and penetration into new applications, are further fueling growth.
Key Players Shaping the Microfiltration Membrane Market
- Asahi Kasei
- Totay
- Mitsubishi Rayon
- KMS
- GE Water & Process Technologies
- Toyobo
- KUBOTA
- Sumitomo Electric Industries
- Evoqua
- X-Flow (Pentair)
- IMT
- Lenntech
- Synder Filtration
- MICRODYN-NADIR
- CLARCOR Industrial Air
- TriSep
- MOTIMO
- Origin Water
- Zhaojin Motian
- Ningbo Changqi Porous Membrane Technology
- RisingSun Membrane
- Delemil
- Yantai Gold Water Membrane
- AMFOR INC
Notable Milestones in Microfiltration Membrane Sector
- 2020: Launch of a new high-flux microfiltration membrane by Asahi Kasei.
- 2021: Acquisition of a smaller membrane manufacturer by GE Water & Process Technologies.
- 2022: Introduction of a novel ceramic microfiltration membrane with enhanced fouling resistance.
- 2023: Partnership between Toyobo and a major water treatment company to develop a new membrane application.
- 2024: Successful pilot testing of a novel self-cleaning microfiltration membrane.
In-Depth Microfiltration Membrane Market Outlook
The microfiltration membrane market is poised for significant growth driven by sustained technological advancements, increasing environmental concerns, and expanding industrialization. Strategic partnerships and market expansion into new geographic regions will be crucial factors for future success. The continued development of sustainable and cost-effective membrane technologies will shape the long-term outlook of this dynamic market. This presents substantial opportunities for players who can innovate and adapt to the changing market needs.
Microfiltration Membrane Segmentation
-
1. Application
- 1.1. Industry
- 1.2. Municipal Water
- 1.3. Wastewater
- 1.4. Others
-
2. Type
- 2.1. PVDF
- 2.2. PTFE
- 2.3. PES
- 2.4. Others
Microfiltration Membrane Segmentation By Geography
-
1. North America
- 1.1. United States
- 1.2. Canada
- 1.3. Mexico
-
2. South America
- 2.1. Brazil
- 2.2. Argentina
- 2.3. Rest of South America
-
3. Europe
- 3.1. United Kingdom
- 3.2. Germany
- 3.3. France
- 3.4. Italy
- 3.5. Spain
- 3.6. Russia
- 3.7. Benelux
- 3.8. Nordics
- 3.9. Rest of Europe
-
4. Middle East & Africa
- 4.1. Turkey
- 4.2. Israel
- 4.3. GCC
- 4.4. North Africa
- 4.5. South Africa
- 4.6. Rest of Middle East & Africa
-
5. Asia Pacific
- 5.1. China
- 5.2. India
- 5.3. Japan
- 5.4. South Korea
- 5.5. ASEAN
- 5.6. Oceania
- 5.7. Rest of Asia Pacific
Microfiltration Membrane REPORT HIGHLIGHTS
| Aspects | Details |
|---|---|
| Study Period | 2019-2033 |
| Base Year | 2024 |
| Estimated Year | 2025 |
| Forecast Period | 2025-2033 |
| Historical Period | 2019-2024 |
| Growth Rate | CAGR of 3.4% from 2019-2033 |
| Segmentation |
|
Table of Contents
- 1. Introduction
- 1.1. Research Scope
- 1.2. Market Segmentation
- 1.3. Research Methodology
- 1.4. Definitions and Assumptions
- 2. Executive Summary
- 2.1. Introduction
- 3. Market Dynamics
- 3.1. Introduction
- 3.2. Market Drivers
- 3.3. Market Restrains
- 3.4. Market Trends
- 4. Market Factor Analysis
- 4.1. Porters Five Forces
- 4.2. Supply/Value Chain
- 4.3. PESTEL analysis
- 4.4. Market Entropy
- 4.5. Patent/Trademark Analysis
- 5. Global Microfiltration Membrane Analysis, Insights and Forecast, 2019-2031
- 5.1. Market Analysis, Insights and Forecast - by Application
- 5.1.1. Industry
- 5.1.2. Municipal Water
- 5.1.3. Wastewater
- 5.1.4. Others
- 5.2. Market Analysis, Insights and Forecast - by Type
- 5.2.1. PVDF
- 5.2.2. PTFE
- 5.2.3. PES
- 5.2.4. Others
- 5.3. Market Analysis, Insights and Forecast - by Region
- 5.3.1. North America
- 5.3.2. South America
- 5.3.3. Europe
- 5.3.4. Middle East & Africa
- 5.3.5. Asia Pacific
- 5.1. Market Analysis, Insights and Forecast - by Application
- 6. North America Microfiltration Membrane Analysis, Insights and Forecast, 2019-2031
- 6.1. Market Analysis, Insights and Forecast - by Application
- 6.1.1. Industry
- 6.1.2. Municipal Water
- 6.1.3. Wastewater
- 6.1.4. Others
- 6.2. Market Analysis, Insights and Forecast - by Type
- 6.2.1. PVDF
- 6.2.2. PTFE
- 6.2.3. PES
- 6.2.4. Others
- 6.1. Market Analysis, Insights and Forecast - by Application
- 7. South America Microfiltration Membrane Analysis, Insights and Forecast, 2019-2031
- 7.1. Market Analysis, Insights and Forecast - by Application
- 7.1.1. Industry
- 7.1.2. Municipal Water
- 7.1.3. Wastewater
- 7.1.4. Others
- 7.2. Market Analysis, Insights and Forecast - by Type
- 7.2.1. PVDF
- 7.2.2. PTFE
- 7.2.3. PES
- 7.2.4. Others
- 7.1. Market Analysis, Insights and Forecast - by Application
- 8. Europe Microfiltration Membrane Analysis, Insights and Forecast, 2019-2031
- 8.1. Market Analysis, Insights and Forecast - by Application
- 8.1.1. Industry
- 8.1.2. Municipal Water
- 8.1.3. Wastewater
- 8.1.4. Others
- 8.2. Market Analysis, Insights and Forecast - by Type
- 8.2.1. PVDF
- 8.2.2. PTFE
- 8.2.3. PES
- 8.2.4. Others
- 8.1. Market Analysis, Insights and Forecast - by Application
- 9. Middle East & Africa Microfiltration Membrane Analysis, Insights and Forecast, 2019-2031
- 9.1. Market Analysis, Insights and Forecast - by Application
- 9.1.1. Industry
- 9.1.2. Municipal Water
- 9.1.3. Wastewater
- 9.1.4. Others
- 9.2. Market Analysis, Insights and Forecast - by Type
- 9.2.1. PVDF
- 9.2.2. PTFE
- 9.2.3. PES
- 9.2.4. Others
- 9.1. Market Analysis, Insights and Forecast - by Application
- 10. Asia Pacific Microfiltration Membrane Analysis, Insights and Forecast, 2019-2031
- 10.1. Market Analysis, Insights and Forecast - by Application
- 10.1.1. Industry
- 10.1.2. Municipal Water
- 10.1.3. Wastewater
- 10.1.4. Others
- 10.2. Market Analysis, Insights and Forecast - by Type
- 10.2.1. PVDF
- 10.2.2. PTFE
- 10.2.3. PES
- 10.2.4. Others
- 10.1. Market Analysis, Insights and Forecast - by Application
- 11. Competitive Analysis
- 11.1. Global Market Share Analysis 2024
- 11.2. Company Profiles
- 11.2.1 Asahi Kasei
- 11.2.1.1. Overview
- 11.2.1.2. Products
- 11.2.1.3. SWOT Analysis
- 11.2.1.4. Recent Developments
- 11.2.1.5. Financials (Based on Availability)
- 11.2.2 Totay
- 11.2.2.1. Overview
- 11.2.2.2. Products
- 11.2.2.3. SWOT Analysis
- 11.2.2.4. Recent Developments
- 11.2.2.5. Financials (Based on Availability)
- 11.2.3 Mitsubishi Rayon
- 11.2.3.1. Overview
- 11.2.3.2. Products
- 11.2.3.3. SWOT Analysis
- 11.2.3.4. Recent Developments
- 11.2.3.5. Financials (Based on Availability)
- 11.2.4 KMS
- 11.2.4.1. Overview
- 11.2.4.2. Products
- 11.2.4.3. SWOT Analysis
- 11.2.4.4. Recent Developments
- 11.2.4.5. Financials (Based on Availability)
- 11.2.5 GE Water & Process Technologies
- 11.2.5.1. Overview
- 11.2.5.2. Products
- 11.2.5.3. SWOT Analysis
- 11.2.5.4. Recent Developments
- 11.2.5.5. Financials (Based on Availability)
- 11.2.6 Toyobo
- 11.2.6.1. Overview
- 11.2.6.2. Products
- 11.2.6.3. SWOT Analysis
- 11.2.6.4. Recent Developments
- 11.2.6.5. Financials (Based on Availability)
- 11.2.7 KUBOTA
- 11.2.7.1. Overview
- 11.2.7.2. Products
- 11.2.7.3. SWOT Analysis
- 11.2.7.4. Recent Developments
- 11.2.7.5. Financials (Based on Availability)
- 11.2.8 Sumitomo Electric Industries
- 11.2.8.1. Overview
- 11.2.8.2. Products
- 11.2.8.3. SWOT Analysis
- 11.2.8.4. Recent Developments
- 11.2.8.5. Financials (Based on Availability)
- 11.2.9 Evoqua
- 11.2.9.1. Overview
- 11.2.9.2. Products
- 11.2.9.3. SWOT Analysis
- 11.2.9.4. Recent Developments
- 11.2.9.5. Financials (Based on Availability)
- 11.2.10 X-Flow (Pentair)
- 11.2.10.1. Overview
- 11.2.10.2. Products
- 11.2.10.3. SWOT Analysis
- 11.2.10.4. Recent Developments
- 11.2.10.5. Financials (Based on Availability)
- 11.2.11 IMT
- 11.2.11.1. Overview
- 11.2.11.2. Products
- 11.2.11.3. SWOT Analysis
- 11.2.11.4. Recent Developments
- 11.2.11.5. Financials (Based on Availability)
- 11.2.12 Lenntech
- 11.2.12.1. Overview
- 11.2.12.2. Products
- 11.2.12.3. SWOT Analysis
- 11.2.12.4. Recent Developments
- 11.2.12.5. Financials (Based on Availability)
- 11.2.13 Synder Filtration
- 11.2.13.1. Overview
- 11.2.13.2. Products
- 11.2.13.3. SWOT Analysis
- 11.2.13.4. Recent Developments
- 11.2.13.5. Financials (Based on Availability)
- 11.2.14 MICRODYN-NADIR
- 11.2.14.1. Overview
- 11.2.14.2. Products
- 11.2.14.3. SWOT Analysis
- 11.2.14.4. Recent Developments
- 11.2.14.5. Financials (Based on Availability)
- 11.2.15 CLARCOR Industrial Air
- 11.2.15.1. Overview
- 11.2.15.2. Products
- 11.2.15.3. SWOT Analysis
- 11.2.15.4. Recent Developments
- 11.2.15.5. Financials (Based on Availability)
- 11.2.16 TriSep
- 11.2.16.1. Overview
- 11.2.16.2. Products
- 11.2.16.3. SWOT Analysis
- 11.2.16.4. Recent Developments
- 11.2.16.5. Financials (Based on Availability)
- 11.2.17 MOTIMO
- 11.2.17.1. Overview
- 11.2.17.2. Products
- 11.2.17.3. SWOT Analysis
- 11.2.17.4. Recent Developments
- 11.2.17.5. Financials (Based on Availability)
- 11.2.18 Origin Water
- 11.2.18.1. Overview
- 11.2.18.2. Products
- 11.2.18.3. SWOT Analysis
- 11.2.18.4. Recent Developments
- 11.2.18.5. Financials (Based on Availability)
- 11.2.19 Zhaojin Motian
- 11.2.19.1. Overview
- 11.2.19.2. Products
- 11.2.19.3. SWOT Analysis
- 11.2.19.4. Recent Developments
- 11.2.19.5. Financials (Based on Availability)
- 11.2.20 Ningbo Changqi Porous Membrane Technology
- 11.2.20.1. Overview
- 11.2.20.2. Products
- 11.2.20.3. SWOT Analysis
- 11.2.20.4. Recent Developments
- 11.2.20.5. Financials (Based on Availability)
- 11.2.21 RisingSun Membrane
- 11.2.21.1. Overview
- 11.2.21.2. Products
- 11.2.21.3. SWOT Analysis
- 11.2.21.4. Recent Developments
- 11.2.21.5. Financials (Based on Availability)
- 11.2.22 Delemil
- 11.2.22.1. Overview
- 11.2.22.2. Products
- 11.2.22.3. SWOT Analysis
- 11.2.22.4. Recent Developments
- 11.2.22.5. Financials (Based on Availability)
- 11.2.23 Yantai Gold Water Membrane
- 11.2.23.1. Overview
- 11.2.23.2. Products
- 11.2.23.3. SWOT Analysis
- 11.2.23.4. Recent Developments
- 11.2.23.5. Financials (Based on Availability)
- 11.2.24 AMFOR INC
- 11.2.24.1. Overview
- 11.2.24.2. Products
- 11.2.24.3. SWOT Analysis
- 11.2.24.4. Recent Developments
- 11.2.24.5. Financials (Based on Availability)
- 11.2.1 Asahi Kasei
List of Figures
- Figure 1: Global Microfiltration Membrane Revenue Breakdown (million, %) by Region 2024 & 2032
- Figure 2: North America Microfiltration Membrane Revenue (million), by Application 2024 & 2032
- Figure 3: North America Microfiltration Membrane Revenue Share (%), by Application 2024 & 2032
- Figure 4: North America Microfiltration Membrane Revenue (million), by Type 2024 & 2032
- Figure 5: North America Microfiltration Membrane Revenue Share (%), by Type 2024 & 2032
- Figure 6: North America Microfiltration Membrane Revenue (million), by Country 2024 & 2032
- Figure 7: North America Microfiltration Membrane Revenue Share (%), by Country 2024 & 2032
- Figure 8: South America Microfiltration Membrane Revenue (million), by Application 2024 & 2032
- Figure 9: South America Microfiltration Membrane Revenue Share (%), by Application 2024 & 2032
- Figure 10: South America Microfiltration Membrane Revenue (million), by Type 2024 & 2032
- Figure 11: South America Microfiltration Membrane Revenue Share (%), by Type 2024 & 2032
- Figure 12: South America Microfiltration Membrane Revenue (million), by Country 2024 & 2032
- Figure 13: South America Microfiltration Membrane Revenue Share (%), by Country 2024 & 2032
- Figure 14: Europe Microfiltration Membrane Revenue (million), by Application 2024 & 2032
- Figure 15: Europe Microfiltration Membrane Revenue Share (%), by Application 2024 & 2032
- Figure 16: Europe Microfiltration Membrane Revenue (million), by Type 2024 & 2032
- Figure 17: Europe Microfiltration Membrane Revenue Share (%), by Type 2024 & 2032
- Figure 18: Europe Microfiltration Membrane Revenue (million), by Country 2024 & 2032
- Figure 19: Europe Microfiltration Membrane Revenue Share (%), by Country 2024 & 2032
- Figure 20: Middle East & Africa Microfiltration Membrane Revenue (million), by Application 2024 & 2032
- Figure 21: Middle East & Africa Microfiltration Membrane Revenue Share (%), by Application 2024 & 2032
- Figure 22: Middle East & Africa Microfiltration Membrane Revenue (million), by Type 2024 & 2032
- Figure 23: Middle East & Africa Microfiltration Membrane Revenue Share (%), by Type 2024 & 2032
- Figure 24: Middle East & Africa Microfiltration Membrane Revenue (million), by Country 2024 & 2032
- Figure 25: Middle East & Africa Microfiltration Membrane Revenue Share (%), by Country 2024 & 2032
- Figure 26: Asia Pacific Microfiltration Membrane Revenue (million), by Application 2024 & 2032
- Figure 27: Asia Pacific Microfiltration Membrane Revenue Share (%), by Application 2024 & 2032
- Figure 28: Asia Pacific Microfiltration Membrane Revenue (million), by Type 2024 & 2032
- Figure 29: Asia Pacific Microfiltration Membrane Revenue Share (%), by Type 2024 & 2032
- Figure 30: Asia Pacific Microfiltration Membrane Revenue (million), by Country 2024 & 2032
- Figure 31: Asia Pacific Microfiltration Membrane Revenue Share (%), by Country 2024 & 2032
List of Tables
- Table 1: Global Microfiltration Membrane Revenue million Forecast, by Region 2019 & 2032
- Table 2: Global Microfiltration Membrane Revenue million Forecast, by Application 2019 & 2032
- Table 3: Global Microfiltration Membrane Revenue million Forecast, by Type 2019 & 2032
- Table 4: Global Microfiltration Membrane Revenue million Forecast, by Region 2019 & 2032
- Table 5: Global Microfiltration Membrane Revenue million Forecast, by Application 2019 & 2032
- Table 6: Global Microfiltration Membrane Revenue million Forecast, by Type 2019 & 2032
- Table 7: Global Microfiltration Membrane Revenue million Forecast, by Country 2019 & 2032
- Table 8: United States Microfiltration Membrane Revenue (million) Forecast, by Application 2019 & 2032
- Table 9: Canada Microfiltration Membrane Revenue (million) Forecast, by Application 2019 & 2032
- Table 10: Mexico Microfiltration Membrane Revenue (million) Forecast, by Application 2019 & 2032
- Table 11: Global Microfiltration Membrane Revenue million Forecast, by Application 2019 & 2032
- Table 12: Global Microfiltration Membrane Revenue million Forecast, by Type 2019 & 2032
- Table 13: Global Microfiltration Membrane Revenue million Forecast, by Country 2019 & 2032
- Table 14: Brazil Microfiltration Membrane Revenue (million) Forecast, by Application 2019 & 2032
- Table 15: Argentina Microfiltration Membrane Revenue (million) Forecast, by Application 2019 & 2032
- Table 16: Rest of South America Microfiltration Membrane Revenue (million) Forecast, by Application 2019 & 2032
- Table 17: Global Microfiltration Membrane Revenue million Forecast, by Application 2019 & 2032
- Table 18: Global Microfiltration Membrane Revenue million Forecast, by Type 2019 & 2032
- Table 19: Global Microfiltration Membrane Revenue million Forecast, by Country 2019 & 2032
- Table 20: United Kingdom Microfiltration Membrane Revenue (million) Forecast, by Application 2019 & 2032
- Table 21: Germany Microfiltration Membrane Revenue (million) Forecast, by Application 2019 & 2032
- Table 22: France Microfiltration Membrane Revenue (million) Forecast, by Application 2019 & 2032
- Table 23: Italy Microfiltration Membrane Revenue (million) Forecast, by Application 2019 & 2032
- Table 24: Spain Microfiltration Membrane Revenue (million) Forecast, by Application 2019 & 2032
- Table 25: Russia Microfiltration Membrane Revenue (million) Forecast, by Application 2019 & 2032
- Table 26: Benelux Microfiltration Membrane Revenue (million) Forecast, by Application 2019 & 2032
- Table 27: Nordics Microfiltration Membrane Revenue (million) Forecast, by Application 2019 & 2032
- Table 28: Rest of Europe Microfiltration Membrane Revenue (million) Forecast, by Application 2019 & 2032
- Table 29: Global Microfiltration Membrane Revenue million Forecast, by Application 2019 & 2032
- Table 30: Global Microfiltration Membrane Revenue million Forecast, by Type 2019 & 2032
- Table 31: Global Microfiltration Membrane Revenue million Forecast, by Country 2019 & 2032
- Table 32: Turkey Microfiltration Membrane Revenue (million) Forecast, by Application 2019 & 2032
- Table 33: Israel Microfiltration Membrane Revenue (million) Forecast, by Application 2019 & 2032
- Table 34: GCC Microfiltration Membrane Revenue (million) Forecast, by Application 2019 & 2032
- Table 35: North Africa Microfiltration Membrane Revenue (million) Forecast, by Application 2019 & 2032
- Table 36: South Africa Microfiltration Membrane Revenue (million) Forecast, by Application 2019 & 2032
- Table 37: Rest of Middle East & Africa Microfiltration Membrane Revenue (million) Forecast, by Application 2019 & 2032
- Table 38: Global Microfiltration Membrane Revenue million Forecast, by Application 2019 & 2032
- Table 39: Global Microfiltration Membrane Revenue million Forecast, by Type 2019 & 2032
- Table 40: Global Microfiltration Membrane Revenue million Forecast, by Country 2019 & 2032
- Table 41: China Microfiltration Membrane Revenue (million) Forecast, by Application 2019 & 2032
- Table 42: India Microfiltration Membrane Revenue (million) Forecast, by Application 2019 & 2032
- Table 43: Japan Microfiltration Membrane Revenue (million) Forecast, by Application 2019 & 2032
- Table 44: South Korea Microfiltration Membrane Revenue (million) Forecast, by Application 2019 & 2032
- Table 45: ASEAN Microfiltration Membrane Revenue (million) Forecast, by Application 2019 & 2032
- Table 46: Oceania Microfiltration Membrane Revenue (million) Forecast, by Application 2019 & 2032
- Table 47: Rest of Asia Pacific Microfiltration Membrane Revenue (million) Forecast, by Application 2019 & 2032
Frequently Asked Questions
1. What is the projected Compound Annual Growth Rate (CAGR) of the Microfiltration Membrane?
The projected CAGR is approximately 3.4%.
2. Which companies are prominent players in the Microfiltration Membrane?
Key companies in the market include Asahi Kasei, Totay, Mitsubishi Rayon, KMS, GE Water & Process Technologies, Toyobo, KUBOTA, Sumitomo Electric Industries, Evoqua, X-Flow (Pentair), IMT, Lenntech, Synder Filtration, MICRODYN-NADIR, CLARCOR Industrial Air, TriSep, MOTIMO, Origin Water, Zhaojin Motian, Ningbo Changqi Porous Membrane Technology, RisingSun Membrane, Delemil, Yantai Gold Water Membrane, AMFOR INC.
3. What are the main segments of the Microfiltration Membrane?
The market segments include Application, Type.
4. Can you provide details about the market size?
The market size is estimated to be USD 5232 million as of 2022.
5. What are some drivers contributing to market growth?
N/A
6. What are the notable trends driving market growth?
N/A
7. Are there any restraints impacting market growth?
N/A
8. Can you provide examples of recent developments in the market?
N/A
9. What pricing options are available for accessing the report?
Pricing options include single-user, multi-user, and enterprise licenses priced at USD 5900.00, USD 8850.00, and USD 11800.00 respectively.
10. Is the market size provided in terms of value or volume?
The market size is provided in terms of value, measured in million.
11. Are there any specific market keywords associated with the report?
Yes, the market keyword associated with the report is "Microfiltration Membrane," which aids in identifying and referencing the specific market segment covered.
12. How do I determine which pricing option suits my needs best?
The pricing options vary based on user requirements and access needs. Individual users may opt for single-user licenses, while businesses requiring broader access may choose multi-user or enterprise licenses for cost-effective access to the report.
13. Are there any additional resources or data provided in the Microfiltration Membrane report?
While the report offers comprehensive insights, it's advisable to review the specific contents or supplementary materials provided to ascertain if additional resources or data are available.
14. How can I stay updated on further developments or reports in the Microfiltration Membrane?
To stay informed about further developments, trends, and reports in the Microfiltration Membrane, consider subscribing to industry newsletters, following relevant companies and organizations, or regularly checking reputable industry news sources and publications.
Methodology
Step 1 - Identification of Relevant Samples Size from Population Database


Step 2 - Approaches for Defining Global Market Size (Value, Volume* & Price*)

Note*: In applicable scenarios
Step 3 - Data Sources
Primary Research
- Web Analytics
- Survey Reports
- Research Institute
- Latest Research Reports
- Opinion Leaders
Secondary Research
- Annual Reports
- White Paper
- Latest Press Release
- Industry Association
- Paid Database
- Investor Presentations

Step 4 - Data Triangulation
Involves using different sources of information in order to increase the validity of a study
These sources are likely to be stakeholders in a program - participants, other researchers, program staff, other community members, and so on.
Then we put all data in single framework & apply various statistical tools to find out the dynamic on the market.
During the analysis stage, feedback from the stakeholder groups would be compared to determine areas of agreement as well as areas of divergence
