

Key Insights
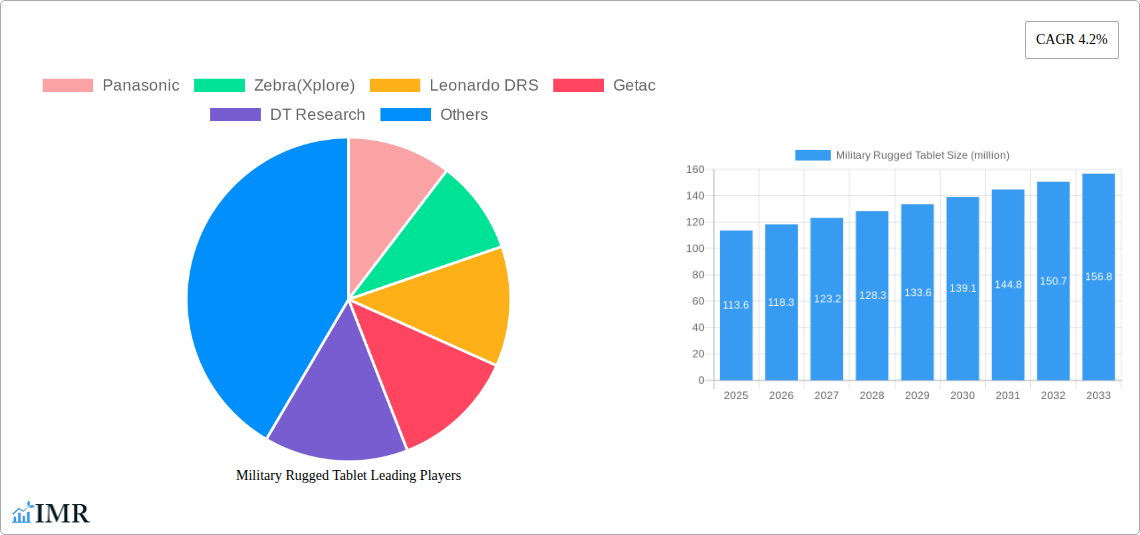
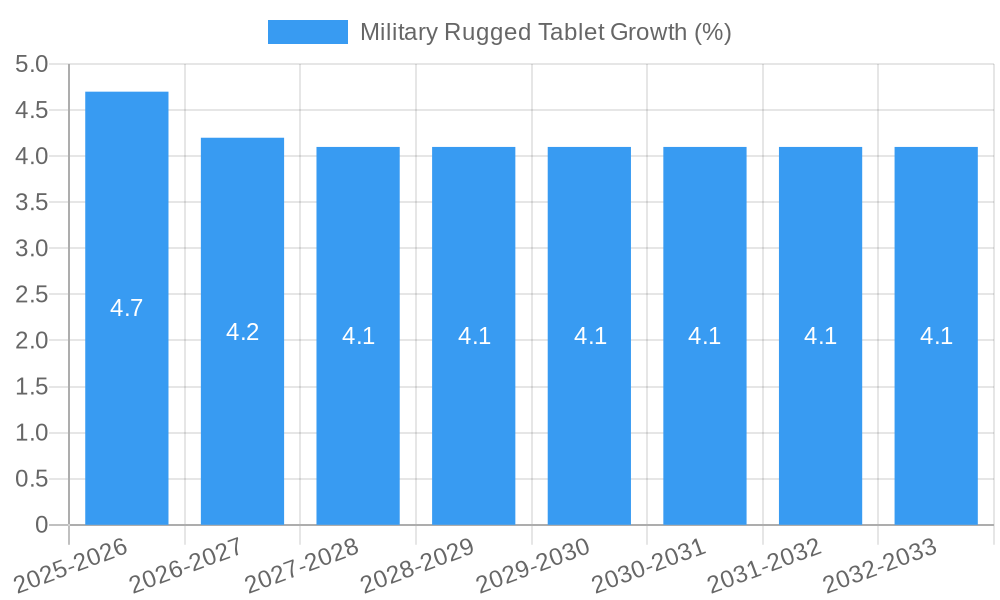
The military rugged tablet market, valued at $113.6 million in 2025, is projected to experience robust growth, driven by increasing demand for lightweight, durable computing devices in military operations. The Compound Annual Growth Rate (CAGR) of 4.2% from 2025 to 2033 indicates a steady expansion, fueled by several key factors. Technological advancements leading to improved processing power, enhanced battery life, and superior ruggedness are significantly impacting market growth. The integration of advanced features like augmented reality (AR) and improved satellite communication capabilities further enhances the appeal of these tablets for military applications, including battlefield communication, situational awareness, and data management. Furthermore, rising defense budgets globally and a growing emphasis on modernization across various military branches contribute to the expanding market. Competitive pressures among established players like Panasonic, Zebra Technologies, and Getac, along with the emergence of innovative startups, are driving innovation and ensuring a diverse product landscape. However, high initial investment costs associated with these specialized devices and the need for regular software updates pose potential restraints to wider adoption.
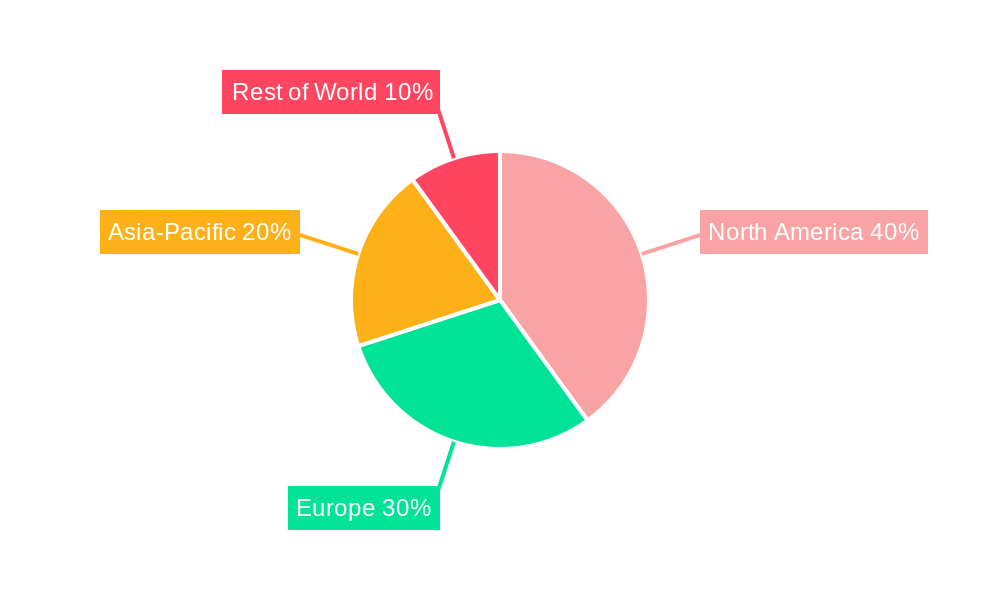
The market segmentation, while not explicitly provided, is likely to include variations based on screen size, processing power, ruggedness certifications (MIL-STD-810), operating systems (Android, Windows), and specific features like thermal imaging or advanced GPS capabilities. Geographical distribution will show significant regional variations, with North America and Europe likely holding the largest market shares due to high defense spending and technologically advanced militaries. Asia-Pacific is expected to witness significant growth over the forecast period, driven by increasing military modernization efforts and technological advancements in the region. The competitive landscape is characterized by a mix of established players and specialized manufacturers, leading to a dynamic market with ongoing product innovation and strategic partnerships. This evolution will continue to shape the trajectory of the military rugged tablet market in the coming years.
Military Rugged Tablet Market Report: 2019-2033
This comprehensive report provides an in-depth analysis of the Military Rugged Tablet market, projecting robust growth from 2019 to 2033. We analyze market dynamics, key players, technological advancements, and regional variations to provide a complete picture for industry professionals. The report leverages extensive data to forecast significant expansion, driven by increasing demand across defense and related sectors. The parent market is the broader ruggedized computing market, while the child market focuses specifically on military applications.
Study Period: 2019–2033 | Base Year: 2025 | Estimated Year: 2025 | Forecast Period: 2025–2033 | Historical Period: 2019–2024
Military Rugged Tablet Market Dynamics & Structure
This section analyzes the competitive landscape, technological advancements, regulatory influences, and market trends within the Military Rugged Tablet market. The market is moderately concentrated, with several key players holding significant shares, while smaller niche players contribute to innovation and competition. Market concentration is estimated at xx% in 2025, with the top 5 players holding xx% of the market share.
- Market Concentration: Moderately concentrated, with a few major players dominating.
- Technological Innovation: Driven by advancements in processing power, display technology, battery life, and ruggedization features. Innovation barriers include high R&D costs and stringent military standards.
- Regulatory Frameworks: Stringent military and government standards significantly influence product development and adoption. Compliance with these standards requires significant investment and testing.
- Competitive Product Substitutes: Alternative devices, such as ruggedized laptops and smartphones, pose some level of competition, however, specialized features of military-grade tablets remain key differentiators.
- End-User Demographics: Primarily military personnel, law enforcement, and government agencies, with varied needs depending on specific applications.
- M&A Trends: Moderate activity with several mergers and acquisitions aimed at expanding market share and technological capabilities. An estimated xx M&A deals were concluded in the period 2019-2024. Further consolidation is expected.
Military Rugged Tablet Growth Trends & Insights
The Military Rugged Tablet market exhibited strong growth during the historical period (2019-2024), driven by increased defense spending and demand for advanced communication and data management tools. We project this trend to continue through 2033. The market size reached xx million units in 2024 and is forecast to reach xx million units by 2033, reflecting a CAGR of xx%. This growth is fuelled by increasing adoption rates among military personnel and government agencies. Technological advancements such as enhanced processing power, improved battery life, and advanced security features also contribute to the growth.
Dominant Regions, Countries, or Segments in Military Rugged Tablet
North America holds the largest market share in the Military Rugged Tablet segment, driven by high defense spending and the presence of key technology providers. Europe follows closely, with a significant market presence particularly in countries with large defense budgets. Asia-Pacific is expected to witness rapid growth due to increasing defense modernization and government investments in infrastructure.
- North America: High defense spending, presence of major manufacturers.
- Europe: Substantial defense budgets, technological advancements.
- Asia-Pacific: Increasing defense modernization, government investments in infrastructure.
Military Rugged Tablet Product Landscape
Military rugged tablets are designed to withstand harsh environmental conditions and offer robust features, including high-brightness displays, extended battery life, and enhanced security. Key features include drop resistance, water resistance, and MIL-STD-810 compliance. Technological advancements focus on miniaturization, improved processing power, and integration of advanced communication technologies. Unique selling propositions include specialized software and hardware for military applications, such as encrypted communication and secure data storage.
Key Drivers, Barriers & Challenges in Military Rugged Tablet
Key Drivers:
- Increasing demand for advanced battlefield technologies.
- Growing defense budgets globally.
- Technological advancements enhancing ruggedization and functionality.
Challenges & Restraints:
- High initial investment cost for procuring ruggedized tablets.
- Stringent regulatory compliance requirements.
- Intense competition among manufacturers. Price pressure, particularly from low-cost providers, can impact profit margins.
Emerging Opportunities in Military Rugged Tablet
Emerging opportunities lie in specialized applications, such as integration with advanced sensor systems and UAVs. Growing adoption of AI and machine learning in military applications also present significant potential. Untapped markets in developing countries with growing defense budgets offer further opportunities for expansion.
Growth Accelerators in the Military Rugged Tablet Industry
The Military Rugged Tablet market's continued growth will be driven by technological advancements, strategic partnerships between technology companies and defense organizations, and expansion into new geographic markets. Furthermore, government initiatives promoting modernization of defense capabilities will significantly influence market expansion.
Key Players Shaping the Military Rugged Tablet Market
- Panasonic
- Zebra (Xplore)
- Leonardo DRS
- Getac
- DT Research
- Dell
- MobileDemand
- AAEON
- NEXCOM
- HP
- MilDef
- Trimble
- Kontron
- Samsung
- Winmate
- Xenarc Technologies
- JLT Mobile Computers
- Estone Technology
- RuggON
- Rugged Sumo
- Logic Instrument (ARCHOS)
- Bright Alliance Technology
- Conker
Notable Milestones in Military Rugged Tablet Sector
- 2020: Introduction of 5G-enabled rugged tablets by several key players.
- 2021: Several significant partnerships formed between technology companies and defense contractors.
- 2022: Launch of tablets with enhanced AI and machine learning capabilities.
- 2023: Increased focus on cybersecurity and data encryption in rugged tablet designs.
In-Depth Military Rugged Tablet Market Outlook
The Military Rugged Tablet market is poised for significant growth over the forecast period, driven by ongoing technological advancements, increasing defense spending, and expanding adoption across various military applications. Strategic partnerships and expansion into new markets will further accelerate this growth. The market will continue to consolidate, with leading players focusing on innovation and product differentiation to maintain competitive advantage.
Military Rugged Tablet Segmentation
-
1. Application
- 1.1. Air Force
- 1.2. Army
- 1.3. Navy
-
2. Types
- 2.1. Windows System
- 2.2. Android System
Military Rugged Tablet Segmentation By Geography
-
1. North America
- 1.1. United States
- 1.2. Canada
- 1.3. Mexico
-
2. South America
- 2.1. Brazil
- 2.2. Argentina
- 2.3. Rest of South America
-
3. Europe
- 3.1. United Kingdom
- 3.2. Germany
- 3.3. France
- 3.4. Italy
- 3.5. Spain
- 3.6. Russia
- 3.7. Benelux
- 3.8. Nordics
- 3.9. Rest of Europe
-
4. Middle East & Africa
- 4.1. Turkey
- 4.2. Israel
- 4.3. GCC
- 4.4. North Africa
- 4.5. South Africa
- 4.6. Rest of Middle East & Africa
-
5. Asia Pacific
- 5.1. China
- 5.2. India
- 5.3. Japan
- 5.4. South Korea
- 5.5. ASEAN
- 5.6. Oceania
- 5.7. Rest of Asia Pacific
Military Rugged Tablet REPORT HIGHLIGHTS
| Aspects | Details |
|---|---|
| Study Period | 2019-2033 |
| Base Year | 2024 |
| Estimated Year | 2025 |
| Forecast Period | 2025-2033 |
| Historical Period | 2019-2024 |
| Growth Rate | CAGR of 4.2% from 2019-2033 |
| Segmentation |
|
Table of Contents
- 1. Introduction
- 1.1. Research Scope
- 1.2. Market Segmentation
- 1.3. Research Methodology
- 1.4. Definitions and Assumptions
- 2. Executive Summary
- 2.1. Introduction
- 3. Market Dynamics
- 3.1. Introduction
- 3.2. Market Drivers
- 3.3. Market Restrains
- 3.4. Market Trends
- 4. Market Factor Analysis
- 4.1. Porters Five Forces
- 4.2. Supply/Value Chain
- 4.3. PESTEL analysis
- 4.4. Market Entropy
- 4.5. Patent/Trademark Analysis
- 5. Global Military Rugged Tablet Analysis, Insights and Forecast, 2019-2031
- 5.1. Market Analysis, Insights and Forecast - by Application
- 5.1.1. Air Force
- 5.1.2. Army
- 5.1.3. Navy
- 5.2. Market Analysis, Insights and Forecast - by Types
- 5.2.1. Windows System
- 5.2.2. Android System
- 5.3. Market Analysis, Insights and Forecast - by Region
- 5.3.1. North America
- 5.3.2. South America
- 5.3.3. Europe
- 5.3.4. Middle East & Africa
- 5.3.5. Asia Pacific
- 5.1. Market Analysis, Insights and Forecast - by Application
- 6. North America Military Rugged Tablet Analysis, Insights and Forecast, 2019-2031
- 6.1. Market Analysis, Insights and Forecast - by Application
- 6.1.1. Air Force
- 6.1.2. Army
- 6.1.3. Navy
- 6.2. Market Analysis, Insights and Forecast - by Types
- 6.2.1. Windows System
- 6.2.2. Android System
- 6.1. Market Analysis, Insights and Forecast - by Application
- 7. South America Military Rugged Tablet Analysis, Insights and Forecast, 2019-2031
- 7.1. Market Analysis, Insights and Forecast - by Application
- 7.1.1. Air Force
- 7.1.2. Army
- 7.1.3. Navy
- 7.2. Market Analysis, Insights and Forecast - by Types
- 7.2.1. Windows System
- 7.2.2. Android System
- 7.1. Market Analysis, Insights and Forecast - by Application
- 8. Europe Military Rugged Tablet Analysis, Insights and Forecast, 2019-2031
- 8.1. Market Analysis, Insights and Forecast - by Application
- 8.1.1. Air Force
- 8.1.2. Army
- 8.1.3. Navy
- 8.2. Market Analysis, Insights and Forecast - by Types
- 8.2.1. Windows System
- 8.2.2. Android System
- 8.1. Market Analysis, Insights and Forecast - by Application
- 9. Middle East & Africa Military Rugged Tablet Analysis, Insights and Forecast, 2019-2031
- 9.1. Market Analysis, Insights and Forecast - by Application
- 9.1.1. Air Force
- 9.1.2. Army
- 9.1.3. Navy
- 9.2. Market Analysis, Insights and Forecast - by Types
- 9.2.1. Windows System
- 9.2.2. Android System
- 9.1. Market Analysis, Insights and Forecast - by Application
- 10. Asia Pacific Military Rugged Tablet Analysis, Insights and Forecast, 2019-2031
- 10.1. Market Analysis, Insights and Forecast - by Application
- 10.1.1. Air Force
- 10.1.2. Army
- 10.1.3. Navy
- 10.2. Market Analysis, Insights and Forecast - by Types
- 10.2.1. Windows System
- 10.2.2. Android System
- 10.1. Market Analysis, Insights and Forecast - by Application
- 11. Competitive Analysis
- 11.1. Global Market Share Analysis 2024
- 11.2. Company Profiles
- 11.2.1 Panasonic
- 11.2.1.1. Overview
- 11.2.1.2. Products
- 11.2.1.3. SWOT Analysis
- 11.2.1.4. Recent Developments
- 11.2.1.5. Financials (Based on Availability)
- 11.2.2 Zebra(Xplore)
- 11.2.2.1. Overview
- 11.2.2.2. Products
- 11.2.2.3. SWOT Analysis
- 11.2.2.4. Recent Developments
- 11.2.2.5. Financials (Based on Availability)
- 11.2.3 Leonardo DRS
- 11.2.3.1. Overview
- 11.2.3.2. Products
- 11.2.3.3. SWOT Analysis
- 11.2.3.4. Recent Developments
- 11.2.3.5. Financials (Based on Availability)
- 11.2.4 Getac
- 11.2.4.1. Overview
- 11.2.4.2. Products
- 11.2.4.3. SWOT Analysis
- 11.2.4.4. Recent Developments
- 11.2.4.5. Financials (Based on Availability)
- 11.2.5 DT Research
- 11.2.5.1. Overview
- 11.2.5.2. Products
- 11.2.5.3. SWOT Analysis
- 11.2.5.4. Recent Developments
- 11.2.5.5. Financials (Based on Availability)
- 11.2.6 Dell
- 11.2.6.1. Overview
- 11.2.6.2. Products
- 11.2.6.3. SWOT Analysis
- 11.2.6.4. Recent Developments
- 11.2.6.5. Financials (Based on Availability)
- 11.2.7 MobileDemand
- 11.2.7.1. Overview
- 11.2.7.2. Products
- 11.2.7.3. SWOT Analysis
- 11.2.7.4. Recent Developments
- 11.2.7.5. Financials (Based on Availability)
- 11.2.8 AAEON
- 11.2.8.1. Overview
- 11.2.8.2. Products
- 11.2.8.3. SWOT Analysis
- 11.2.8.4. Recent Developments
- 11.2.8.5. Financials (Based on Availability)
- 11.2.9 NEXCOM
- 11.2.9.1. Overview
- 11.2.9.2. Products
- 11.2.9.3. SWOT Analysis
- 11.2.9.4. Recent Developments
- 11.2.9.5. Financials (Based on Availability)
- 11.2.10 HP
- 11.2.10.1. Overview
- 11.2.10.2. Products
- 11.2.10.3. SWOT Analysis
- 11.2.10.4. Recent Developments
- 11.2.10.5. Financials (Based on Availability)
- 11.2.11 MilDef
- 11.2.11.1. Overview
- 11.2.11.2. Products
- 11.2.11.3. SWOT Analysis
- 11.2.11.4. Recent Developments
- 11.2.11.5. Financials (Based on Availability)
- 11.2.12 Trimble
- 11.2.12.1. Overview
- 11.2.12.2. Products
- 11.2.12.3. SWOT Analysis
- 11.2.12.4. Recent Developments
- 11.2.12.5. Financials (Based on Availability)
- 11.2.13 Kontron
- 11.2.13.1. Overview
- 11.2.13.2. Products
- 11.2.13.3. SWOT Analysis
- 11.2.13.4. Recent Developments
- 11.2.13.5. Financials (Based on Availability)
- 11.2.14 Samsung
- 11.2.14.1. Overview
- 11.2.14.2. Products
- 11.2.14.3. SWOT Analysis
- 11.2.14.4. Recent Developments
- 11.2.14.5. Financials (Based on Availability)
- 11.2.15 Winmate
- 11.2.15.1. Overview
- 11.2.15.2. Products
- 11.2.15.3. SWOT Analysis
- 11.2.15.4. Recent Developments
- 11.2.15.5. Financials (Based on Availability)
- 11.2.16 Xenarc Technologies
- 11.2.16.1. Overview
- 11.2.16.2. Products
- 11.2.16.3. SWOT Analysis
- 11.2.16.4. Recent Developments
- 11.2.16.5. Financials (Based on Availability)
- 11.2.17 JLT Mobile Computers
- 11.2.17.1. Overview
- 11.2.17.2. Products
- 11.2.17.3. SWOT Analysis
- 11.2.17.4. Recent Developments
- 11.2.17.5. Financials (Based on Availability)
- 11.2.18 Estone Technology
- 11.2.18.1. Overview
- 11.2.18.2. Products
- 11.2.18.3. SWOT Analysis
- 11.2.18.4. Recent Developments
- 11.2.18.5. Financials (Based on Availability)
- 11.2.19 RuggON
- 11.2.19.1. Overview
- 11.2.19.2. Products
- 11.2.19.3. SWOT Analysis
- 11.2.19.4. Recent Developments
- 11.2.19.5. Financials (Based on Availability)
- 11.2.20 Rugged Sumo
- 11.2.20.1. Overview
- 11.2.20.2. Products
- 11.2.20.3. SWOT Analysis
- 11.2.20.4. Recent Developments
- 11.2.20.5. Financials (Based on Availability)
- 11.2.21 Logic Instrument (ARCHOS)
- 11.2.21.1. Overview
- 11.2.21.2. Products
- 11.2.21.3. SWOT Analysis
- 11.2.21.4. Recent Developments
- 11.2.21.5. Financials (Based on Availability)
- 11.2.22 Bright Alliance Technology
- 11.2.22.1. Overview
- 11.2.22.2. Products
- 11.2.22.3. SWOT Analysis
- 11.2.22.4. Recent Developments
- 11.2.22.5. Financials (Based on Availability)
- 11.2.23 Conker
- 11.2.23.1. Overview
- 11.2.23.2. Products
- 11.2.23.3. SWOT Analysis
- 11.2.23.4. Recent Developments
- 11.2.23.5. Financials (Based on Availability)
- 11.2.1 Panasonic
List of Figures
- Figure 1: Global Military Rugged Tablet Revenue Breakdown (million, %) by Region 2024 & 2032
- Figure 2: Global Military Rugged Tablet Volume Breakdown (K, %) by Region 2024 & 2032
- Figure 3: North America Military Rugged Tablet Revenue (million), by Application 2024 & 2032
- Figure 4: North America Military Rugged Tablet Volume (K), by Application 2024 & 2032
- Figure 5: North America Military Rugged Tablet Revenue Share (%), by Application 2024 & 2032
- Figure 6: North America Military Rugged Tablet Volume Share (%), by Application 2024 & 2032
- Figure 7: North America Military Rugged Tablet Revenue (million), by Types 2024 & 2032
- Figure 8: North America Military Rugged Tablet Volume (K), by Types 2024 & 2032
- Figure 9: North America Military Rugged Tablet Revenue Share (%), by Types 2024 & 2032
- Figure 10: North America Military Rugged Tablet Volume Share (%), by Types 2024 & 2032
- Figure 11: North America Military Rugged Tablet Revenue (million), by Country 2024 & 2032
- Figure 12: North America Military Rugged Tablet Volume (K), by Country 2024 & 2032
- Figure 13: North America Military Rugged Tablet Revenue Share (%), by Country 2024 & 2032
- Figure 14: North America Military Rugged Tablet Volume Share (%), by Country 2024 & 2032
- Figure 15: South America Military Rugged Tablet Revenue (million), by Application 2024 & 2032
- Figure 16: South America Military Rugged Tablet Volume (K), by Application 2024 & 2032
- Figure 17: South America Military Rugged Tablet Revenue Share (%), by Application 2024 & 2032
- Figure 18: South America Military Rugged Tablet Volume Share (%), by Application 2024 & 2032
- Figure 19: South America Military Rugged Tablet Revenue (million), by Types 2024 & 2032
- Figure 20: South America Military Rugged Tablet Volume (K), by Types 2024 & 2032
- Figure 21: South America Military Rugged Tablet Revenue Share (%), by Types 2024 & 2032
- Figure 22: South America Military Rugged Tablet Volume Share (%), by Types 2024 & 2032
- Figure 23: South America Military Rugged Tablet Revenue (million), by Country 2024 & 2032
- Figure 24: South America Military Rugged Tablet Volume (K), by Country 2024 & 2032
- Figure 25: South America Military Rugged Tablet Revenue Share (%), by Country 2024 & 2032
- Figure 26: South America Military Rugged Tablet Volume Share (%), by Country 2024 & 2032
- Figure 27: Europe Military Rugged Tablet Revenue (million), by Application 2024 & 2032
- Figure 28: Europe Military Rugged Tablet Volume (K), by Application 2024 & 2032
- Figure 29: Europe Military Rugged Tablet Revenue Share (%), by Application 2024 & 2032
- Figure 30: Europe Military Rugged Tablet Volume Share (%), by Application 2024 & 2032
- Figure 31: Europe Military Rugged Tablet Revenue (million), by Types 2024 & 2032
- Figure 32: Europe Military Rugged Tablet Volume (K), by Types 2024 & 2032
- Figure 33: Europe Military Rugged Tablet Revenue Share (%), by Types 2024 & 2032
- Figure 34: Europe Military Rugged Tablet Volume Share (%), by Types 2024 & 2032
- Figure 35: Europe Military Rugged Tablet Revenue (million), by Country 2024 & 2032
- Figure 36: Europe Military Rugged Tablet Volume (K), by Country 2024 & 2032
- Figure 37: Europe Military Rugged Tablet Revenue Share (%), by Country 2024 & 2032
- Figure 38: Europe Military Rugged Tablet Volume Share (%), by Country 2024 & 2032
- Figure 39: Middle East & Africa Military Rugged Tablet Revenue (million), by Application 2024 & 2032
- Figure 40: Middle East & Africa Military Rugged Tablet Volume (K), by Application 2024 & 2032
- Figure 41: Middle East & Africa Military Rugged Tablet Revenue Share (%), by Application 2024 & 2032
- Figure 42: Middle East & Africa Military Rugged Tablet Volume Share (%), by Application 2024 & 2032
- Figure 43: Middle East & Africa Military Rugged Tablet Revenue (million), by Types 2024 & 2032
- Figure 44: Middle East & Africa Military Rugged Tablet Volume (K), by Types 2024 & 2032
- Figure 45: Middle East & Africa Military Rugged Tablet Revenue Share (%), by Types 2024 & 2032
- Figure 46: Middle East & Africa Military Rugged Tablet Volume Share (%), by Types 2024 & 2032
- Figure 47: Middle East & Africa Military Rugged Tablet Revenue (million), by Country 2024 & 2032
- Figure 48: Middle East & Africa Military Rugged Tablet Volume (K), by Country 2024 & 2032
- Figure 49: Middle East & Africa Military Rugged Tablet Revenue Share (%), by Country 2024 & 2032
- Figure 50: Middle East & Africa Military Rugged Tablet Volume Share (%), by Country 2024 & 2032
- Figure 51: Asia Pacific Military Rugged Tablet Revenue (million), by Application 2024 & 2032
- Figure 52: Asia Pacific Military Rugged Tablet Volume (K), by Application 2024 & 2032
- Figure 53: Asia Pacific Military Rugged Tablet Revenue Share (%), by Application 2024 & 2032
- Figure 54: Asia Pacific Military Rugged Tablet Volume Share (%), by Application 2024 & 2032
- Figure 55: Asia Pacific Military Rugged Tablet Revenue (million), by Types 2024 & 2032
- Figure 56: Asia Pacific Military Rugged Tablet Volume (K), by Types 2024 & 2032
- Figure 57: Asia Pacific Military Rugged Tablet Revenue Share (%), by Types 2024 & 2032
- Figure 58: Asia Pacific Military Rugged Tablet Volume Share (%), by Types 2024 & 2032
- Figure 59: Asia Pacific Military Rugged Tablet Revenue (million), by Country 2024 & 2032
- Figure 60: Asia Pacific Military Rugged Tablet Volume (K), by Country 2024 & 2032
- Figure 61: Asia Pacific Military Rugged Tablet Revenue Share (%), by Country 2024 & 2032
- Figure 62: Asia Pacific Military Rugged Tablet Volume Share (%), by Country 2024 & 2032
List of Tables
- Table 1: Global Military Rugged Tablet Revenue million Forecast, by Region 2019 & 2032
- Table 2: Global Military Rugged Tablet Volume K Forecast, by Region 2019 & 2032
- Table 3: Global Military Rugged Tablet Revenue million Forecast, by Application 2019 & 2032
- Table 4: Global Military Rugged Tablet Volume K Forecast, by Application 2019 & 2032
- Table 5: Global Military Rugged Tablet Revenue million Forecast, by Types 2019 & 2032
- Table 6: Global Military Rugged Tablet Volume K Forecast, by Types 2019 & 2032
- Table 7: Global Military Rugged Tablet Revenue million Forecast, by Region 2019 & 2032
- Table 8: Global Military Rugged Tablet Volume K Forecast, by Region 2019 & 2032
- Table 9: Global Military Rugged Tablet Revenue million Forecast, by Application 2019 & 2032
- Table 10: Global Military Rugged Tablet Volume K Forecast, by Application 2019 & 2032
- Table 11: Global Military Rugged Tablet Revenue million Forecast, by Types 2019 & 2032
- Table 12: Global Military Rugged Tablet Volume K Forecast, by Types 2019 & 2032
- Table 13: Global Military Rugged Tablet Revenue million Forecast, by Country 2019 & 2032
- Table 14: Global Military Rugged Tablet Volume K Forecast, by Country 2019 & 2032
- Table 15: United States Military Rugged Tablet Revenue (million) Forecast, by Application 2019 & 2032
- Table 16: United States Military Rugged Tablet Volume (K) Forecast, by Application 2019 & 2032
- Table 17: Canada Military Rugged Tablet Revenue (million) Forecast, by Application 2019 & 2032
- Table 18: Canada Military Rugged Tablet Volume (K) Forecast, by Application 2019 & 2032
- Table 19: Mexico Military Rugged Tablet Revenue (million) Forecast, by Application 2019 & 2032
- Table 20: Mexico Military Rugged Tablet Volume (K) Forecast, by Application 2019 & 2032
- Table 21: Global Military Rugged Tablet Revenue million Forecast, by Application 2019 & 2032
- Table 22: Global Military Rugged Tablet Volume K Forecast, by Application 2019 & 2032
- Table 23: Global Military Rugged Tablet Revenue million Forecast, by Types 2019 & 2032
- Table 24: Global Military Rugged Tablet Volume K Forecast, by Types 2019 & 2032
- Table 25: Global Military Rugged Tablet Revenue million Forecast, by Country 2019 & 2032
- Table 26: Global Military Rugged Tablet Volume K Forecast, by Country 2019 & 2032
- Table 27: Brazil Military Rugged Tablet Revenue (million) Forecast, by Application 2019 & 2032
- Table 28: Brazil Military Rugged Tablet Volume (K) Forecast, by Application 2019 & 2032
- Table 29: Argentina Military Rugged Tablet Revenue (million) Forecast, by Application 2019 & 2032
- Table 30: Argentina Military Rugged Tablet Volume (K) Forecast, by Application 2019 & 2032
- Table 31: Rest of South America Military Rugged Tablet Revenue (million) Forecast, by Application 2019 & 2032
- Table 32: Rest of South America Military Rugged Tablet Volume (K) Forecast, by Application 2019 & 2032
- Table 33: Global Military Rugged Tablet Revenue million Forecast, by Application 2019 & 2032
- Table 34: Global Military Rugged Tablet Volume K Forecast, by Application 2019 & 2032
- Table 35: Global Military Rugged Tablet Revenue million Forecast, by Types 2019 & 2032
- Table 36: Global Military Rugged Tablet Volume K Forecast, by Types 2019 & 2032
- Table 37: Global Military Rugged Tablet Revenue million Forecast, by Country 2019 & 2032
- Table 38: Global Military Rugged Tablet Volume K Forecast, by Country 2019 & 2032
- Table 39: United Kingdom Military Rugged Tablet Revenue (million) Forecast, by Application 2019 & 2032
- Table 40: United Kingdom Military Rugged Tablet Volume (K) Forecast, by Application 2019 & 2032
- Table 41: Germany Military Rugged Tablet Revenue (million) Forecast, by Application 2019 & 2032
- Table 42: Germany Military Rugged Tablet Volume (K) Forecast, by Application 2019 & 2032
- Table 43: France Military Rugged Tablet Revenue (million) Forecast, by Application 2019 & 2032
- Table 44: France Military Rugged Tablet Volume (K) Forecast, by Application 2019 & 2032
- Table 45: Italy Military Rugged Tablet Revenue (million) Forecast, by Application 2019 & 2032
- Table 46: Italy Military Rugged Tablet Volume (K) Forecast, by Application 2019 & 2032
- Table 47: Spain Military Rugged Tablet Revenue (million) Forecast, by Application 2019 & 2032
- Table 48: Spain Military Rugged Tablet Volume (K) Forecast, by Application 2019 & 2032
- Table 49: Russia Military Rugged Tablet Revenue (million) Forecast, by Application 2019 & 2032
- Table 50: Russia Military Rugged Tablet Volume (K) Forecast, by Application 2019 & 2032
- Table 51: Benelux Military Rugged Tablet Revenue (million) Forecast, by Application 2019 & 2032
- Table 52: Benelux Military Rugged Tablet Volume (K) Forecast, by Application 2019 & 2032
- Table 53: Nordics Military Rugged Tablet Revenue (million) Forecast, by Application 2019 & 2032
- Table 54: Nordics Military Rugged Tablet Volume (K) Forecast, by Application 2019 & 2032
- Table 55: Rest of Europe Military Rugged Tablet Revenue (million) Forecast, by Application 2019 & 2032
- Table 56: Rest of Europe Military Rugged Tablet Volume (K) Forecast, by Application 2019 & 2032
- Table 57: Global Military Rugged Tablet Revenue million Forecast, by Application 2019 & 2032
- Table 58: Global Military Rugged Tablet Volume K Forecast, by Application 2019 & 2032
- Table 59: Global Military Rugged Tablet Revenue million Forecast, by Types 2019 & 2032
- Table 60: Global Military Rugged Tablet Volume K Forecast, by Types 2019 & 2032
- Table 61: Global Military Rugged Tablet Revenue million Forecast, by Country 2019 & 2032
- Table 62: Global Military Rugged Tablet Volume K Forecast, by Country 2019 & 2032
- Table 63: Turkey Military Rugged Tablet Revenue (million) Forecast, by Application 2019 & 2032
- Table 64: Turkey Military Rugged Tablet Volume (K) Forecast, by Application 2019 & 2032
- Table 65: Israel Military Rugged Tablet Revenue (million) Forecast, by Application 2019 & 2032
- Table 66: Israel Military Rugged Tablet Volume (K) Forecast, by Application 2019 & 2032
- Table 67: GCC Military Rugged Tablet Revenue (million) Forecast, by Application 2019 & 2032
- Table 68: GCC Military Rugged Tablet Volume (K) Forecast, by Application 2019 & 2032
- Table 69: North Africa Military Rugged Tablet Revenue (million) Forecast, by Application 2019 & 2032
- Table 70: North Africa Military Rugged Tablet Volume (K) Forecast, by Application 2019 & 2032
- Table 71: South Africa Military Rugged Tablet Revenue (million) Forecast, by Application 2019 & 2032
- Table 72: South Africa Military Rugged Tablet Volume (K) Forecast, by Application 2019 & 2032
- Table 73: Rest of Middle East & Africa Military Rugged Tablet Revenue (million) Forecast, by Application 2019 & 2032
- Table 74: Rest of Middle East & Africa Military Rugged Tablet Volume (K) Forecast, by Application 2019 & 2032
- Table 75: Global Military Rugged Tablet Revenue million Forecast, by Application 2019 & 2032
- Table 76: Global Military Rugged Tablet Volume K Forecast, by Application 2019 & 2032
- Table 77: Global Military Rugged Tablet Revenue million Forecast, by Types 2019 & 2032
- Table 78: Global Military Rugged Tablet Volume K Forecast, by Types 2019 & 2032
- Table 79: Global Military Rugged Tablet Revenue million Forecast, by Country 2019 & 2032
- Table 80: Global Military Rugged Tablet Volume K Forecast, by Country 2019 & 2032
- Table 81: China Military Rugged Tablet Revenue (million) Forecast, by Application 2019 & 2032
- Table 82: China Military Rugged Tablet Volume (K) Forecast, by Application 2019 & 2032
- Table 83: India Military Rugged Tablet Revenue (million) Forecast, by Application 2019 & 2032
- Table 84: India Military Rugged Tablet Volume (K) Forecast, by Application 2019 & 2032
- Table 85: Japan Military Rugged Tablet Revenue (million) Forecast, by Application 2019 & 2032
- Table 86: Japan Military Rugged Tablet Volume (K) Forecast, by Application 2019 & 2032
- Table 87: South Korea Military Rugged Tablet Revenue (million) Forecast, by Application 2019 & 2032
- Table 88: South Korea Military Rugged Tablet Volume (K) Forecast, by Application 2019 & 2032
- Table 89: ASEAN Military Rugged Tablet Revenue (million) Forecast, by Application 2019 & 2032
- Table 90: ASEAN Military Rugged Tablet Volume (K) Forecast, by Application 2019 & 2032
- Table 91: Oceania Military Rugged Tablet Revenue (million) Forecast, by Application 2019 & 2032
- Table 92: Oceania Military Rugged Tablet Volume (K) Forecast, by Application 2019 & 2032
- Table 93: Rest of Asia Pacific Military Rugged Tablet Revenue (million) Forecast, by Application 2019 & 2032
- Table 94: Rest of Asia Pacific Military Rugged Tablet Volume (K) Forecast, by Application 2019 & 2032
Frequently Asked Questions
1. What is the projected Compound Annual Growth Rate (CAGR) of the Military Rugged Tablet?
The projected CAGR is approximately 4.2%.
2. Which companies are prominent players in the Military Rugged Tablet?
Key companies in the market include Panasonic, Zebra(Xplore), Leonardo DRS, Getac, DT Research, Dell, MobileDemand, AAEON, NEXCOM, HP, MilDef, Trimble, Kontron, Samsung, Winmate, Xenarc Technologies, JLT Mobile Computers, Estone Technology, RuggON, Rugged Sumo, Logic Instrument (ARCHOS), Bright Alliance Technology, Conker.
3. What are the main segments of the Military Rugged Tablet?
The market segments include Application, Types.
4. Can you provide details about the market size?
The market size is estimated to be USD 113.6 million as of 2022.
5. What are some drivers contributing to market growth?
N/A
6. What are the notable trends driving market growth?
N/A
7. Are there any restraints impacting market growth?
N/A
8. Can you provide examples of recent developments in the market?
N/A
9. What pricing options are available for accessing the report?
Pricing options include single-user, multi-user, and enterprise licenses priced at USD 3350.00, USD 5025.00, and USD 6700.00 respectively.
10. Is the market size provided in terms of value or volume?
The market size is provided in terms of value, measured in million and volume, measured in K.
11. Are there any specific market keywords associated with the report?
Yes, the market keyword associated with the report is "Military Rugged Tablet," which aids in identifying and referencing the specific market segment covered.
12. How do I determine which pricing option suits my needs best?
The pricing options vary based on user requirements and access needs. Individual users may opt for single-user licenses, while businesses requiring broader access may choose multi-user or enterprise licenses for cost-effective access to the report.
13. Are there any additional resources or data provided in the Military Rugged Tablet report?
While the report offers comprehensive insights, it's advisable to review the specific contents or supplementary materials provided to ascertain if additional resources or data are available.
14. How can I stay updated on further developments or reports in the Military Rugged Tablet?
To stay informed about further developments, trends, and reports in the Military Rugged Tablet, consider subscribing to industry newsletters, following relevant companies and organizations, or regularly checking reputable industry news sources and publications.
Methodology
Step 1 - Identification of Relevant Samples Size from Population Database


Step 2 - Approaches for Defining Global Market Size (Value, Volume* & Price*)

Note*: In applicable scenarios
Step 3 - Data Sources
Primary Research
- Web Analytics
- Survey Reports
- Research Institute
- Latest Research Reports
- Opinion Leaders
Secondary Research
- Annual Reports
- White Paper
- Latest Press Release
- Industry Association
- Paid Database
- Investor Presentations

Step 4 - Data Triangulation
Involves using different sources of information in order to increase the validity of a study
These sources are likely to be stakeholders in a program - participants, other researchers, program staff, other community members, and so on.
Then we put all data in single framework & apply various statistical tools to find out the dynamic on the market.
During the analysis stage, feedback from the stakeholder groups would be compared to determine areas of agreement as well as areas of divergence
