

Key Insights
The mobile medical imaging services market is experiencing robust growth, driven by several key factors. The increasing prevalence of chronic diseases necessitating frequent monitoring, coupled with a rising geriatric population demanding convenient healthcare solutions, fuels demand for portable and readily accessible imaging technologies. Technological advancements, such as the development of smaller, more efficient, and higher-resolution imaging systems, further enhance the market's appeal. Improved image quality and faster diagnostic turnaround times are significantly impacting patient care and streamlining healthcare workflows. The integration of telehealth platforms with mobile imaging units is also contributing to market expansion, enabling remote consultations and improved access to specialized care, especially in underserved areas. This trend is further amplified by the increasing adoption of mobile health (mHealth) solutions and the rising focus on preventative care. Competition among established players and new entrants is fostering innovation, and leading to a wider range of services, including ultrasound, X-ray, and potentially even MRI capabilities delivered through mobile units.
Despite the significant growth potential, the market faces certain challenges. High initial investment costs associated with purchasing and maintaining mobile imaging equipment can act as a restraint, particularly for smaller healthcare providers. Regulatory hurdles and varying reimbursement policies across different regions may also affect market penetration. Ensuring data security and patient privacy in a mobile environment remains a critical concern. However, the overarching trend is positive, with continuous technological advancements and increasing healthcare expenditure expected to drive market expansion throughout the forecast period. We project continued growth, with a positive impact on patient outcomes and healthcare efficiency. The focus on streamlined workflows, improved patient experience, and better access to care positions the mobile medical imaging services market for sustained expansion.
Mobile Medical Imaging Services Market Report: 2019-2033
This comprehensive report provides a detailed analysis of the mobile medical imaging services market, offering invaluable insights for industry professionals, investors, and strategists. Covering the period 2019-2033, with a focus on 2025, this report leverages extensive data and expert analysis to illuminate growth trends, competitive dynamics, and future opportunities within this rapidly evolving sector. The parent market is the broader medical imaging market, while the child market focuses specifically on mobile diagnostic imaging solutions. The global market size in 2025 is estimated at $XX billion.
Mobile Medical Imaging Services Market Dynamics & Structure
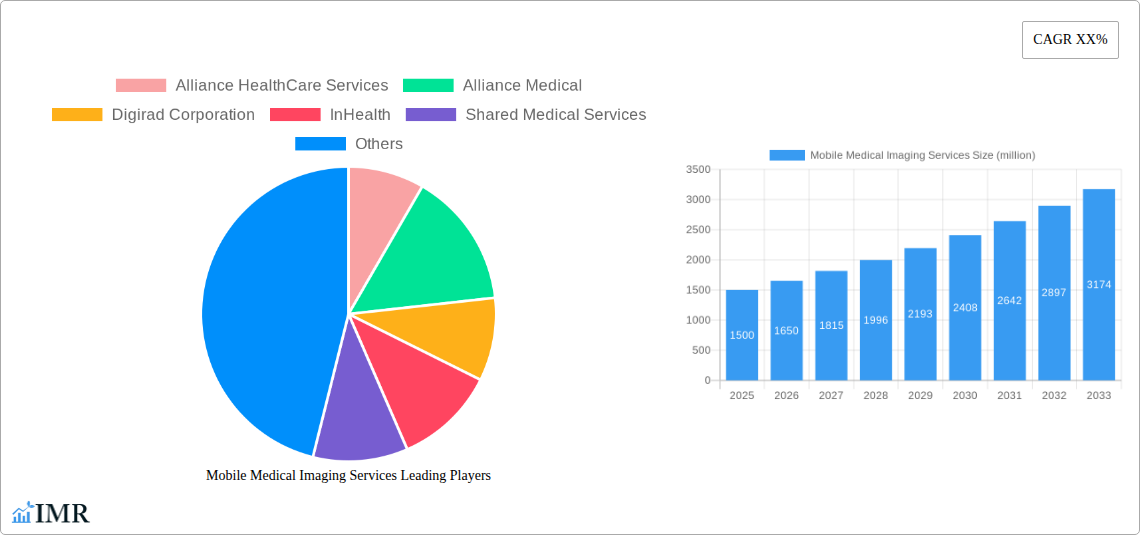
The mobile medical imaging services market is characterized by moderate concentration, with a few key players holding significant market share. However, the market is dynamic, experiencing continuous technological innovation and strategic mergers and acquisitions (M&A). Regulatory frameworks vary across geographies, influencing market access and adoption rates. Competitive pressures arise from both established players and emerging companies offering innovative solutions. The end-user demographics are diverse, encompassing hospitals, clinics, mobile healthcare providers, and diagnostic centers.
- Market Concentration: The top 5 players hold an estimated 35% market share in 2025.
- Technological Innovation: Advancements in portable X-ray systems, ultrasound technology, and digital image processing are driving market growth.
- Regulatory Landscape: Stringent regulatory approvals and safety standards influence market entry and product development.
- Competitive Substitutes: Traditional stationary imaging systems pose competition, but mobile solutions offer unique advantages in accessibility and convenience.
- M&A Activity: An estimated XX M&A deals occurred between 2019 and 2024 in the mobile medical imaging sector.
- End-User Demographics: Hospitals and clinics represent the largest segment, accounting for approximately 60% of market demand in 2025.
Mobile Medical Imaging Services Growth Trends & Insights
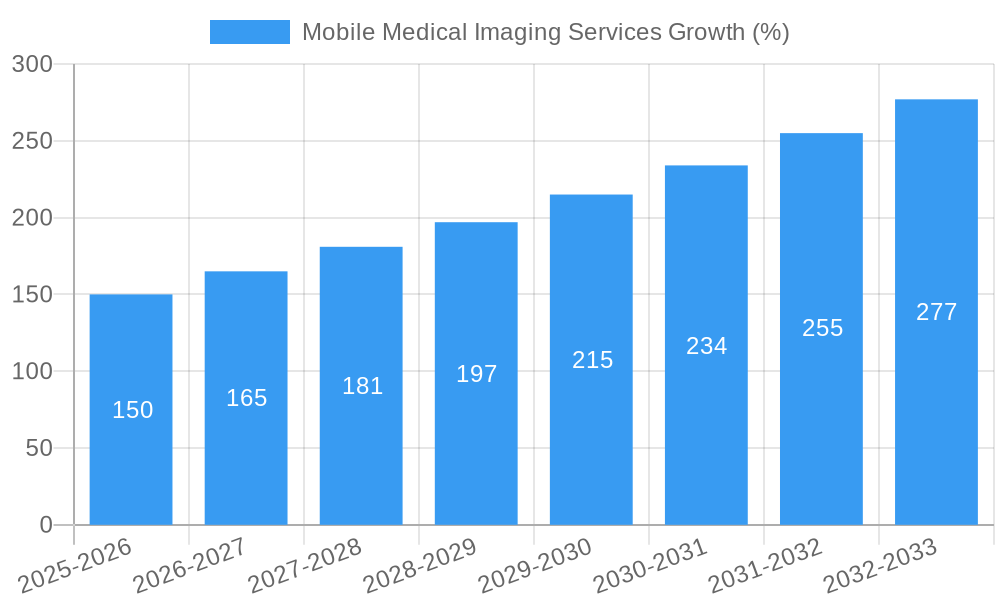
The mobile medical imaging services market is experiencing robust growth, driven by increasing demand for point-of-care diagnostics, rising healthcare expenditure, and technological advancements. The market exhibited a CAGR of XX% during the historical period (2019-2024) and is projected to maintain a CAGR of XX% during the forecast period (2025-2033). Market penetration is increasing across various healthcare settings, particularly in underserved areas. The adoption of telehealth and remote patient monitoring is further fueling market expansion. Technological disruptions, such as AI-powered image analysis and improved connectivity, are revolutionizing the industry, enhancing diagnostic accuracy and efficiency. Consumer behavior shifts towards convenience and accessibility are also playing a significant role in driving demand.
Dominant Regions, Countries, or Segments in Mobile Medical Imaging Services
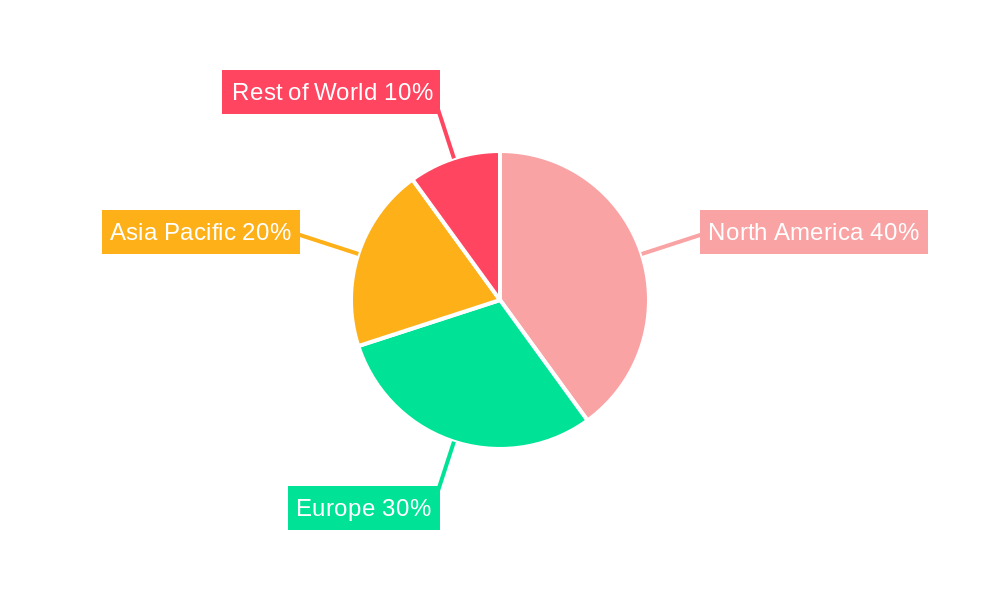
North America currently dominates the mobile medical imaging services market, driven by robust healthcare infrastructure, high adoption rates of advanced technologies, and favorable regulatory environments. However, Asia-Pacific is projected to witness the fastest growth during the forecast period due to increasing healthcare investments, rising prevalence of chronic diseases, and growing awareness of the benefits of mobile diagnostic services. The mobile X-ray segment holds the largest market share, followed by mobile ultrasound.
- North America: High healthcare expenditure and technological advancements drive market leadership.
- Asia-Pacific: Rapid economic growth and increasing healthcare investment fuel substantial growth potential.
- Europe: Stringent regulatory frameworks and a mature healthcare infrastructure influence moderate growth.
- Mobile X-ray: Largest market segment due to widespread applicability and relatively lower cost.
- Mobile Ultrasound: Growing adoption for point-of-care applications, particularly in emergency care.
Mobile Medical Imaging Services Product Landscape
The mobile medical imaging services market features a diverse range of products, including portable X-ray machines, ultrasound systems, and mobile CT scanners. Continuous product innovation focuses on enhanced image quality, portability, and ease of use. These advancements are improving diagnostic accuracy and efficiency while reducing the overall cost of healthcare delivery. Unique selling propositions include features such as wireless connectivity, cloud-based image management, and AI-powered image analysis. Key technological advancements include miniaturization of components, improved battery life, and advanced image processing algorithms.
Key Drivers, Barriers & Challenges in Mobile Medical Imaging Services
Key Drivers:
- Increasing demand for point-of-care diagnostics.
- Rising healthcare expenditure and investments in medical infrastructure.
- Technological advancements in mobile imaging technology.
- Growing adoption of telehealth and remote patient monitoring.
Key Barriers and Challenges:
- High initial investment costs for mobile imaging systems.
- Stringent regulatory approvals and safety standards.
- Concerns regarding image quality and diagnostic accuracy compared to stationary systems.
- Ensuring reliable connectivity and data security in remote areas. This leads to an estimated xx million dollar loss annually.
Emerging Opportunities in Mobile Medical Imaging Services
Untapped markets in developing countries present significant growth opportunities. Innovative applications, such as integration with telemedicine platforms and the development of AI-powered diagnostic tools, are transforming the industry. Evolving consumer preferences towards convenient and accessible healthcare are creating new demand drivers. The expansion into specialized areas, such as veterinary medicine and pre-hospital care, also offers promising avenues for growth.
Growth Accelerators in the Mobile Medical Imaging Services Industry
Technological breakthroughs in areas such as AI-powered image analysis, improved connectivity, and miniaturization are accelerating market growth. Strategic partnerships between technology companies and healthcare providers are fostering innovation and market penetration. Expansion strategies targeting underserved markets and specialized healthcare settings are unlocking new growth potential. Government initiatives promoting telehealth and remote diagnostics further enhance market momentum.
Key Players Shaping the Mobile Medical Imaging Services Market
- Alliance HealthCare Services
- Alliance Medical
- Digirad Corporation
- InHealth
- Shared Medical Services
- Accurate Imaging
- Aged Care Imaging
- Center for Diagnostic Imaging
- Oxford Instruments
- TridentUSA Health Services
Notable Milestones in Mobile Medical Imaging Services Sector
- 2020: FDA approval of a new portable X-ray system with enhanced image quality.
- 2021: Launch of a cloud-based image management platform for mobile imaging data.
- 2022: Merger between two key players resulting in increased market share.
- 2023: Introduction of AI-powered image analysis software improving diagnostic accuracy.
- 2024: Successful pilot program demonstrating the effectiveness of mobile imaging in remote healthcare settings.
In-Depth Mobile Medical Imaging Services Market Outlook
The mobile medical imaging services market is poised for continued growth, driven by persistent technological advancements, expanding healthcare infrastructure, and increasing demand for convenient and accessible healthcare solutions. Strategic opportunities lie in exploring untapped markets, developing innovative applications, and forging strategic partnerships to accelerate market penetration. The focus on enhancing image quality, improving connectivity, and integrating AI-powered diagnostics will shape the future of the mobile medical imaging services landscape, promising significant growth and improved healthcare outcomes over the next decade.
Mobile Medical Imaging Services Segmentation
-
1. Application
- 1.1. Hospital
- 1.2. Clinic
- 1.3. Other
-
2. Types
- 2.1. Mobile MRI
- 2.2. Mobile CT
- 2.3. Mobile PET/CT
- 2.4. Others
Mobile Medical Imaging Services Segmentation By Geography
-
1. North America
- 1.1. United States
- 1.2. Canada
- 1.3. Mexico
-
2. South America
- 2.1. Brazil
- 2.2. Argentina
- 2.3. Rest of South America
-
3. Europe
- 3.1. United Kingdom
- 3.2. Germany
- 3.3. France
- 3.4. Italy
- 3.5. Spain
- 3.6. Russia
- 3.7. Benelux
- 3.8. Nordics
- 3.9. Rest of Europe
-
4. Middle East & Africa
- 4.1. Turkey
- 4.2. Israel
- 4.3. GCC
- 4.4. North Africa
- 4.5. South Africa
- 4.6. Rest of Middle East & Africa
-
5. Asia Pacific
- 5.1. China
- 5.2. India
- 5.3. Japan
- 5.4. South Korea
- 5.5. ASEAN
- 5.6. Oceania
- 5.7. Rest of Asia Pacific
Mobile Medical Imaging Services REPORT HIGHLIGHTS
| Aspects | Details |
|---|---|
| Study Period | 2019-2033 |
| Base Year | 2024 |
| Estimated Year | 2025 |
| Forecast Period | 2025-2033 |
| Historical Period | 2019-2024 |
| Growth Rate | CAGR of XX% from 2019-2033 |
| Segmentation |
|
Table of Contents
- 1. Introduction
- 1.1. Research Scope
- 1.2. Market Segmentation
- 1.3. Research Methodology
- 1.4. Definitions and Assumptions
- 2. Executive Summary
- 2.1. Introduction
- 3. Market Dynamics
- 3.1. Introduction
- 3.2. Market Drivers
- 3.3. Market Restrains
- 3.4. Market Trends
- 4. Market Factor Analysis
- 4.1. Porters Five Forces
- 4.2. Supply/Value Chain
- 4.3. PESTEL analysis
- 4.4. Market Entropy
- 4.5. Patent/Trademark Analysis
- 5. Global Mobile Medical Imaging Services Analysis, Insights and Forecast, 2019-2031
- 5.1. Market Analysis, Insights and Forecast - by Application
- 5.1.1. Hospital
- 5.1.2. Clinic
- 5.1.3. Other
- 5.2. Market Analysis, Insights and Forecast - by Types
- 5.2.1. Mobile MRI
- 5.2.2. Mobile CT
- 5.2.3. Mobile PET/CT
- 5.2.4. Others
- 5.3. Market Analysis, Insights and Forecast - by Region
- 5.3.1. North America
- 5.3.2. South America
- 5.3.3. Europe
- 5.3.4. Middle East & Africa
- 5.3.5. Asia Pacific
- 5.1. Market Analysis, Insights and Forecast - by Application
- 6. North America Mobile Medical Imaging Services Analysis, Insights and Forecast, 2019-2031
- 6.1. Market Analysis, Insights and Forecast - by Application
- 6.1.1. Hospital
- 6.1.2. Clinic
- 6.1.3. Other
- 6.2. Market Analysis, Insights and Forecast - by Types
- 6.2.1. Mobile MRI
- 6.2.2. Mobile CT
- 6.2.3. Mobile PET/CT
- 6.2.4. Others
- 6.1. Market Analysis, Insights and Forecast - by Application
- 7. South America Mobile Medical Imaging Services Analysis, Insights and Forecast, 2019-2031
- 7.1. Market Analysis, Insights and Forecast - by Application
- 7.1.1. Hospital
- 7.1.2. Clinic
- 7.1.3. Other
- 7.2. Market Analysis, Insights and Forecast - by Types
- 7.2.1. Mobile MRI
- 7.2.2. Mobile CT
- 7.2.3. Mobile PET/CT
- 7.2.4. Others
- 7.1. Market Analysis, Insights and Forecast - by Application
- 8. Europe Mobile Medical Imaging Services Analysis, Insights and Forecast, 2019-2031
- 8.1. Market Analysis, Insights and Forecast - by Application
- 8.1.1. Hospital
- 8.1.2. Clinic
- 8.1.3. Other
- 8.2. Market Analysis, Insights and Forecast - by Types
- 8.2.1. Mobile MRI
- 8.2.2. Mobile CT
- 8.2.3. Mobile PET/CT
- 8.2.4. Others
- 8.1. Market Analysis, Insights and Forecast - by Application
- 9. Middle East & Africa Mobile Medical Imaging Services Analysis, Insights and Forecast, 2019-2031
- 9.1. Market Analysis, Insights and Forecast - by Application
- 9.1.1. Hospital
- 9.1.2. Clinic
- 9.1.3. Other
- 9.2. Market Analysis, Insights and Forecast - by Types
- 9.2.1. Mobile MRI
- 9.2.2. Mobile CT
- 9.2.3. Mobile PET/CT
- 9.2.4. Others
- 9.1. Market Analysis, Insights and Forecast - by Application
- 10. Asia Pacific Mobile Medical Imaging Services Analysis, Insights and Forecast, 2019-2031
- 10.1. Market Analysis, Insights and Forecast - by Application
- 10.1.1. Hospital
- 10.1.2. Clinic
- 10.1.3. Other
- 10.2. Market Analysis, Insights and Forecast - by Types
- 10.2.1. Mobile MRI
- 10.2.2. Mobile CT
- 10.2.3. Mobile PET/CT
- 10.2.4. Others
- 10.1. Market Analysis, Insights and Forecast - by Application
- 11. Competitive Analysis
- 11.1. Global Market Share Analysis 2024
- 11.2. Company Profiles
- 11.2.1 Alliance HealthCare Services
- 11.2.1.1. Overview
- 11.2.1.2. Products
- 11.2.1.3. SWOT Analysis
- 11.2.1.4. Recent Developments
- 11.2.1.5. Financials (Based on Availability)
- 11.2.2 Alliance Medical
- 11.2.2.1. Overview
- 11.2.2.2. Products
- 11.2.2.3. SWOT Analysis
- 11.2.2.4. Recent Developments
- 11.2.2.5. Financials (Based on Availability)
- 11.2.3 Digirad Corporation
- 11.2.3.1. Overview
- 11.2.3.2. Products
- 11.2.3.3. SWOT Analysis
- 11.2.3.4. Recent Developments
- 11.2.3.5. Financials (Based on Availability)
- 11.2.4 InHealth
- 11.2.4.1. Overview
- 11.2.4.2. Products
- 11.2.4.3. SWOT Analysis
- 11.2.4.4. Recent Developments
- 11.2.4.5. Financials (Based on Availability)
- 11.2.5 Shared Medical Services
- 11.2.5.1. Overview
- 11.2.5.2. Products
- 11.2.5.3. SWOT Analysis
- 11.2.5.4. Recent Developments
- 11.2.5.5. Financials (Based on Availability)
- 11.2.6 Accurate Imaging
- 11.2.6.1. Overview
- 11.2.6.2. Products
- 11.2.6.3. SWOT Analysis
- 11.2.6.4. Recent Developments
- 11.2.6.5. Financials (Based on Availability)
- 11.2.7 Aged Care Imaging
- 11.2.7.1. Overview
- 11.2.7.2. Products
- 11.2.7.3. SWOT Analysis
- 11.2.7.4. Recent Developments
- 11.2.7.5. Financials (Based on Availability)
- 11.2.8 Center for Diagnostic Imaging
- 11.2.8.1. Overview
- 11.2.8.2. Products
- 11.2.8.3. SWOT Analysis
- 11.2.8.4. Recent Developments
- 11.2.8.5. Financials (Based on Availability)
- 11.2.9 Oxford Instruments
- 11.2.9.1. Overview
- 11.2.9.2. Products
- 11.2.9.3. SWOT Analysis
- 11.2.9.4. Recent Developments
- 11.2.9.5. Financials (Based on Availability)
- 11.2.10 TridentUSA Health Services
- 11.2.10.1. Overview
- 11.2.10.2. Products
- 11.2.10.3. SWOT Analysis
- 11.2.10.4. Recent Developments
- 11.2.10.5. Financials (Based on Availability)
- 11.2.1 Alliance HealthCare Services
List of Figures
- Figure 1: Global Mobile Medical Imaging Services Revenue Breakdown (million, %) by Region 2024 & 2032
- Figure 2: North America Mobile Medical Imaging Services Revenue (million), by Application 2024 & 2032
- Figure 3: North America Mobile Medical Imaging Services Revenue Share (%), by Application 2024 & 2032
- Figure 4: North America Mobile Medical Imaging Services Revenue (million), by Types 2024 & 2032
- Figure 5: North America Mobile Medical Imaging Services Revenue Share (%), by Types 2024 & 2032
- Figure 6: North America Mobile Medical Imaging Services Revenue (million), by Country 2024 & 2032
- Figure 7: North America Mobile Medical Imaging Services Revenue Share (%), by Country 2024 & 2032
- Figure 8: South America Mobile Medical Imaging Services Revenue (million), by Application 2024 & 2032
- Figure 9: South America Mobile Medical Imaging Services Revenue Share (%), by Application 2024 & 2032
- Figure 10: South America Mobile Medical Imaging Services Revenue (million), by Types 2024 & 2032
- Figure 11: South America Mobile Medical Imaging Services Revenue Share (%), by Types 2024 & 2032
- Figure 12: South America Mobile Medical Imaging Services Revenue (million), by Country 2024 & 2032
- Figure 13: South America Mobile Medical Imaging Services Revenue Share (%), by Country 2024 & 2032
- Figure 14: Europe Mobile Medical Imaging Services Revenue (million), by Application 2024 & 2032
- Figure 15: Europe Mobile Medical Imaging Services Revenue Share (%), by Application 2024 & 2032
- Figure 16: Europe Mobile Medical Imaging Services Revenue (million), by Types 2024 & 2032
- Figure 17: Europe Mobile Medical Imaging Services Revenue Share (%), by Types 2024 & 2032
- Figure 18: Europe Mobile Medical Imaging Services Revenue (million), by Country 2024 & 2032
- Figure 19: Europe Mobile Medical Imaging Services Revenue Share (%), by Country 2024 & 2032
- Figure 20: Middle East & Africa Mobile Medical Imaging Services Revenue (million), by Application 2024 & 2032
- Figure 21: Middle East & Africa Mobile Medical Imaging Services Revenue Share (%), by Application 2024 & 2032
- Figure 22: Middle East & Africa Mobile Medical Imaging Services Revenue (million), by Types 2024 & 2032
- Figure 23: Middle East & Africa Mobile Medical Imaging Services Revenue Share (%), by Types 2024 & 2032
- Figure 24: Middle East & Africa Mobile Medical Imaging Services Revenue (million), by Country 2024 & 2032
- Figure 25: Middle East & Africa Mobile Medical Imaging Services Revenue Share (%), by Country 2024 & 2032
- Figure 26: Asia Pacific Mobile Medical Imaging Services Revenue (million), by Application 2024 & 2032
- Figure 27: Asia Pacific Mobile Medical Imaging Services Revenue Share (%), by Application 2024 & 2032
- Figure 28: Asia Pacific Mobile Medical Imaging Services Revenue (million), by Types 2024 & 2032
- Figure 29: Asia Pacific Mobile Medical Imaging Services Revenue Share (%), by Types 2024 & 2032
- Figure 30: Asia Pacific Mobile Medical Imaging Services Revenue (million), by Country 2024 & 2032
- Figure 31: Asia Pacific Mobile Medical Imaging Services Revenue Share (%), by Country 2024 & 2032
List of Tables
- Table 1: Global Mobile Medical Imaging Services Revenue million Forecast, by Region 2019 & 2032
- Table 2: Global Mobile Medical Imaging Services Revenue million Forecast, by Application 2019 & 2032
- Table 3: Global Mobile Medical Imaging Services Revenue million Forecast, by Types 2019 & 2032
- Table 4: Global Mobile Medical Imaging Services Revenue million Forecast, by Region 2019 & 2032
- Table 5: Global Mobile Medical Imaging Services Revenue million Forecast, by Application 2019 & 2032
- Table 6: Global Mobile Medical Imaging Services Revenue million Forecast, by Types 2019 & 2032
- Table 7: Global Mobile Medical Imaging Services Revenue million Forecast, by Country 2019 & 2032
- Table 8: United States Mobile Medical Imaging Services Revenue (million) Forecast, by Application 2019 & 2032
- Table 9: Canada Mobile Medical Imaging Services Revenue (million) Forecast, by Application 2019 & 2032
- Table 10: Mexico Mobile Medical Imaging Services Revenue (million) Forecast, by Application 2019 & 2032
- Table 11: Global Mobile Medical Imaging Services Revenue million Forecast, by Application 2019 & 2032
- Table 12: Global Mobile Medical Imaging Services Revenue million Forecast, by Types 2019 & 2032
- Table 13: Global Mobile Medical Imaging Services Revenue million Forecast, by Country 2019 & 2032
- Table 14: Brazil Mobile Medical Imaging Services Revenue (million) Forecast, by Application 2019 & 2032
- Table 15: Argentina Mobile Medical Imaging Services Revenue (million) Forecast, by Application 2019 & 2032
- Table 16: Rest of South America Mobile Medical Imaging Services Revenue (million) Forecast, by Application 2019 & 2032
- Table 17: Global Mobile Medical Imaging Services Revenue million Forecast, by Application 2019 & 2032
- Table 18: Global Mobile Medical Imaging Services Revenue million Forecast, by Types 2019 & 2032
- Table 19: Global Mobile Medical Imaging Services Revenue million Forecast, by Country 2019 & 2032
- Table 20: United Kingdom Mobile Medical Imaging Services Revenue (million) Forecast, by Application 2019 & 2032
- Table 21: Germany Mobile Medical Imaging Services Revenue (million) Forecast, by Application 2019 & 2032
- Table 22: France Mobile Medical Imaging Services Revenue (million) Forecast, by Application 2019 & 2032
- Table 23: Italy Mobile Medical Imaging Services Revenue (million) Forecast, by Application 2019 & 2032
- Table 24: Spain Mobile Medical Imaging Services Revenue (million) Forecast, by Application 2019 & 2032
- Table 25: Russia Mobile Medical Imaging Services Revenue (million) Forecast, by Application 2019 & 2032
- Table 26: Benelux Mobile Medical Imaging Services Revenue (million) Forecast, by Application 2019 & 2032
- Table 27: Nordics Mobile Medical Imaging Services Revenue (million) Forecast, by Application 2019 & 2032
- Table 28: Rest of Europe Mobile Medical Imaging Services Revenue (million) Forecast, by Application 2019 & 2032
- Table 29: Global Mobile Medical Imaging Services Revenue million Forecast, by Application 2019 & 2032
- Table 30: Global Mobile Medical Imaging Services Revenue million Forecast, by Types 2019 & 2032
- Table 31: Global Mobile Medical Imaging Services Revenue million Forecast, by Country 2019 & 2032
- Table 32: Turkey Mobile Medical Imaging Services Revenue (million) Forecast, by Application 2019 & 2032
- Table 33: Israel Mobile Medical Imaging Services Revenue (million) Forecast, by Application 2019 & 2032
- Table 34: GCC Mobile Medical Imaging Services Revenue (million) Forecast, by Application 2019 & 2032
- Table 35: North Africa Mobile Medical Imaging Services Revenue (million) Forecast, by Application 2019 & 2032
- Table 36: South Africa Mobile Medical Imaging Services Revenue (million) Forecast, by Application 2019 & 2032
- Table 37: Rest of Middle East & Africa Mobile Medical Imaging Services Revenue (million) Forecast, by Application 2019 & 2032
- Table 38: Global Mobile Medical Imaging Services Revenue million Forecast, by Application 2019 & 2032
- Table 39: Global Mobile Medical Imaging Services Revenue million Forecast, by Types 2019 & 2032
- Table 40: Global Mobile Medical Imaging Services Revenue million Forecast, by Country 2019 & 2032
- Table 41: China Mobile Medical Imaging Services Revenue (million) Forecast, by Application 2019 & 2032
- Table 42: India Mobile Medical Imaging Services Revenue (million) Forecast, by Application 2019 & 2032
- Table 43: Japan Mobile Medical Imaging Services Revenue (million) Forecast, by Application 2019 & 2032
- Table 44: South Korea Mobile Medical Imaging Services Revenue (million) Forecast, by Application 2019 & 2032
- Table 45: ASEAN Mobile Medical Imaging Services Revenue (million) Forecast, by Application 2019 & 2032
- Table 46: Oceania Mobile Medical Imaging Services Revenue (million) Forecast, by Application 2019 & 2032
- Table 47: Rest of Asia Pacific Mobile Medical Imaging Services Revenue (million) Forecast, by Application 2019 & 2032
Frequently Asked Questions
1. What is the projected Compound Annual Growth Rate (CAGR) of the Mobile Medical Imaging Services?
The projected CAGR is approximately XX%.
2. Which companies are prominent players in the Mobile Medical Imaging Services?
Key companies in the market include Alliance HealthCare Services, Alliance Medical, Digirad Corporation, InHealth, Shared Medical Services, Accurate Imaging, Aged Care Imaging, Center for Diagnostic Imaging, Oxford Instruments, TridentUSA Health Services.
3. What are the main segments of the Mobile Medical Imaging Services?
The market segments include Application, Types.
4. Can you provide details about the market size?
The market size is estimated to be USD XXX million as of 2022.
5. What are some drivers contributing to market growth?
N/A
6. What are the notable trends driving market growth?
N/A
7. Are there any restraints impacting market growth?
N/A
8. Can you provide examples of recent developments in the market?
N/A
9. What pricing options are available for accessing the report?
Pricing options include single-user, multi-user, and enterprise licenses priced at USD 4900.00, USD 7350.00, and USD 9800.00 respectively.
10. Is the market size provided in terms of value or volume?
The market size is provided in terms of value, measured in million.
11. Are there any specific market keywords associated with the report?
Yes, the market keyword associated with the report is "Mobile Medical Imaging Services," which aids in identifying and referencing the specific market segment covered.
12. How do I determine which pricing option suits my needs best?
The pricing options vary based on user requirements and access needs. Individual users may opt for single-user licenses, while businesses requiring broader access may choose multi-user or enterprise licenses for cost-effective access to the report.
13. Are there any additional resources or data provided in the Mobile Medical Imaging Services report?
While the report offers comprehensive insights, it's advisable to review the specific contents or supplementary materials provided to ascertain if additional resources or data are available.
14. How can I stay updated on further developments or reports in the Mobile Medical Imaging Services?
To stay informed about further developments, trends, and reports in the Mobile Medical Imaging Services, consider subscribing to industry newsletters, following relevant companies and organizations, or regularly checking reputable industry news sources and publications.
Methodology
Step 1 - Identification of Relevant Samples Size from Population Database


Step 2 - Approaches for Defining Global Market Size (Value, Volume* & Price*)

Note*: In applicable scenarios
Step 3 - Data Sources
Primary Research
- Web Analytics
- Survey Reports
- Research Institute
- Latest Research Reports
- Opinion Leaders
Secondary Research
- Annual Reports
- White Paper
- Latest Press Release
- Industry Association
- Paid Database
- Investor Presentations

Step 4 - Data Triangulation
Involves using different sources of information in order to increase the validity of a study
These sources are likely to be stakeholders in a program - participants, other researchers, program staff, other community members, and so on.
Then we put all data in single framework & apply various statistical tools to find out the dynamic on the market.
During the analysis stage, feedback from the stakeholder groups would be compared to determine areas of agreement as well as areas of divergence
